Download as PDF, PPTX
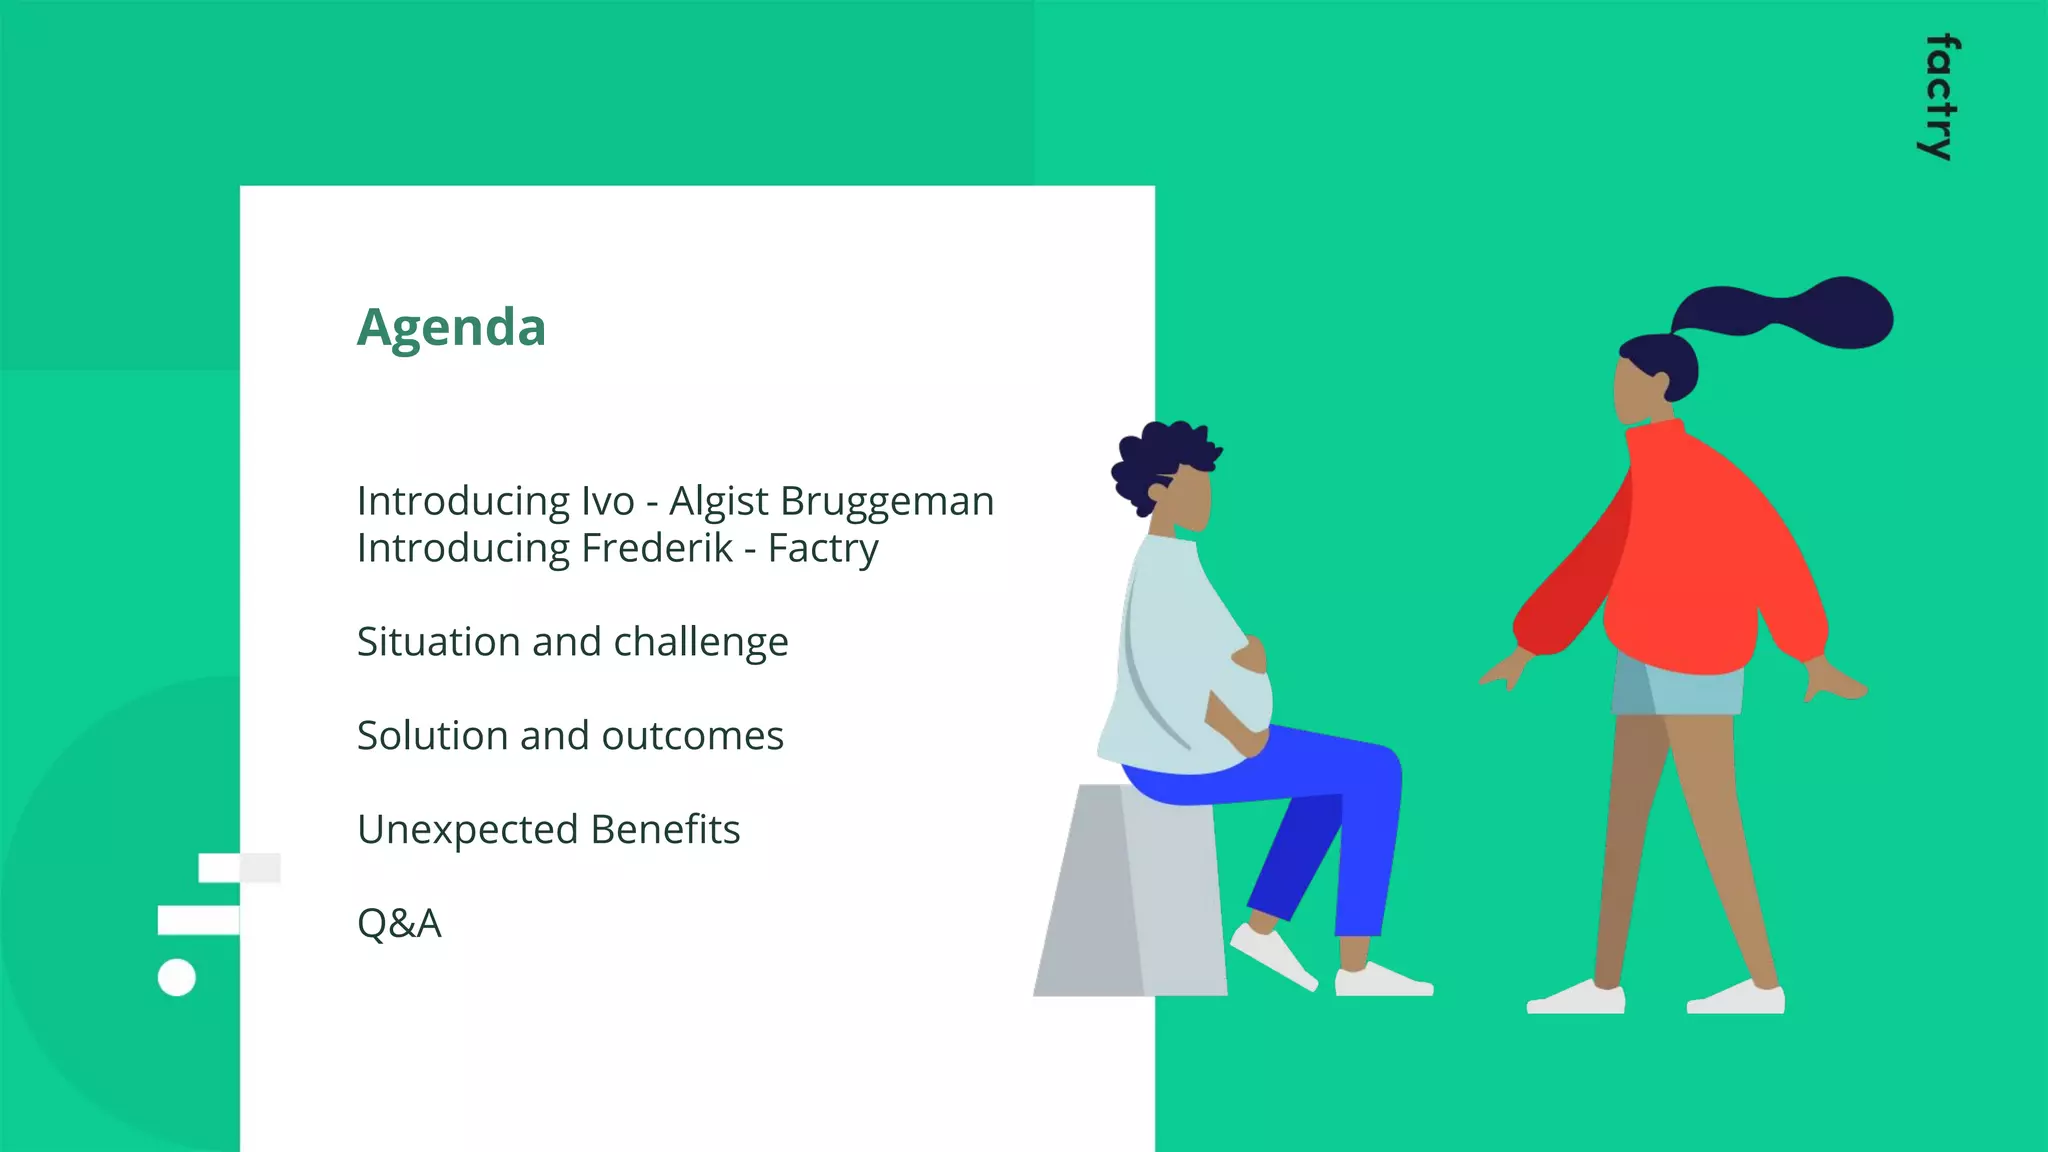
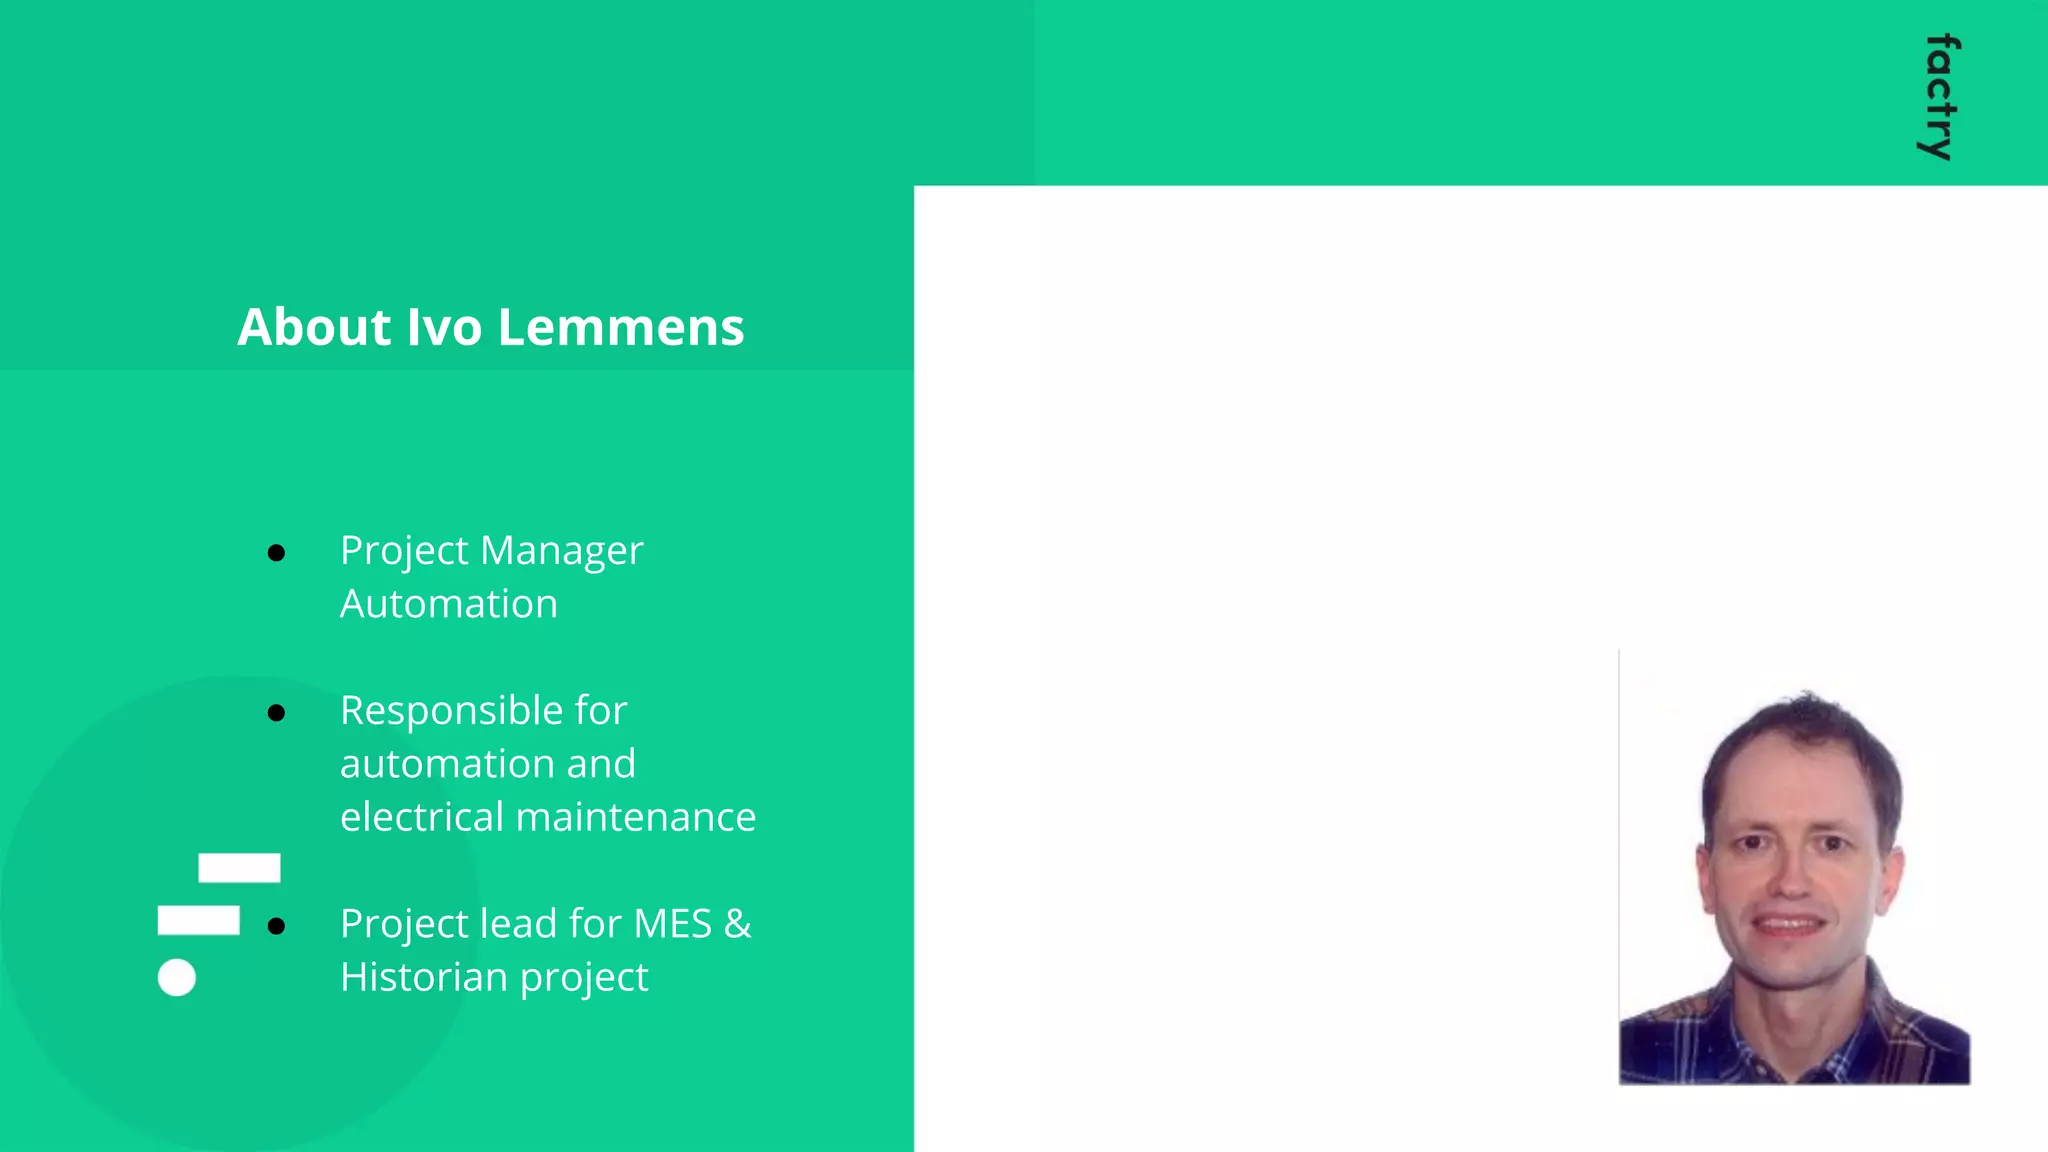
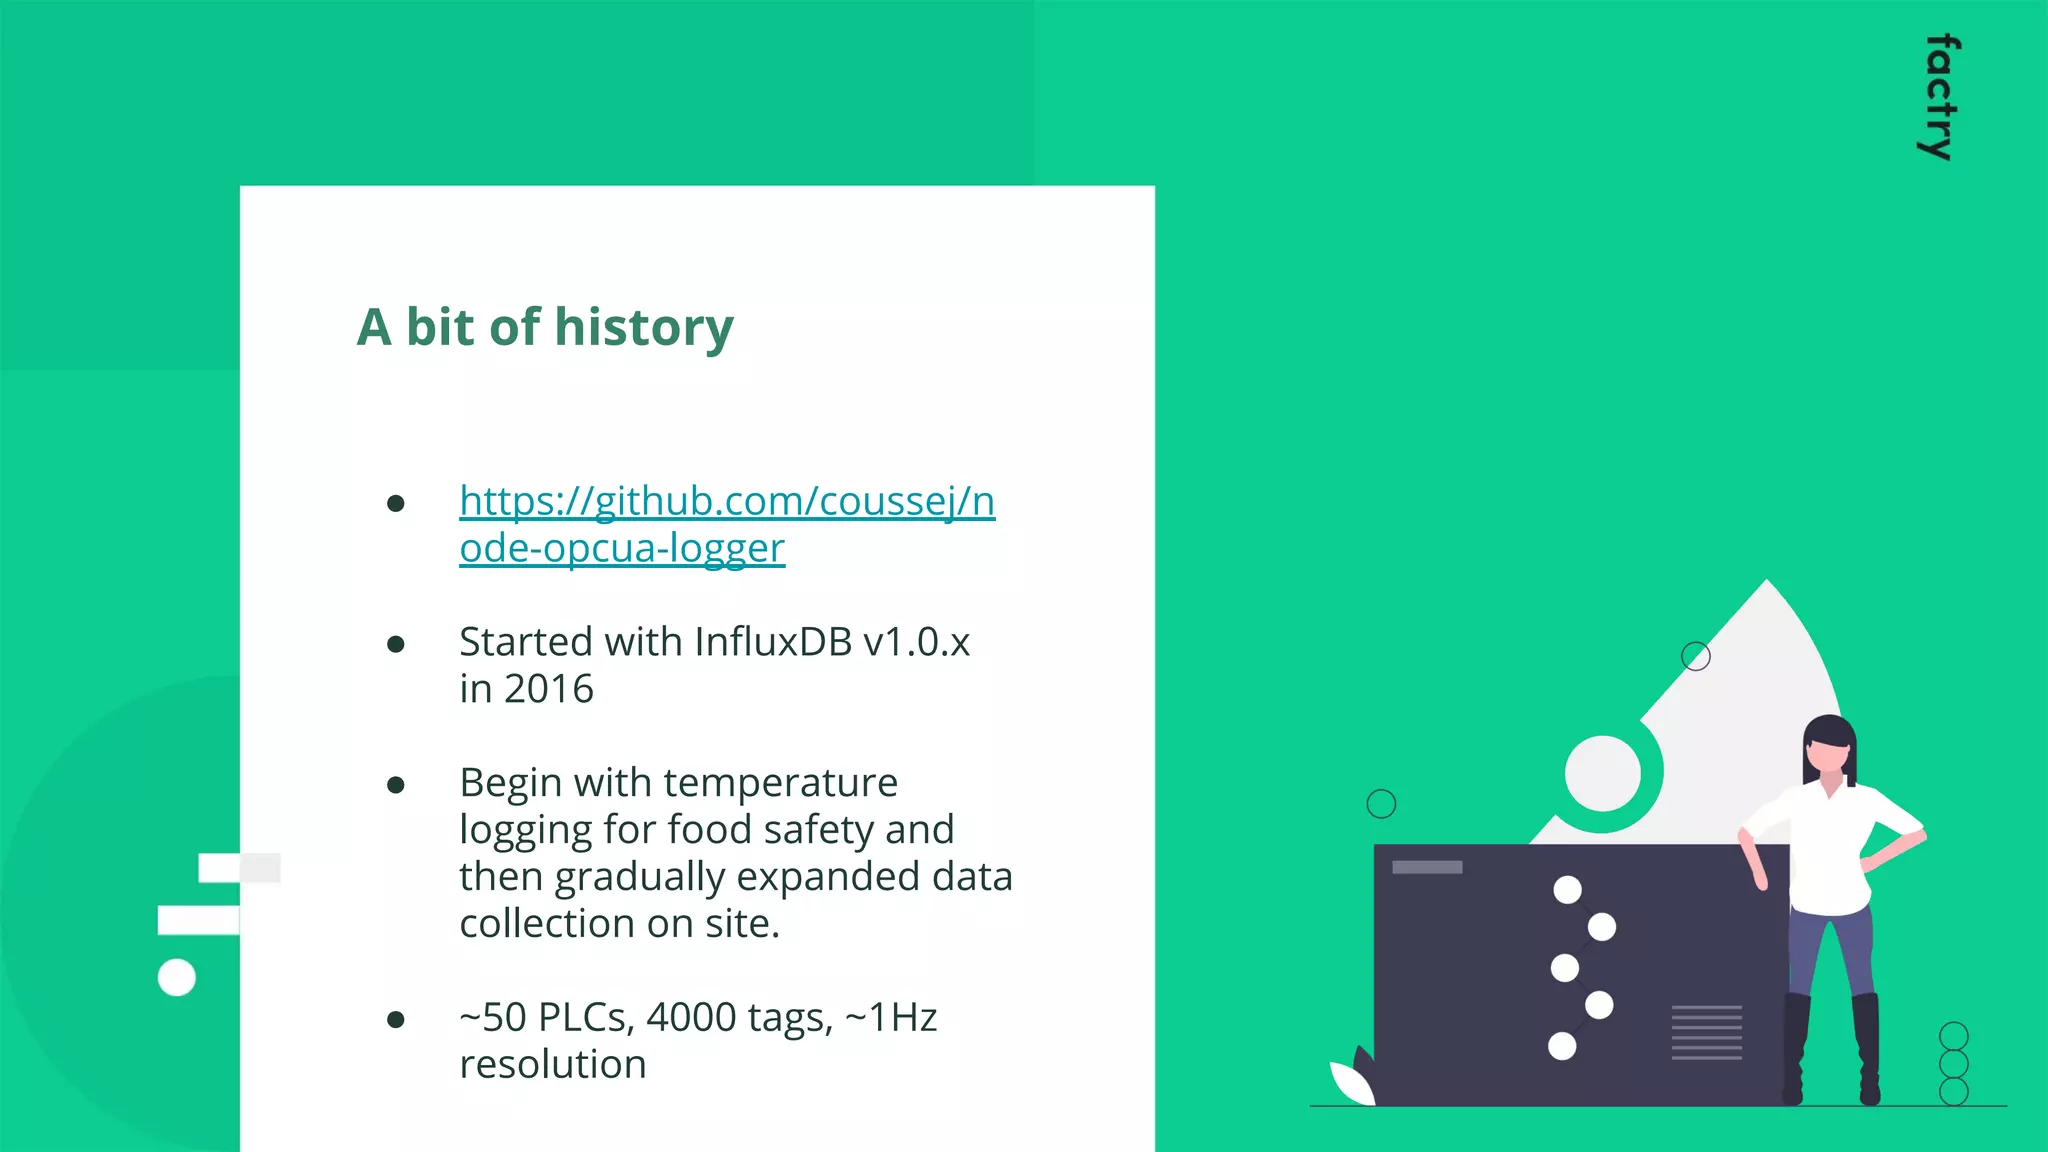

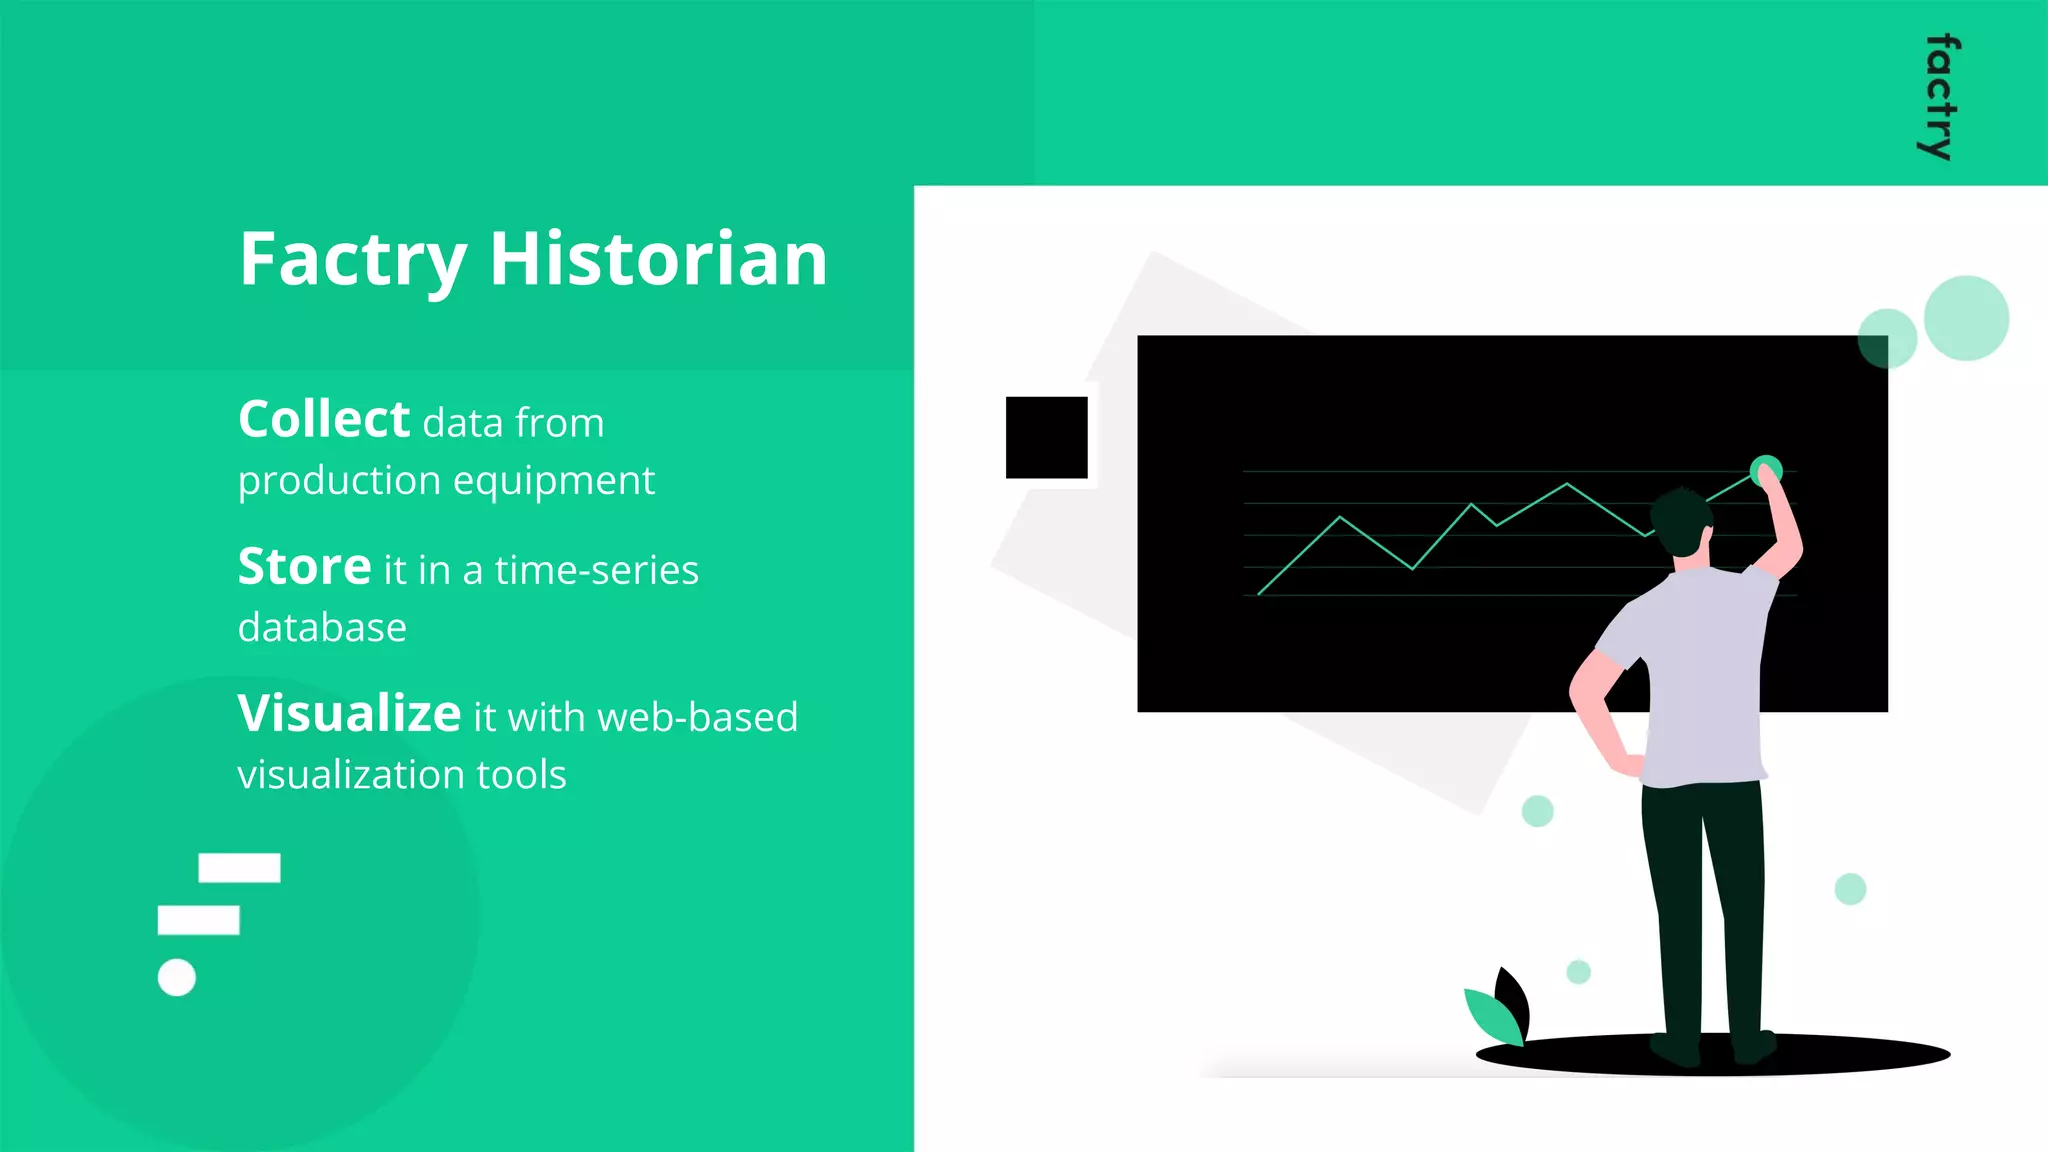
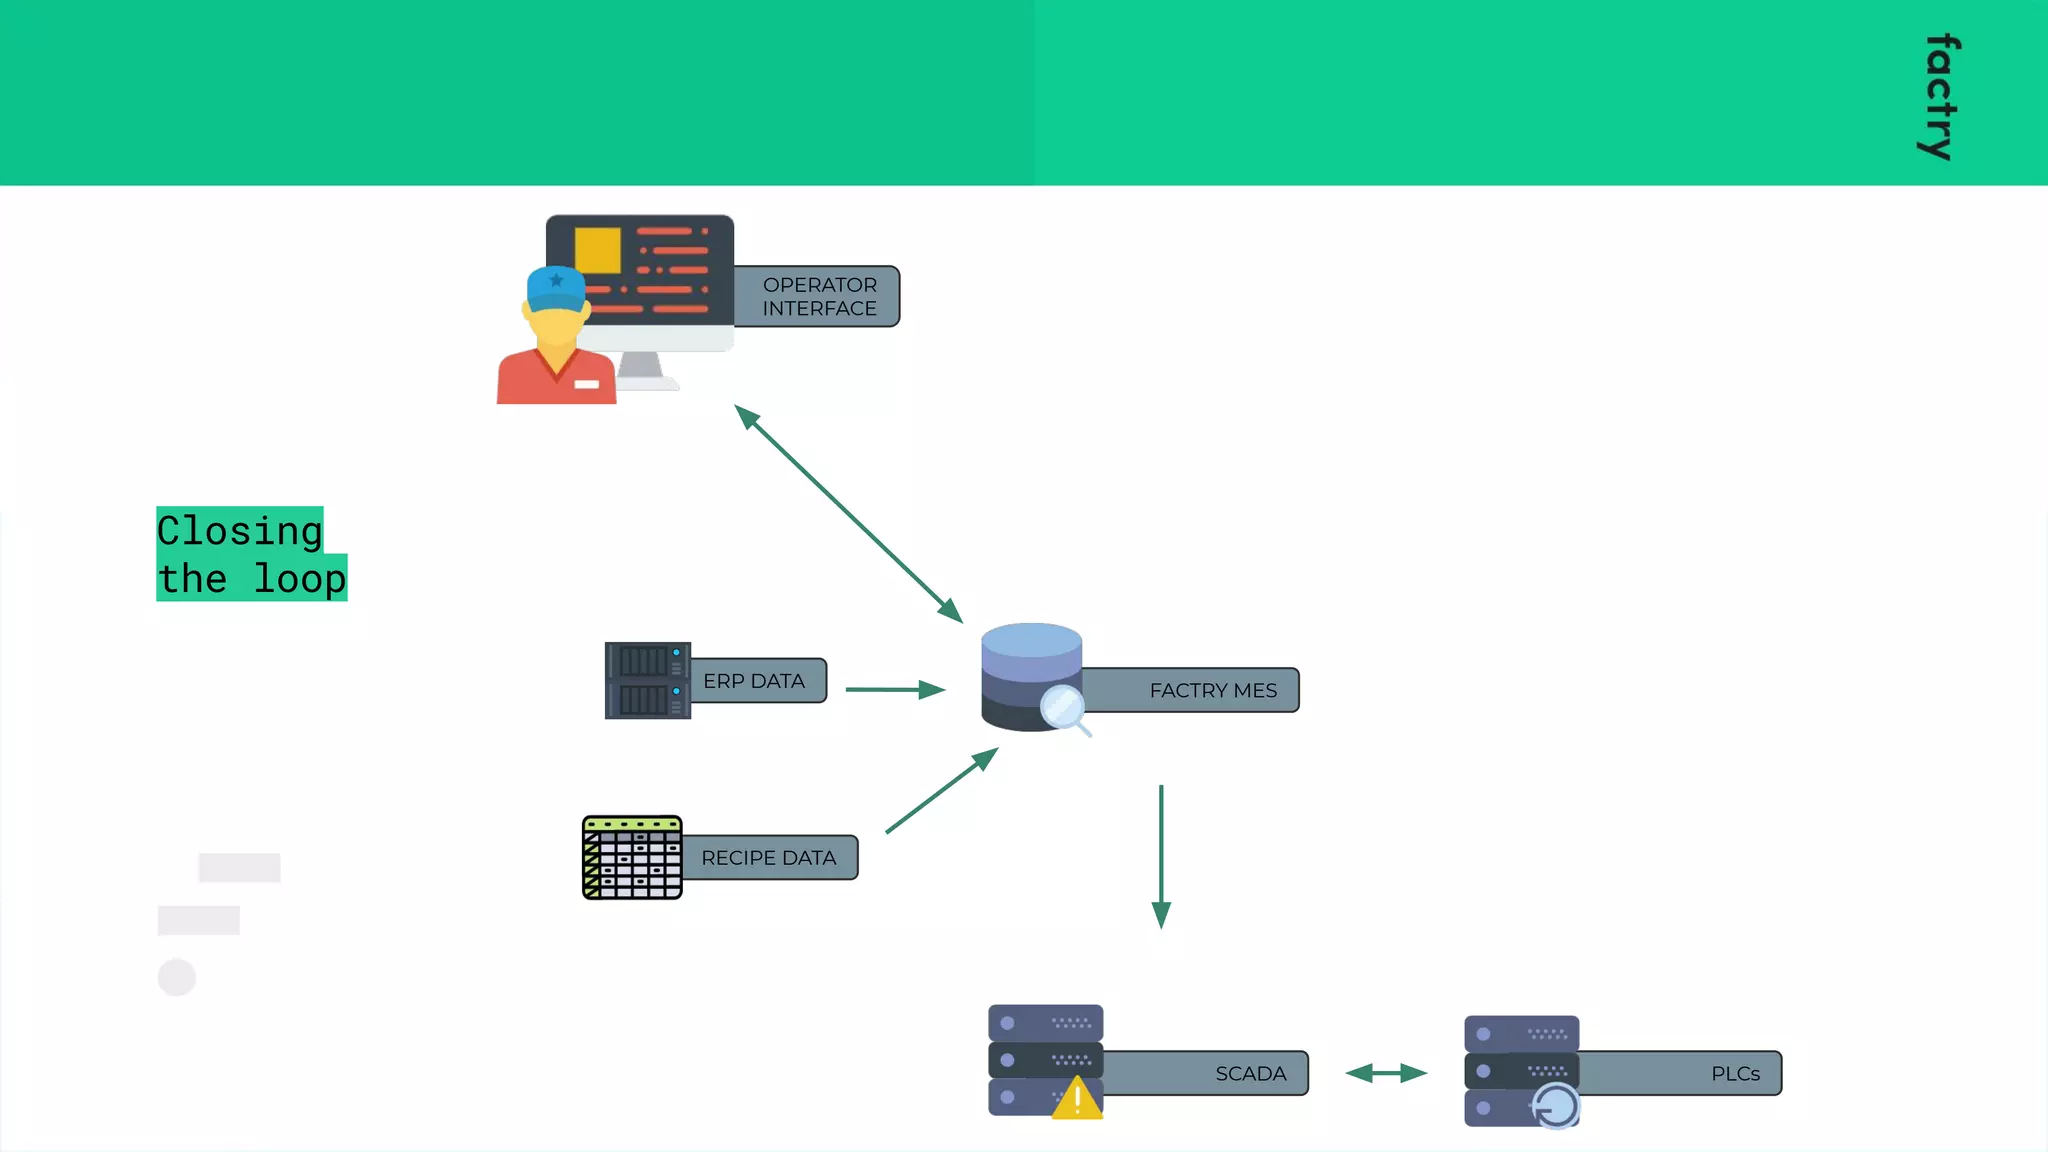
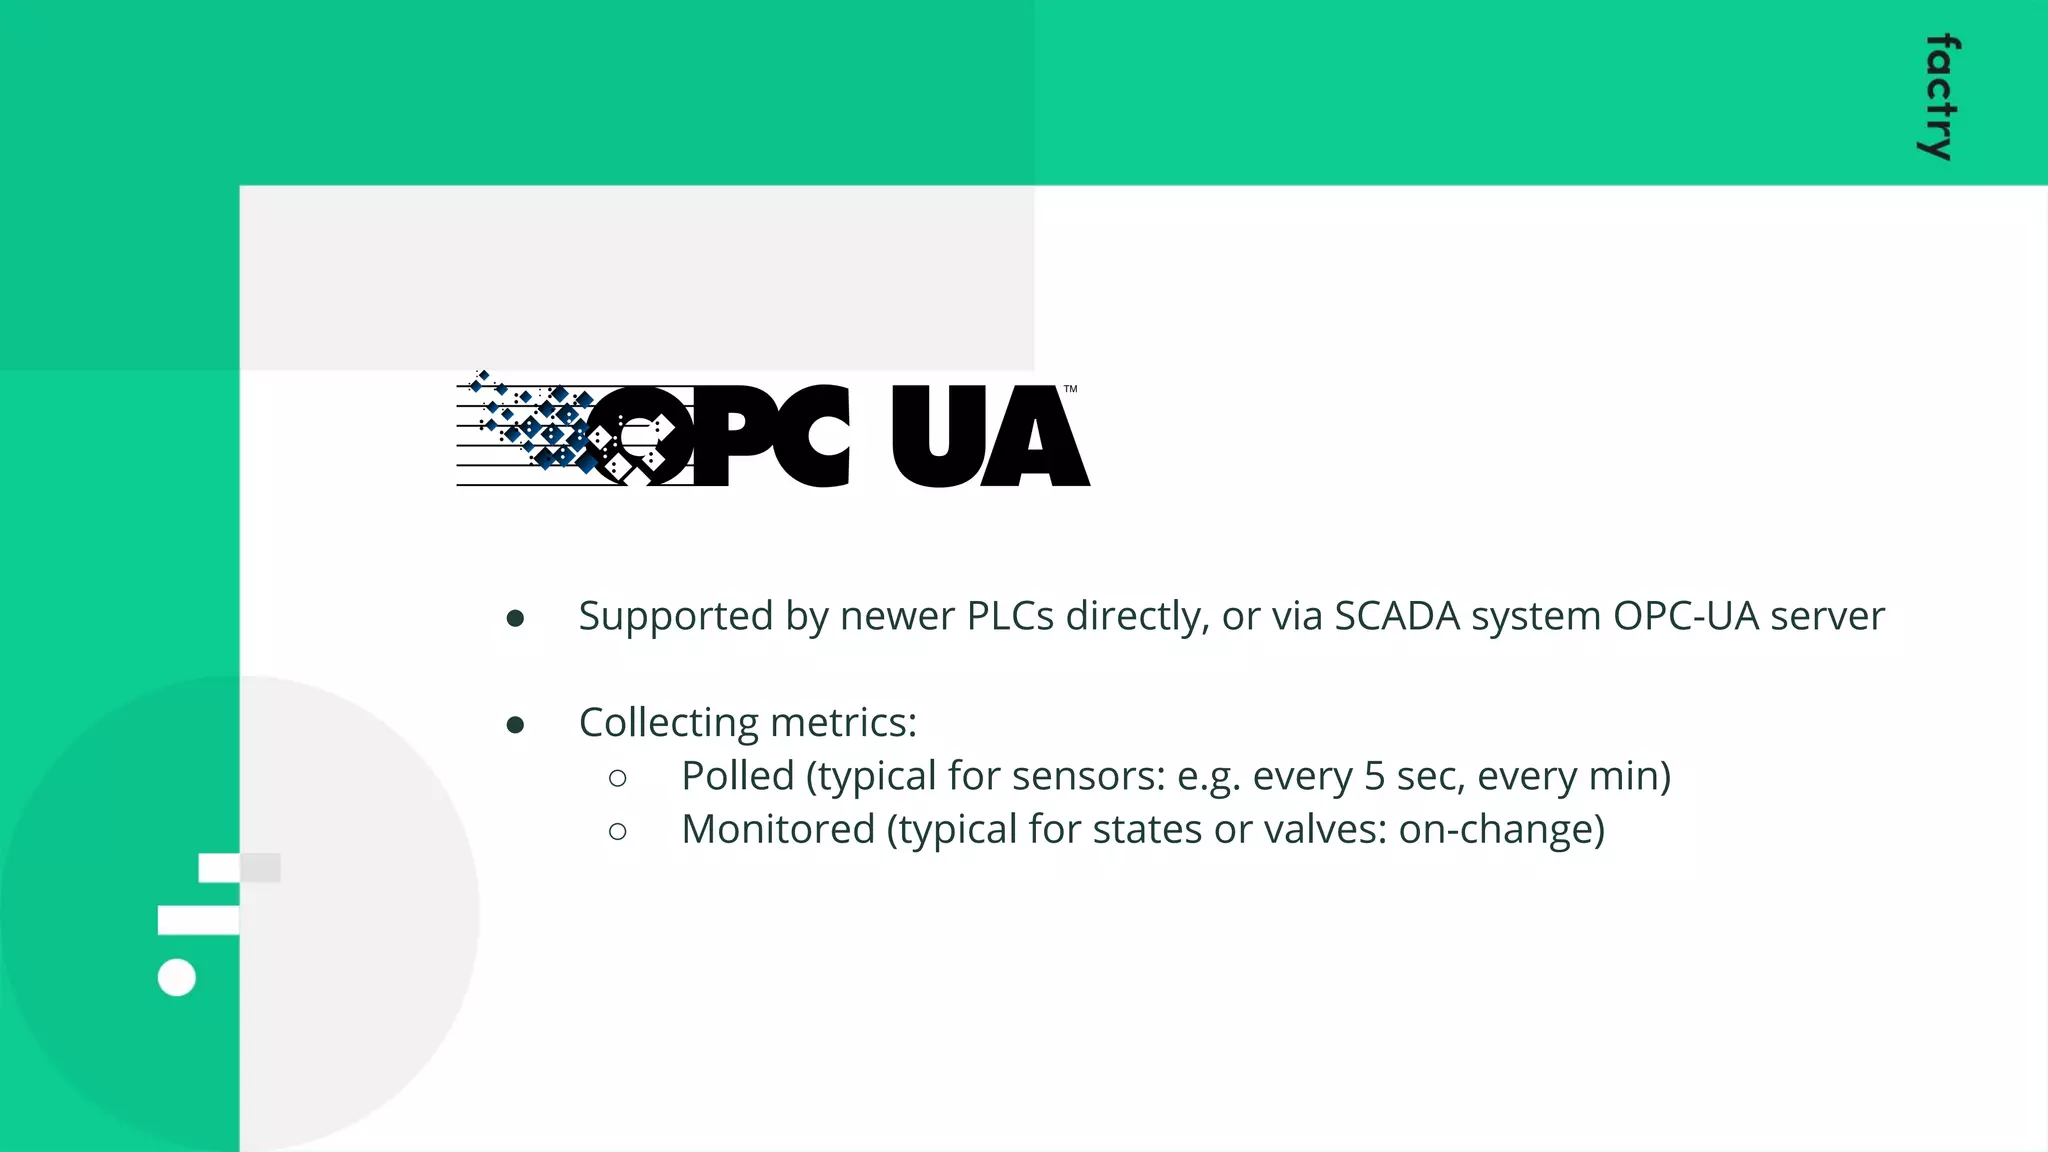
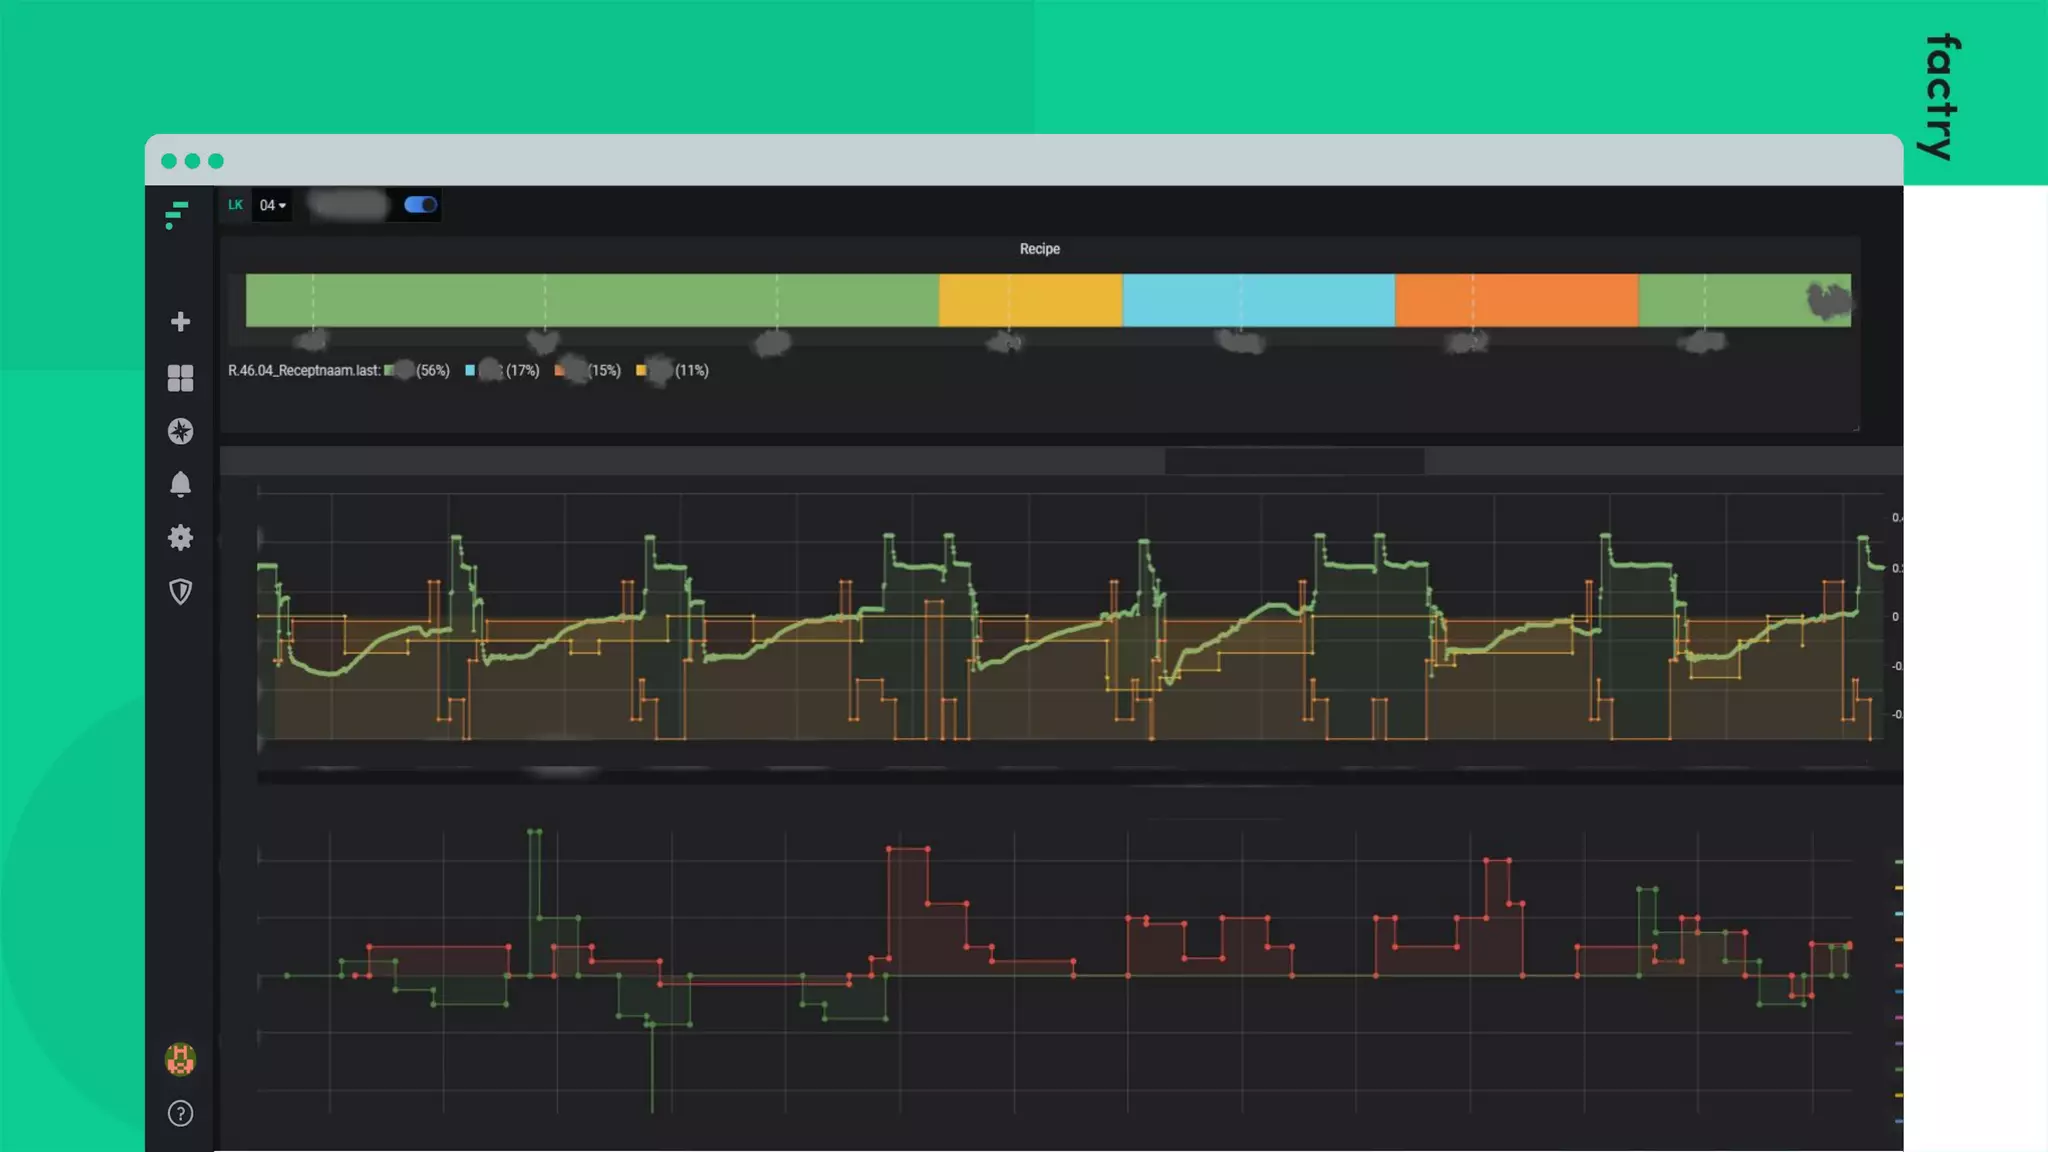
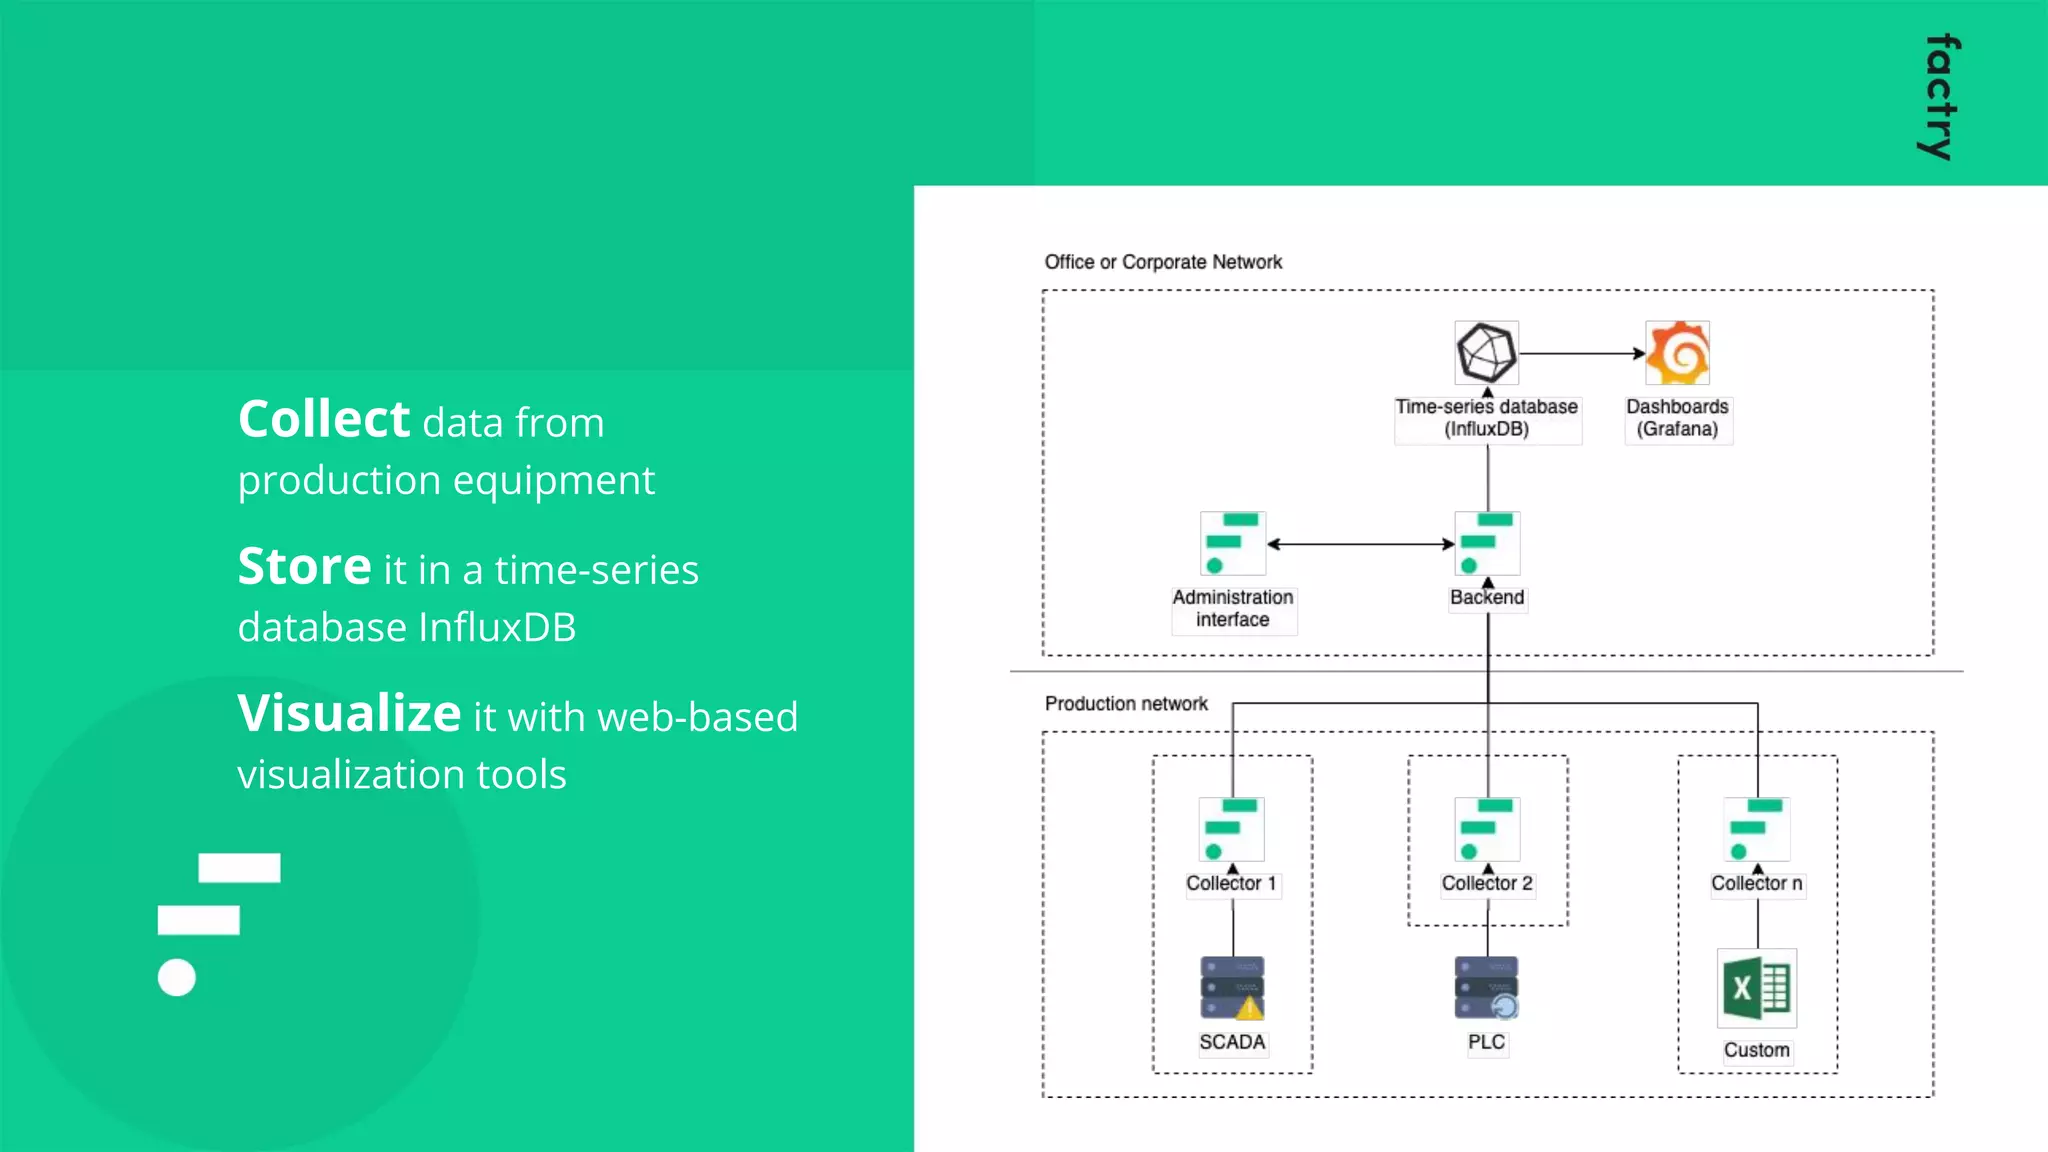

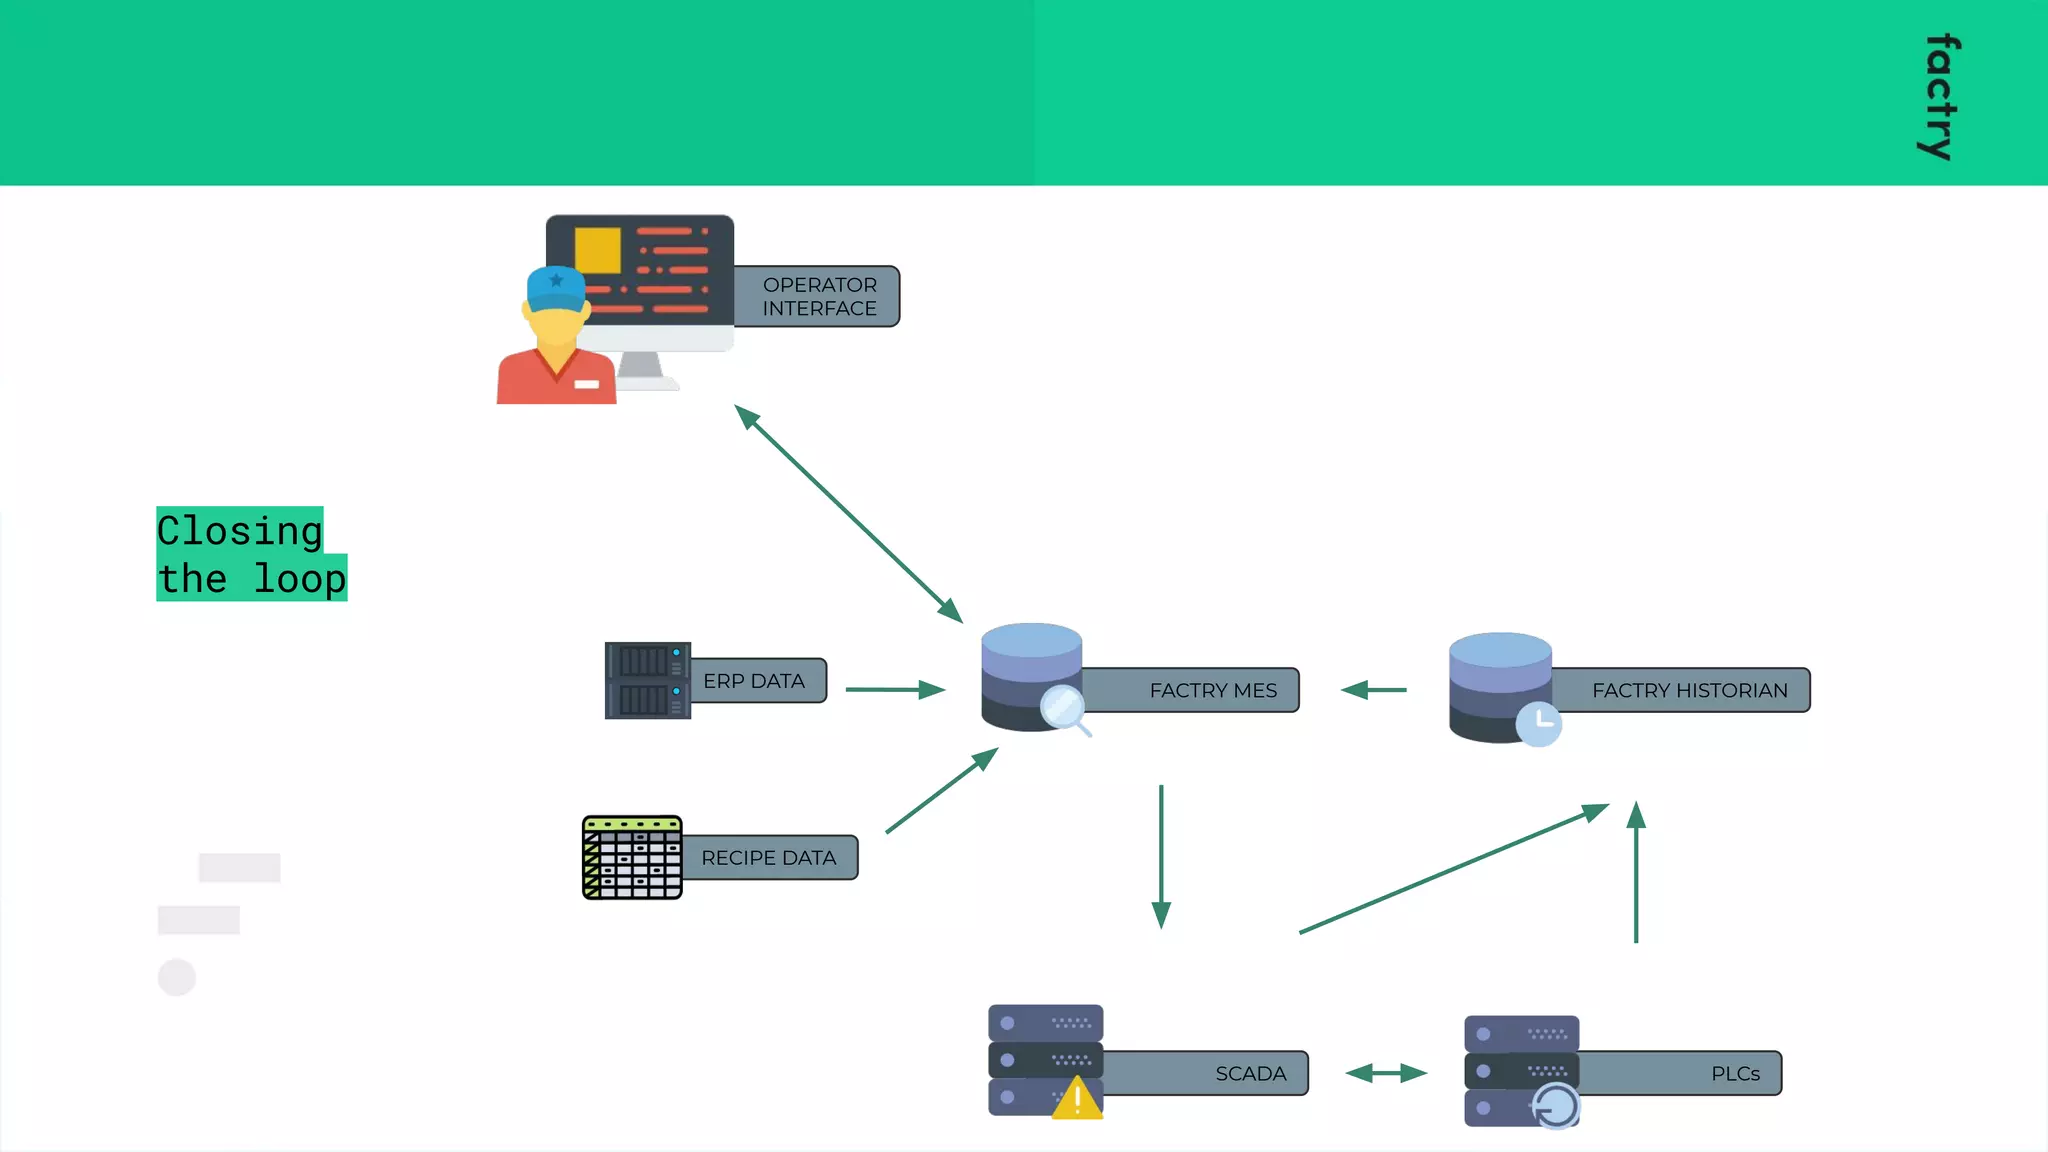
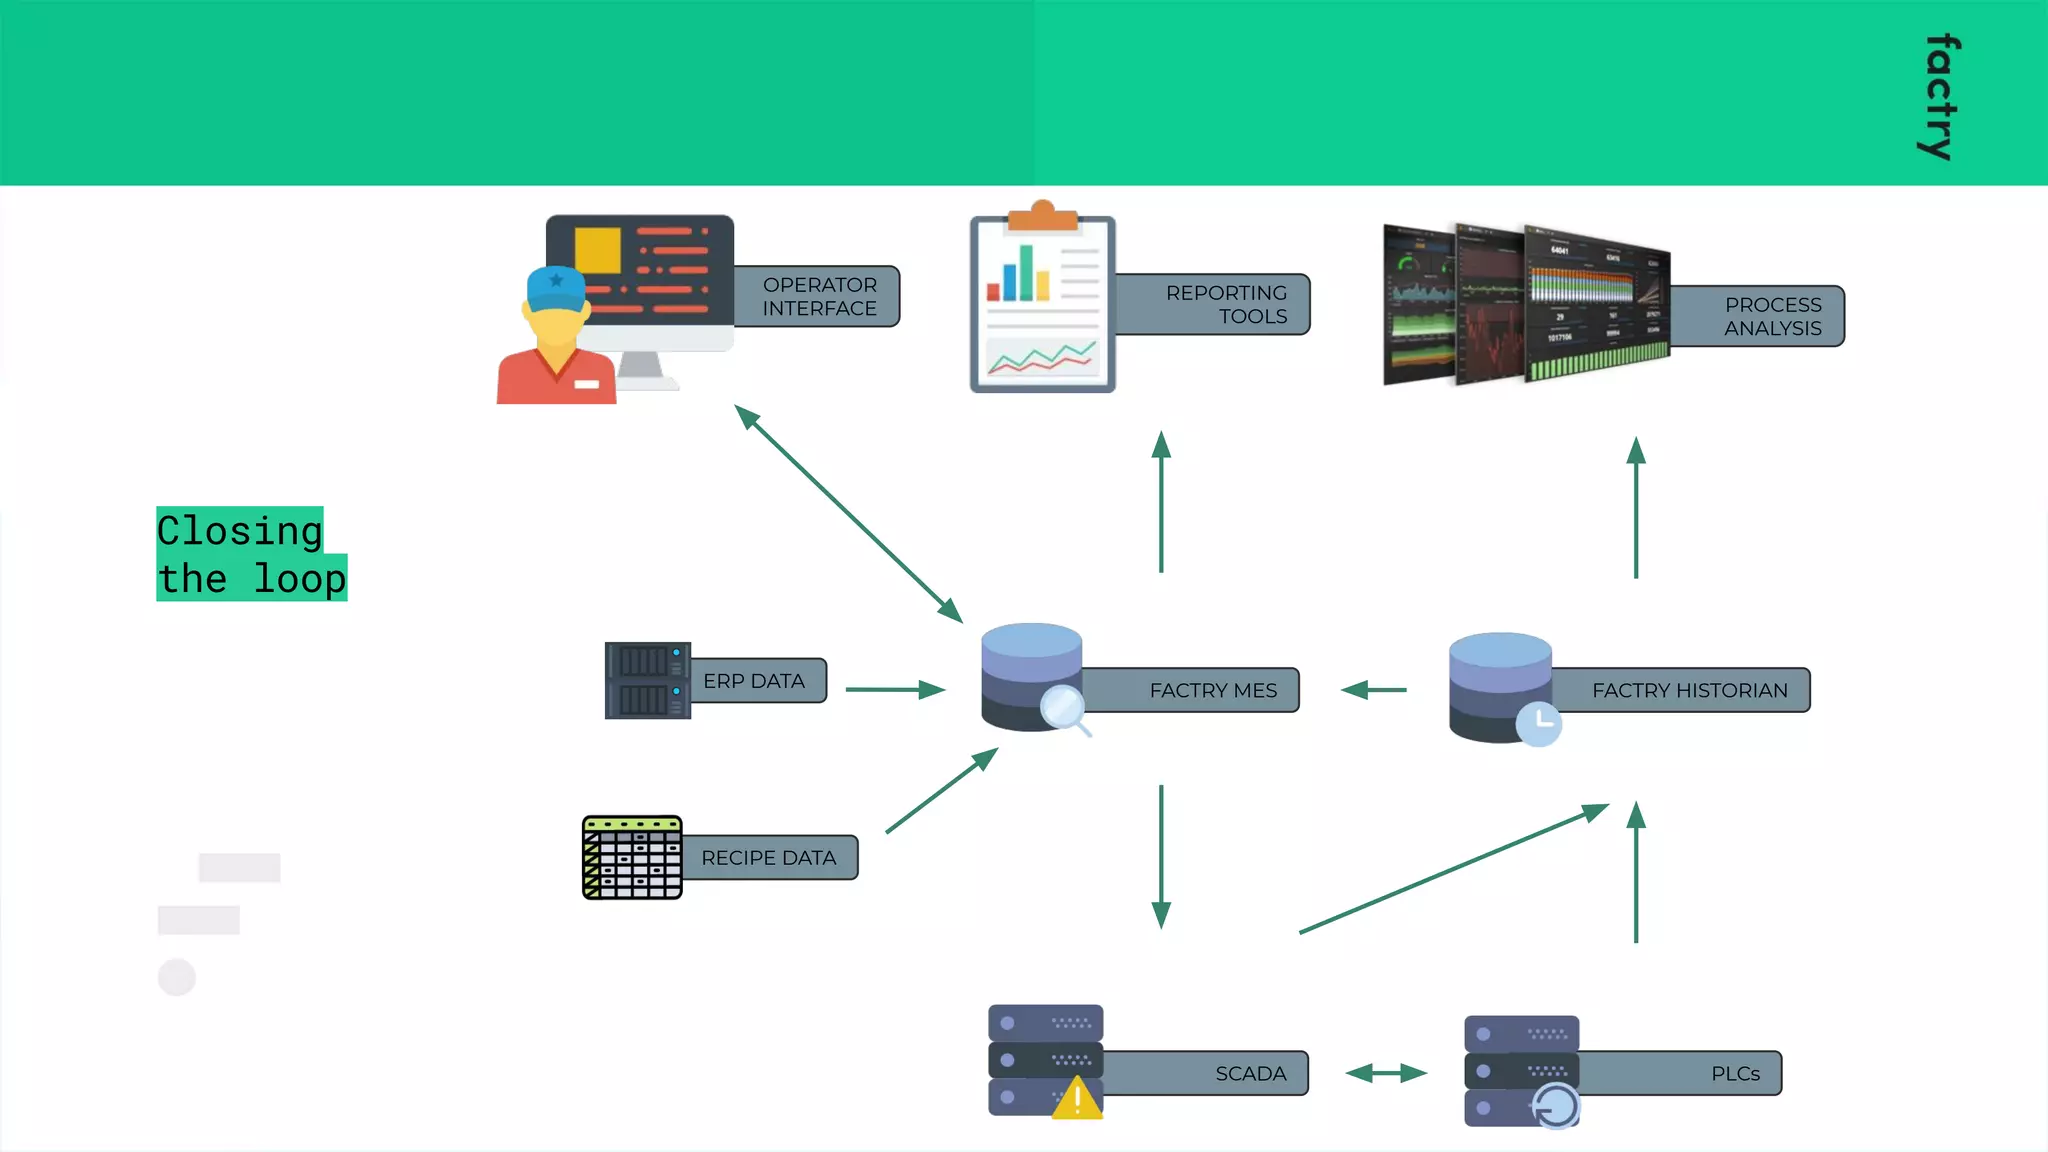
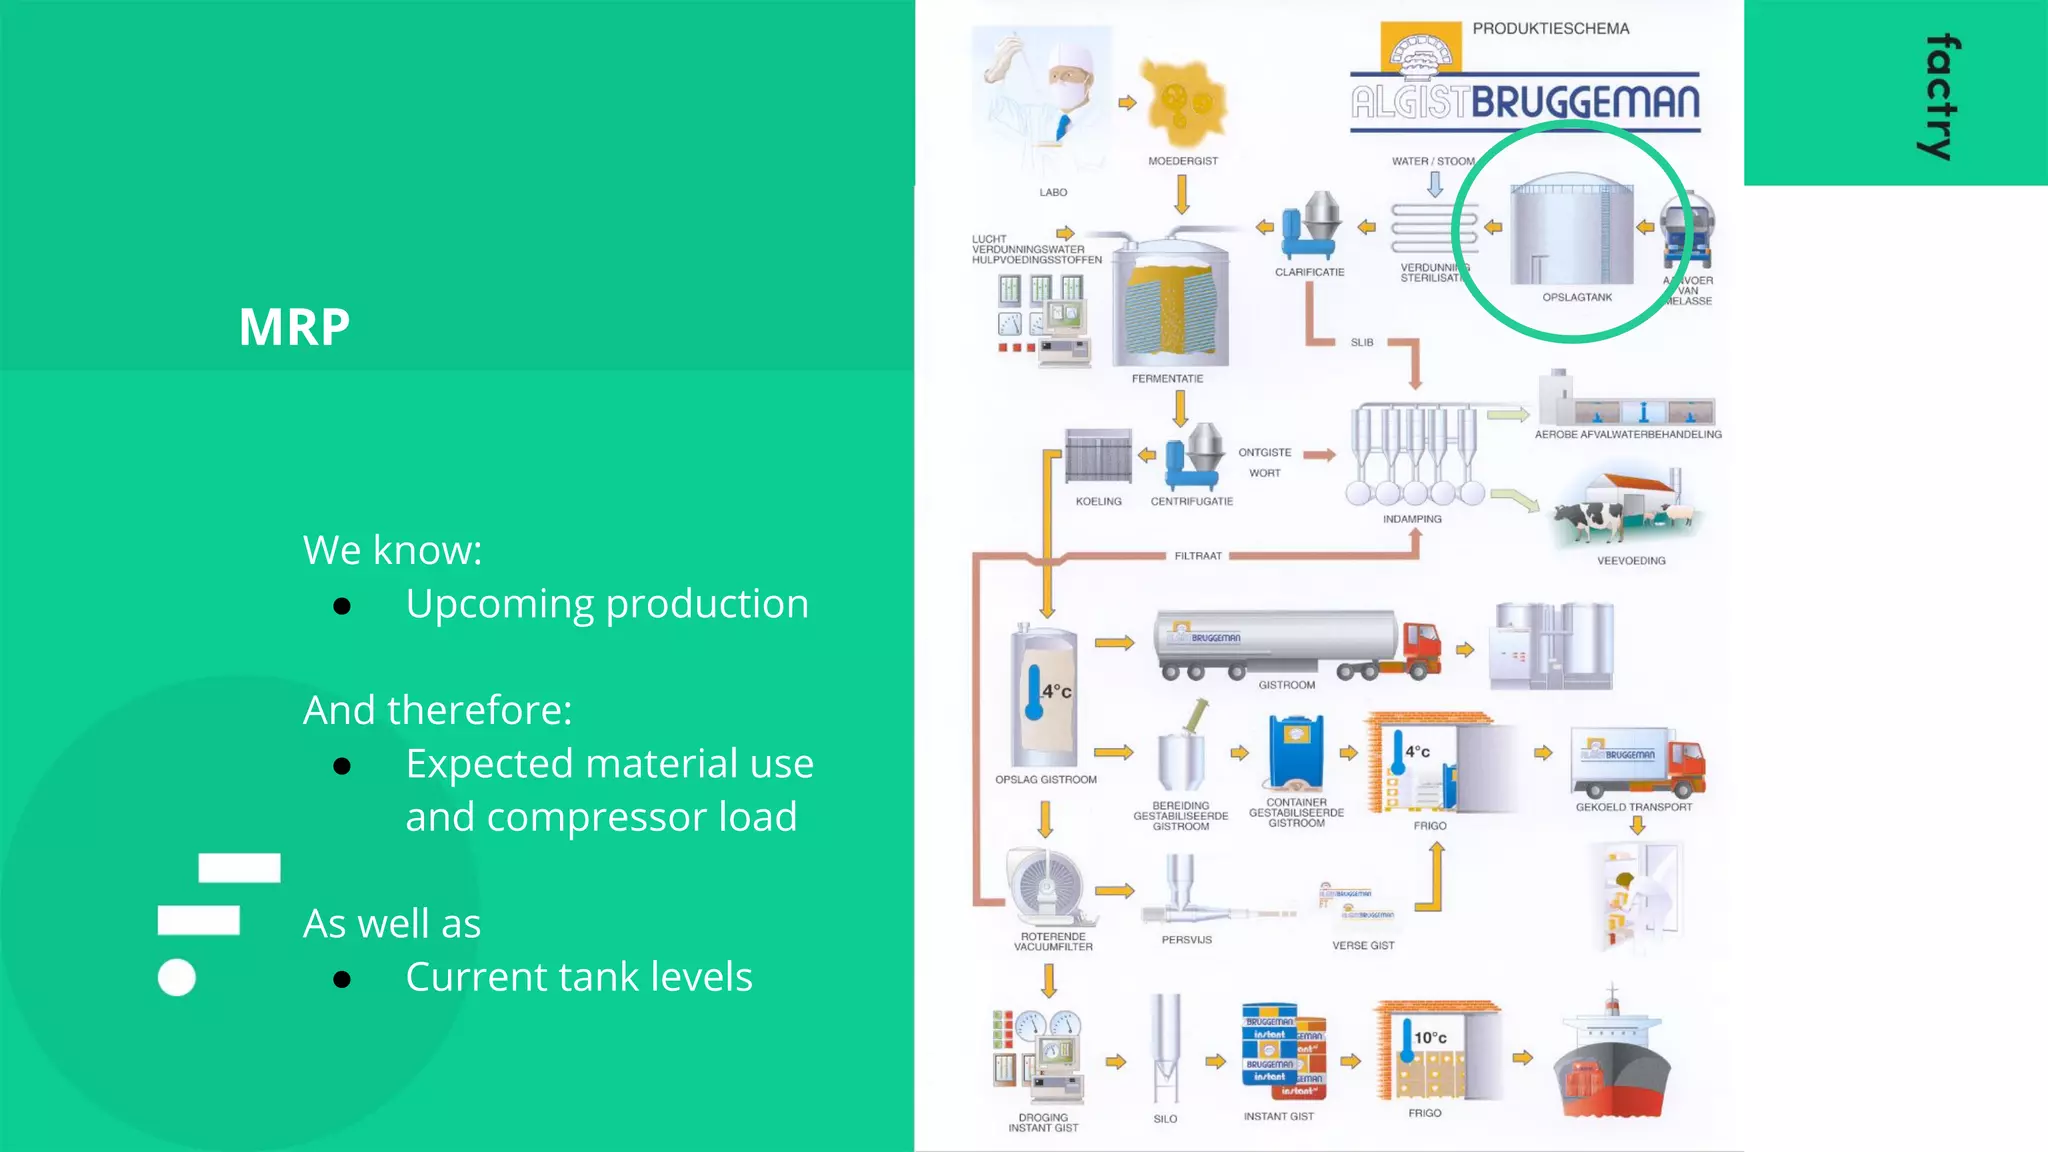
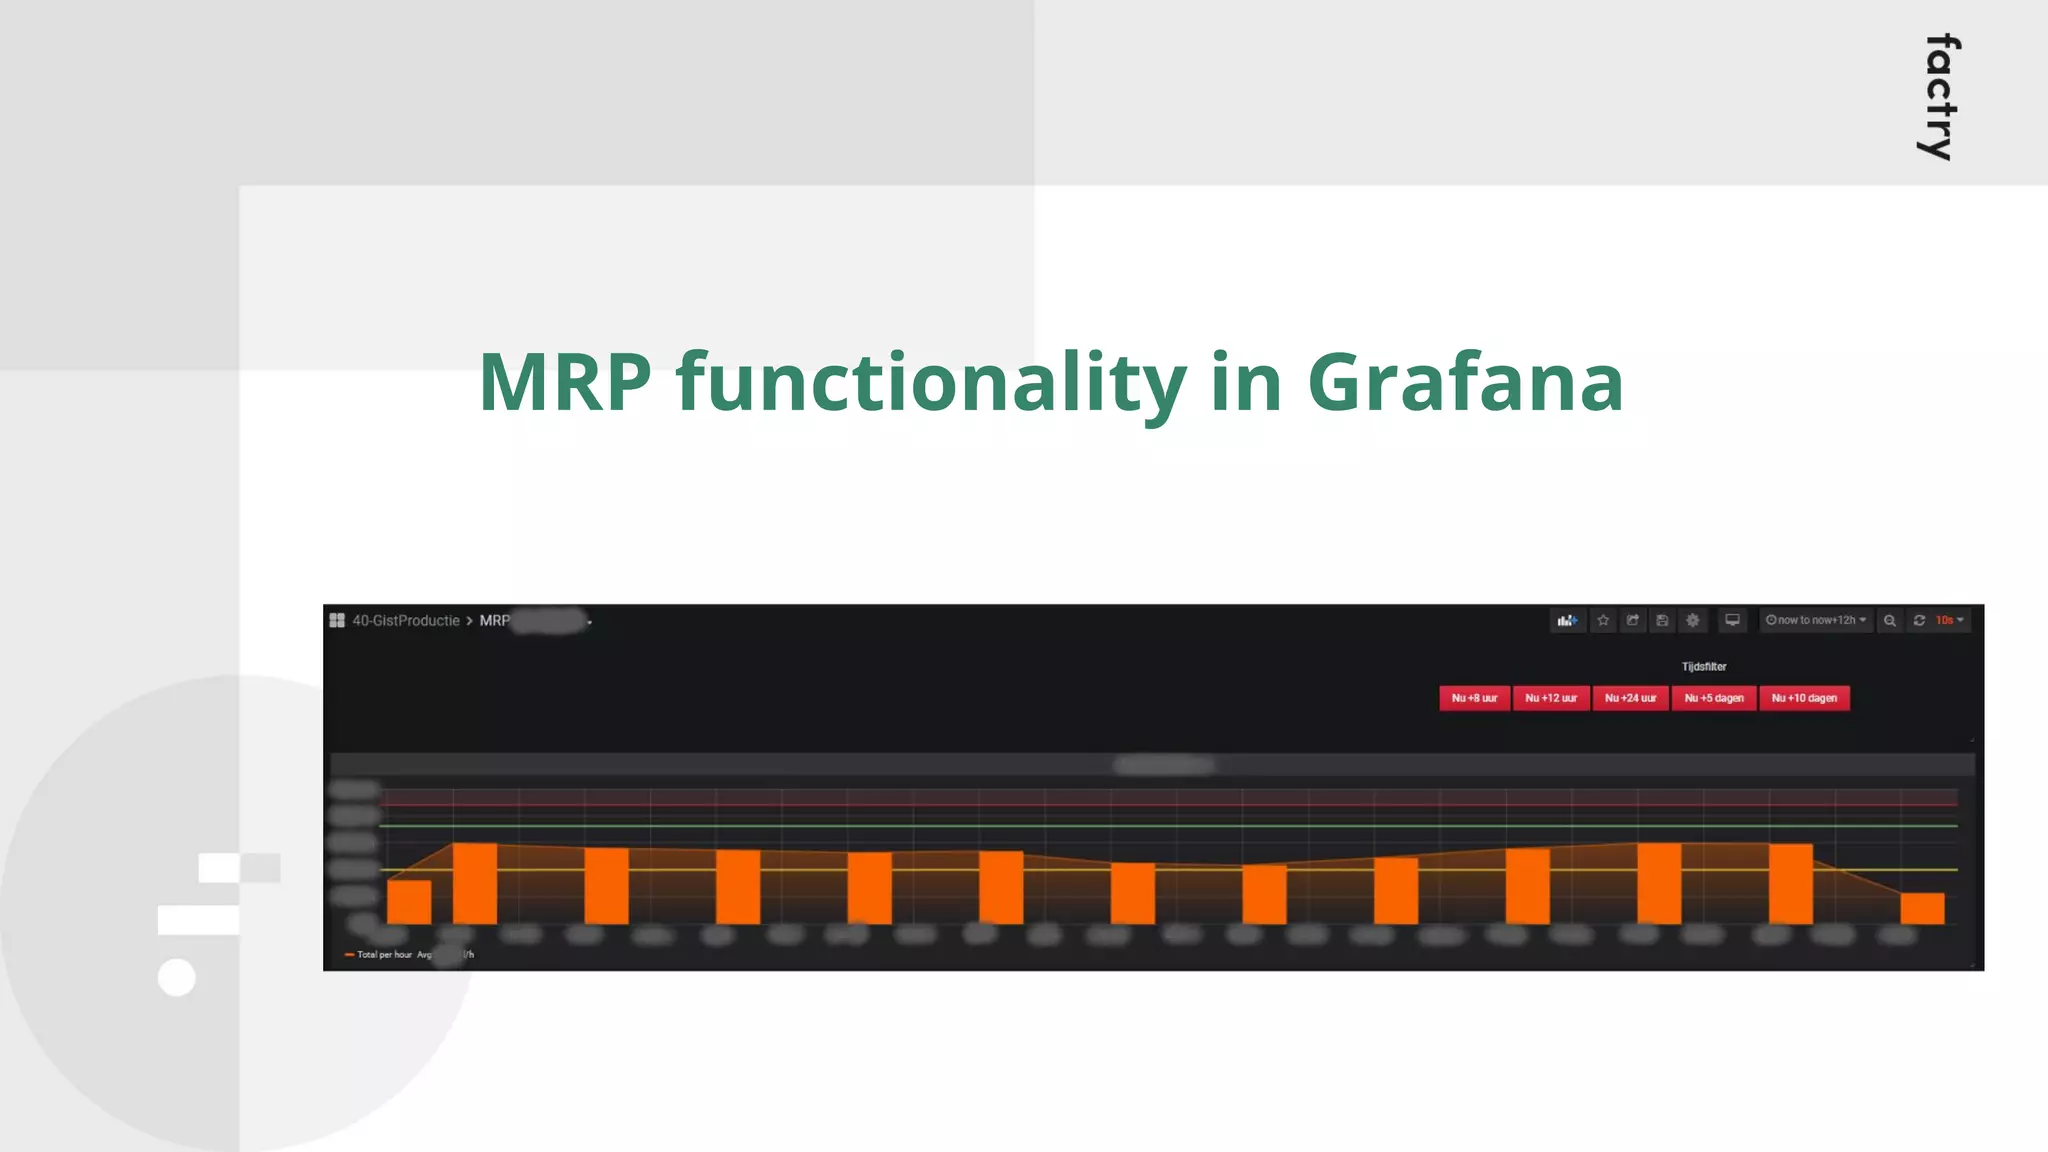
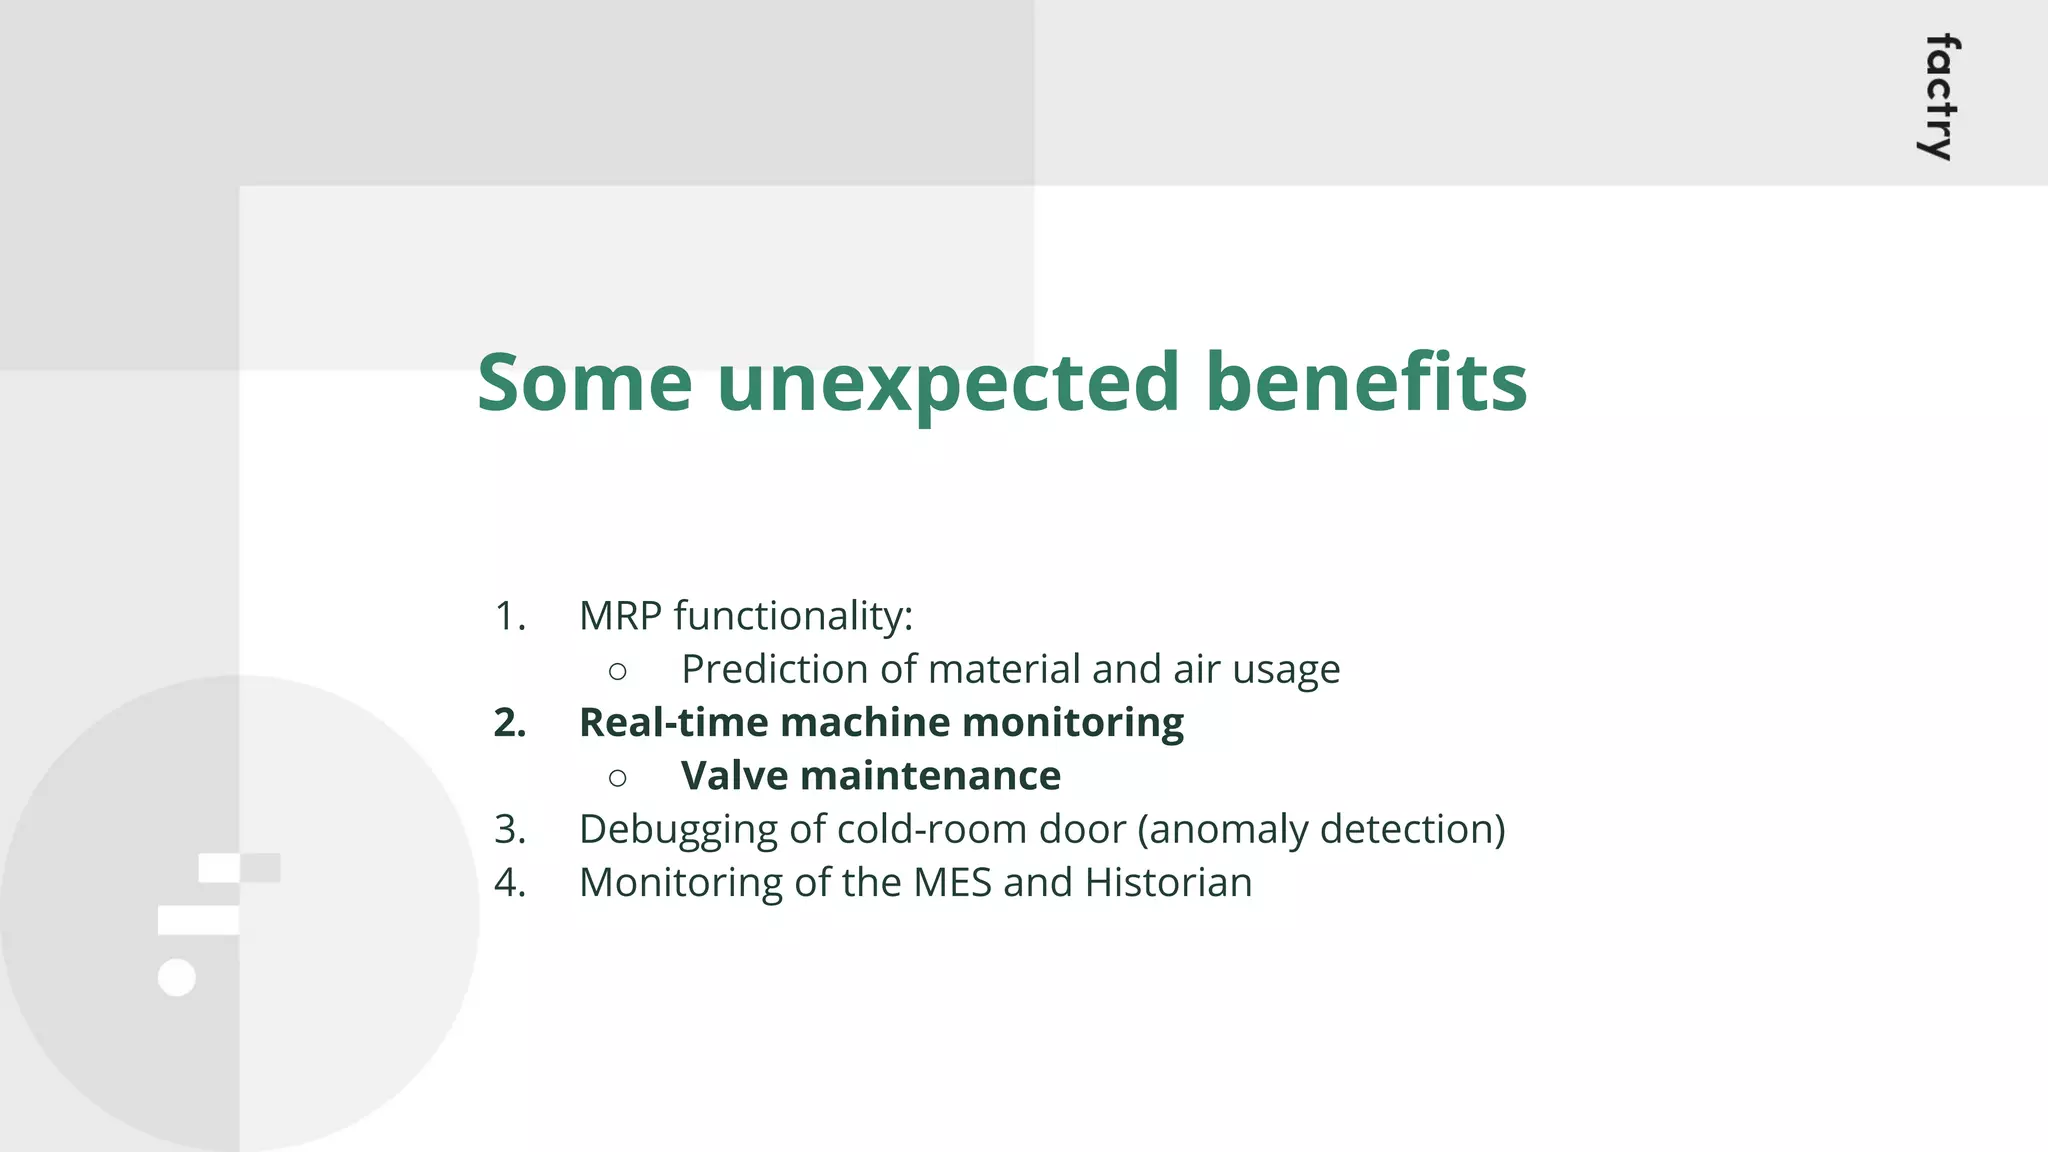
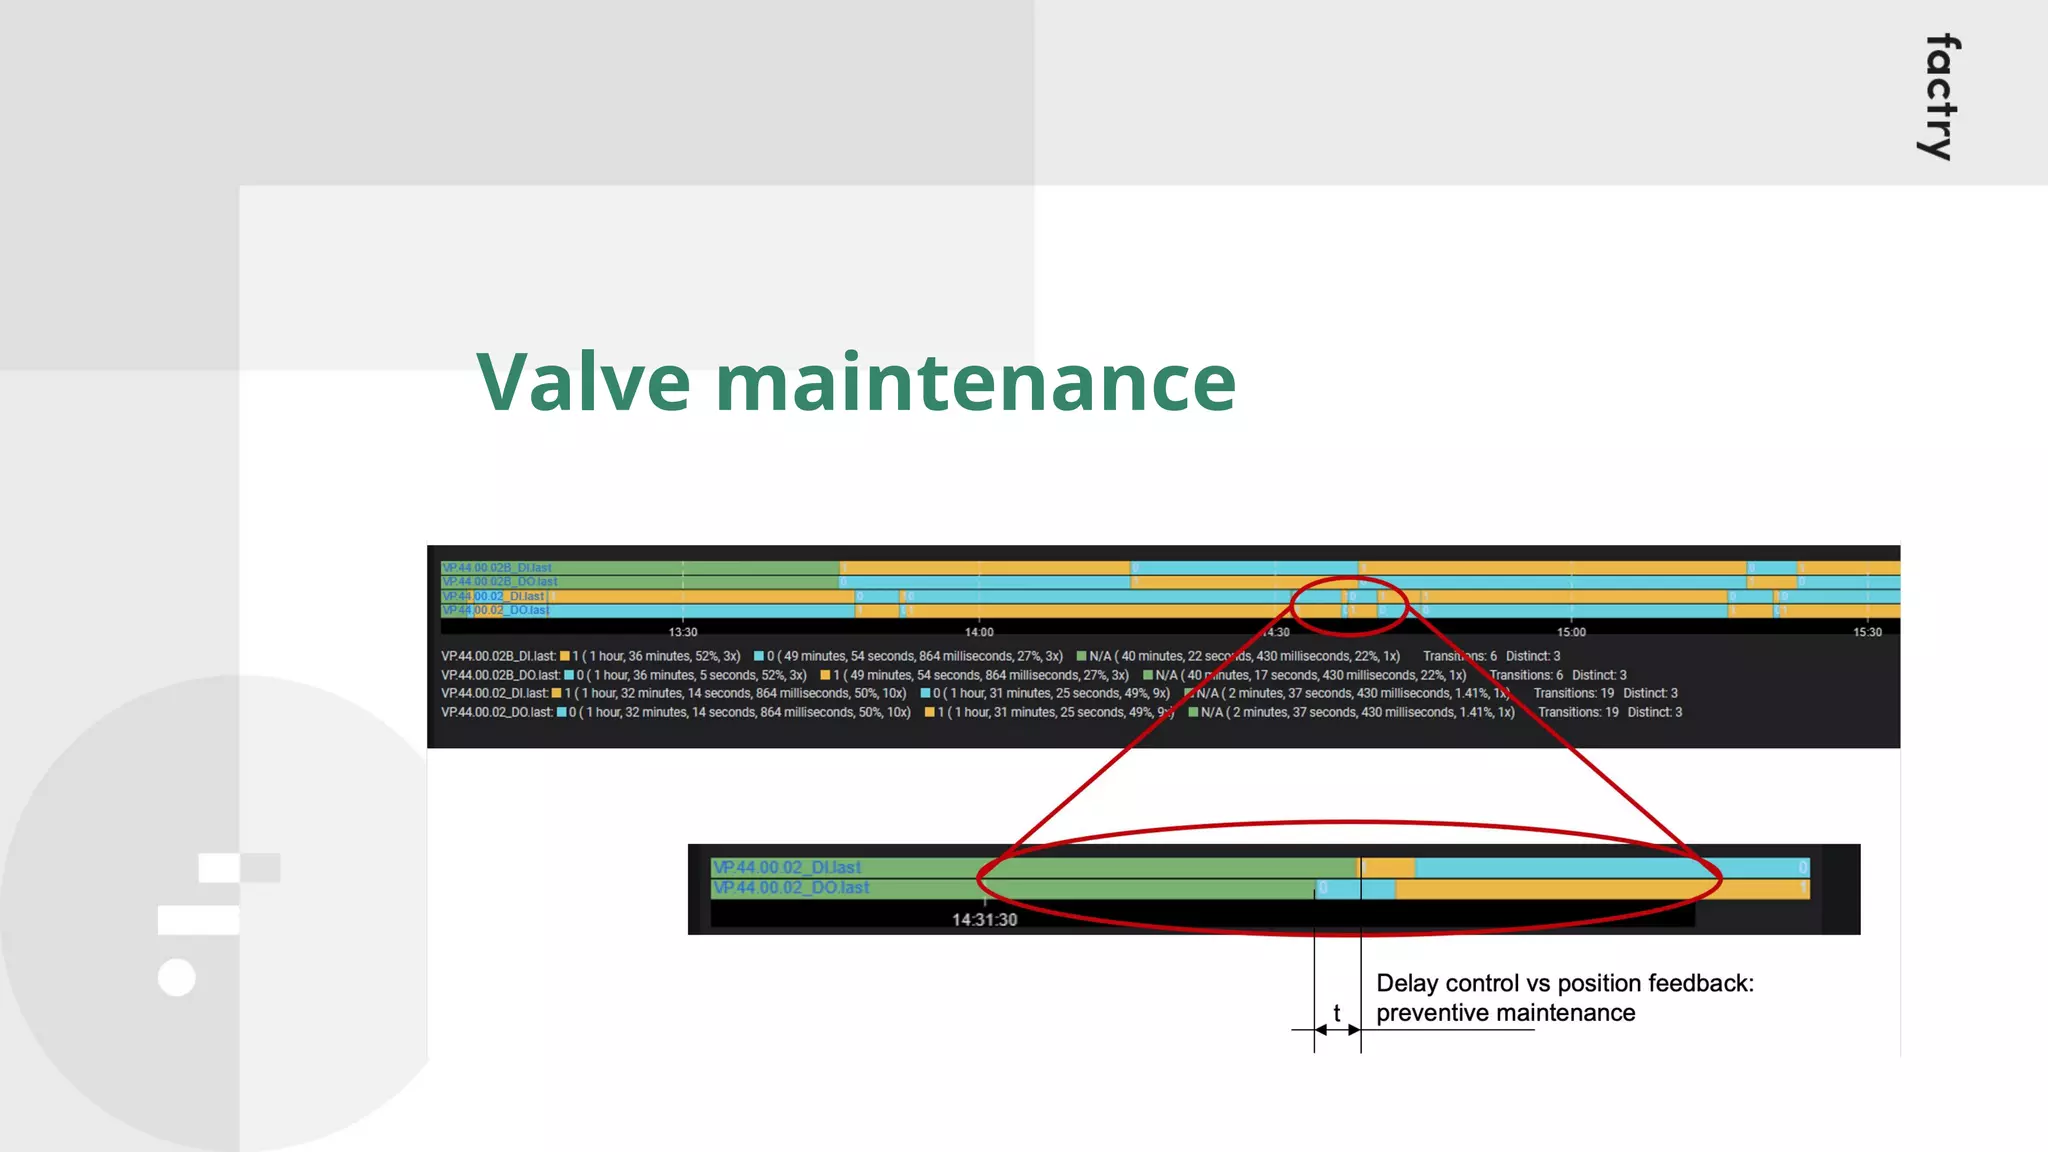
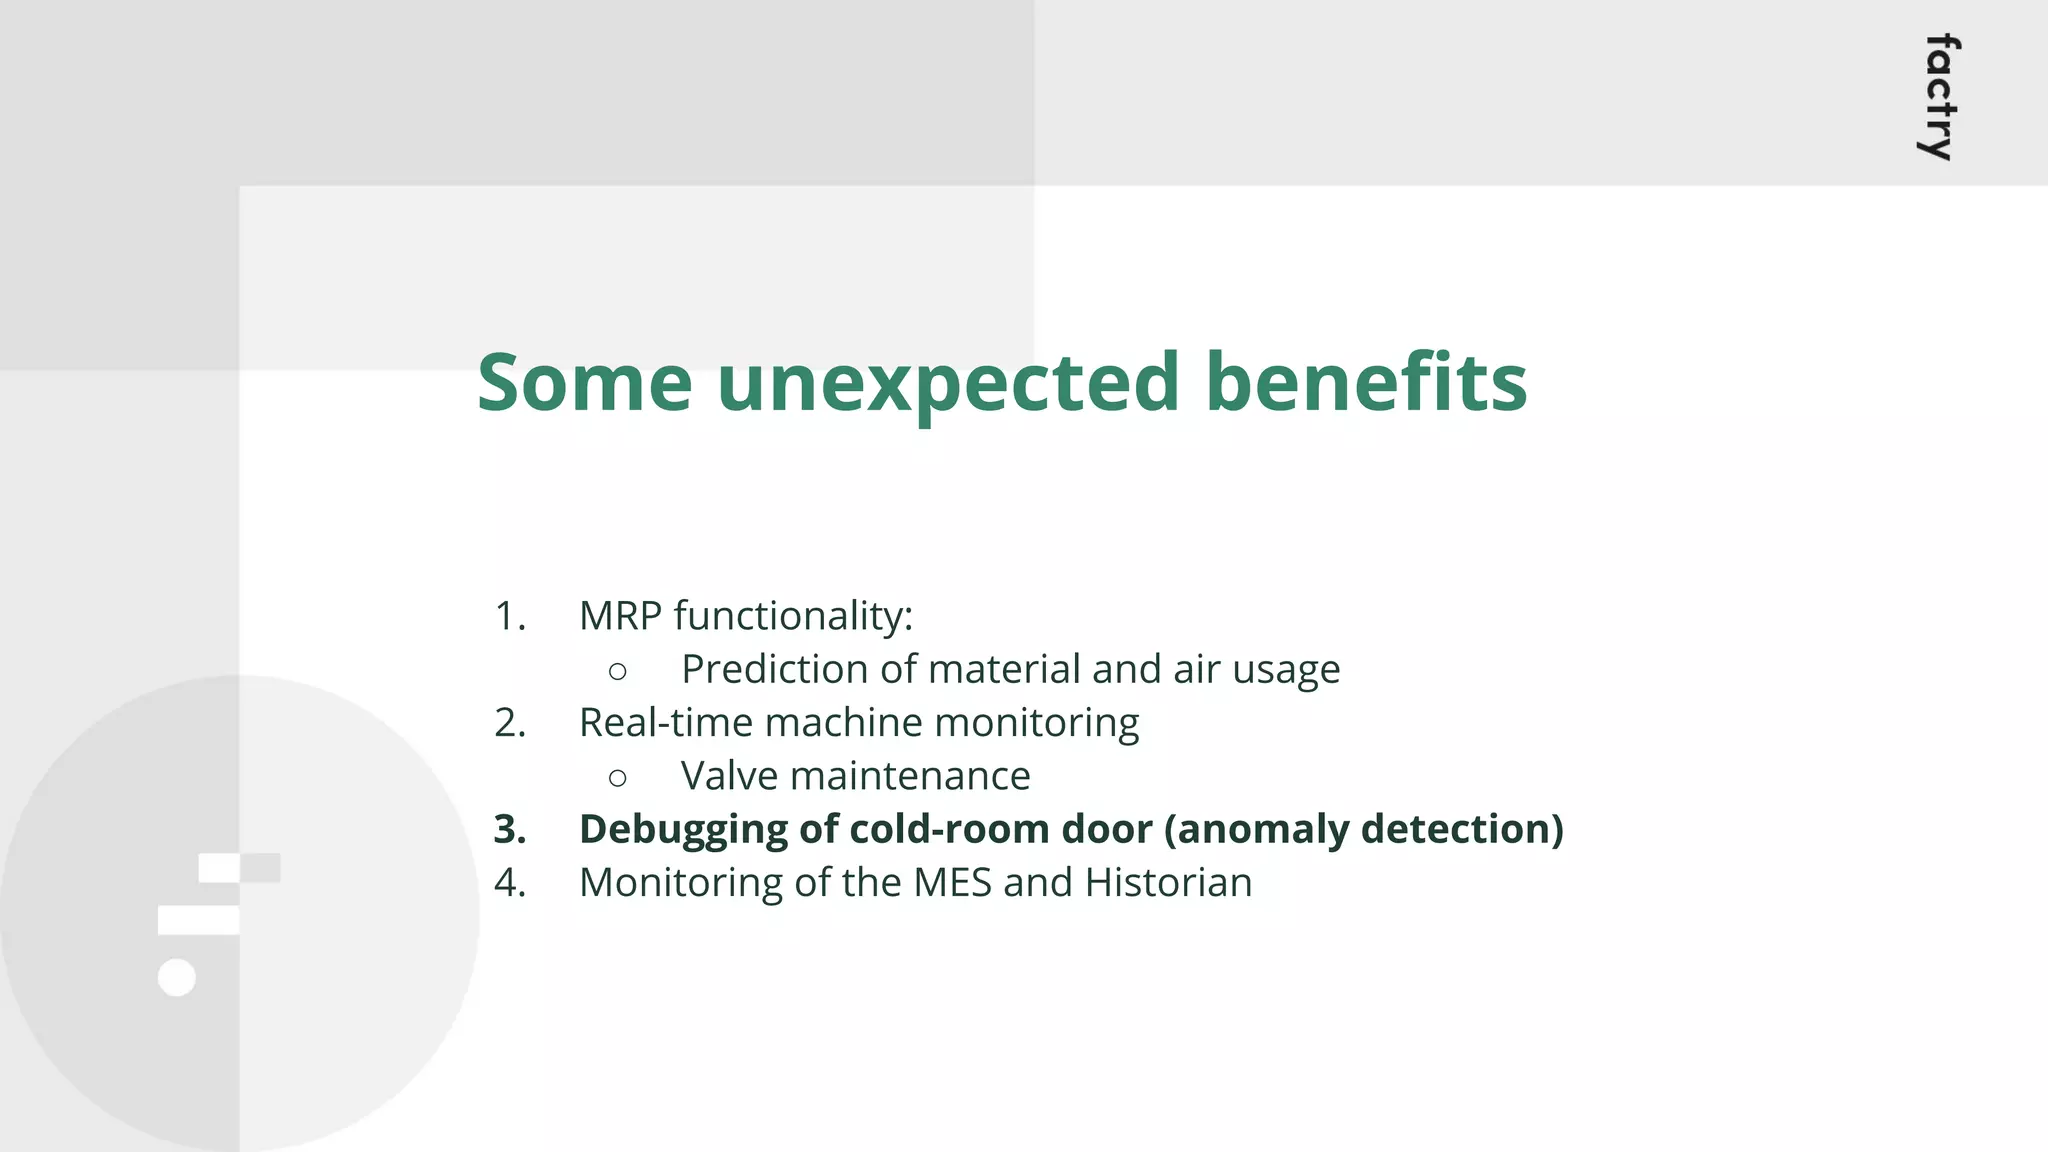
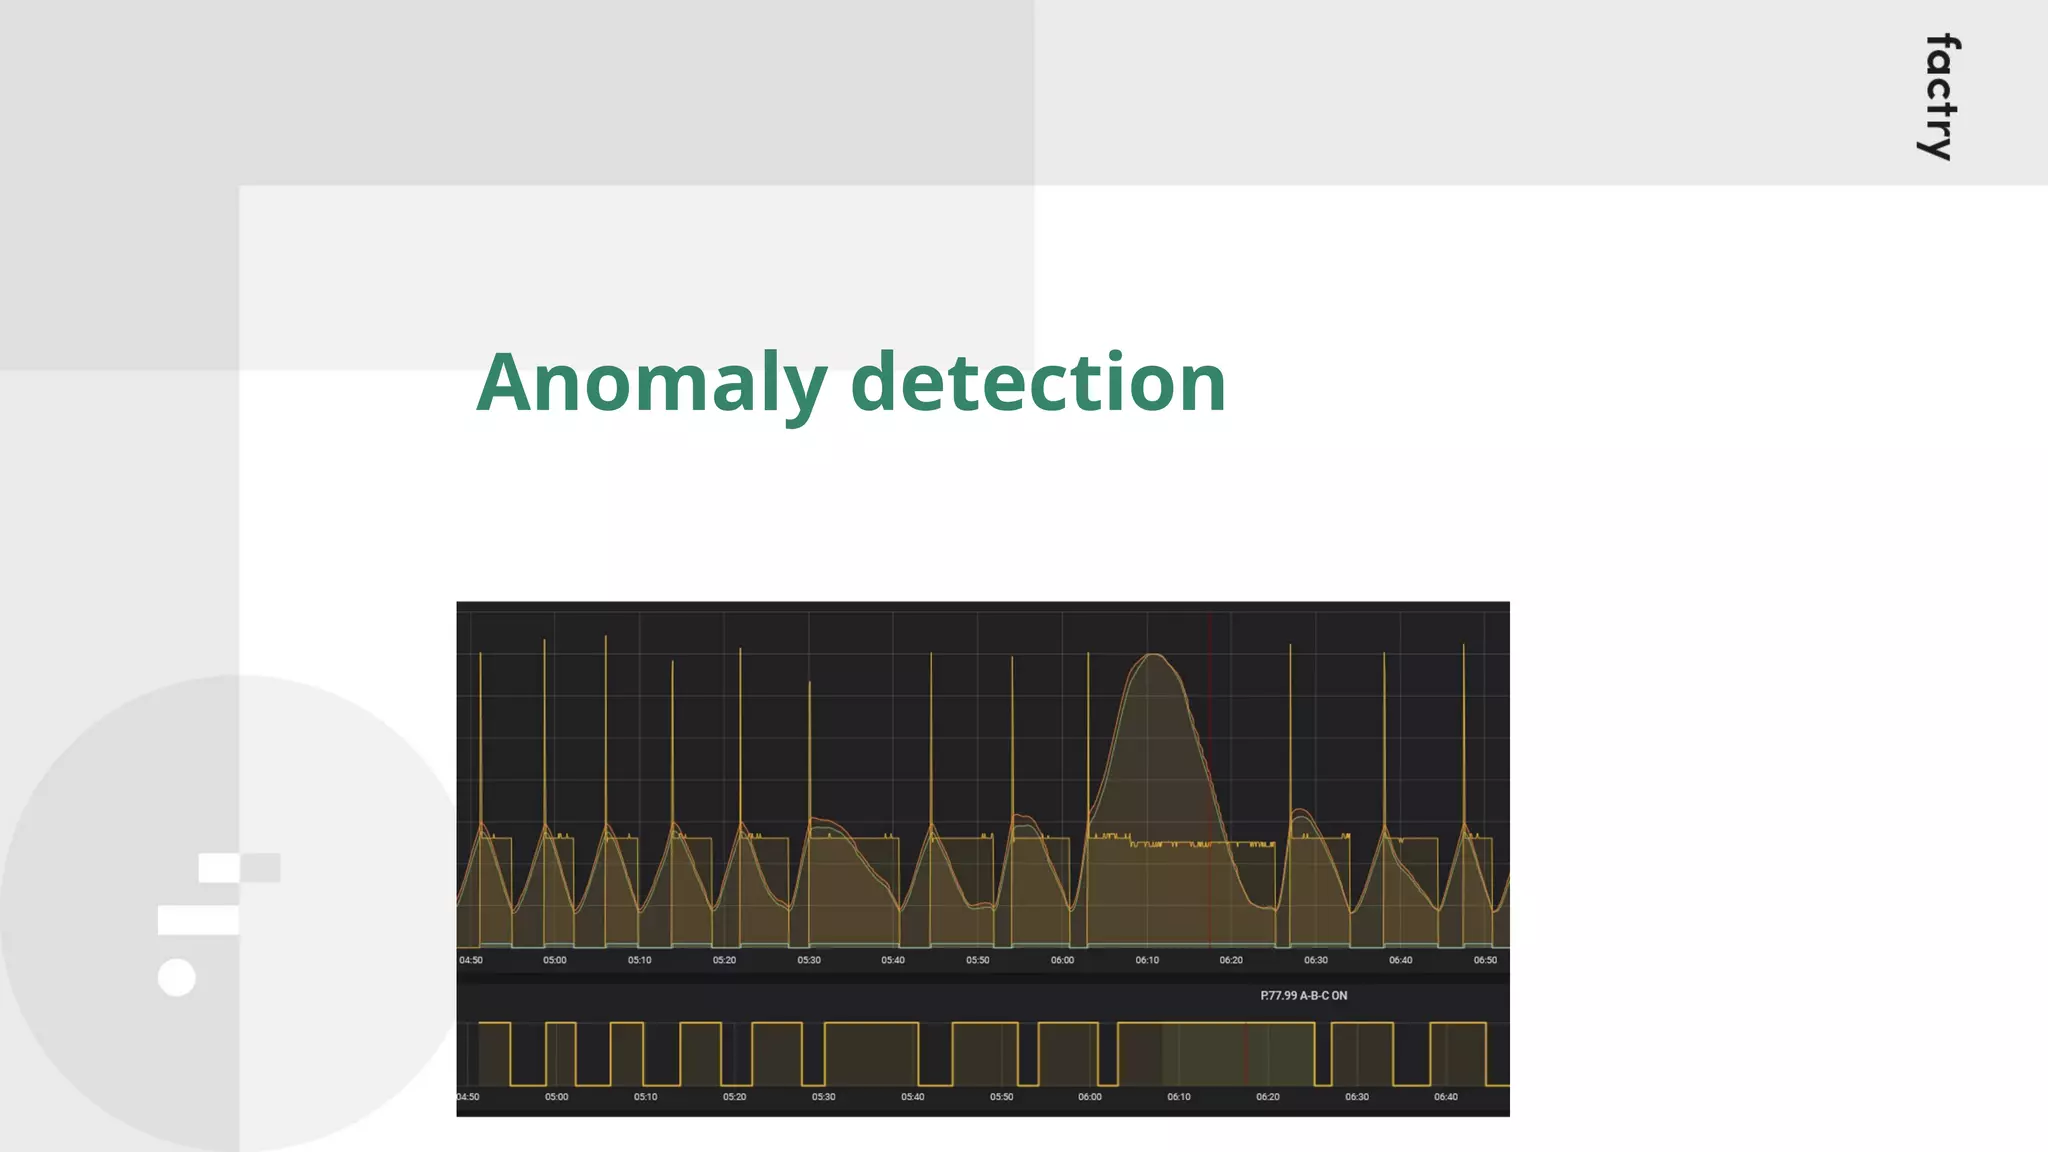
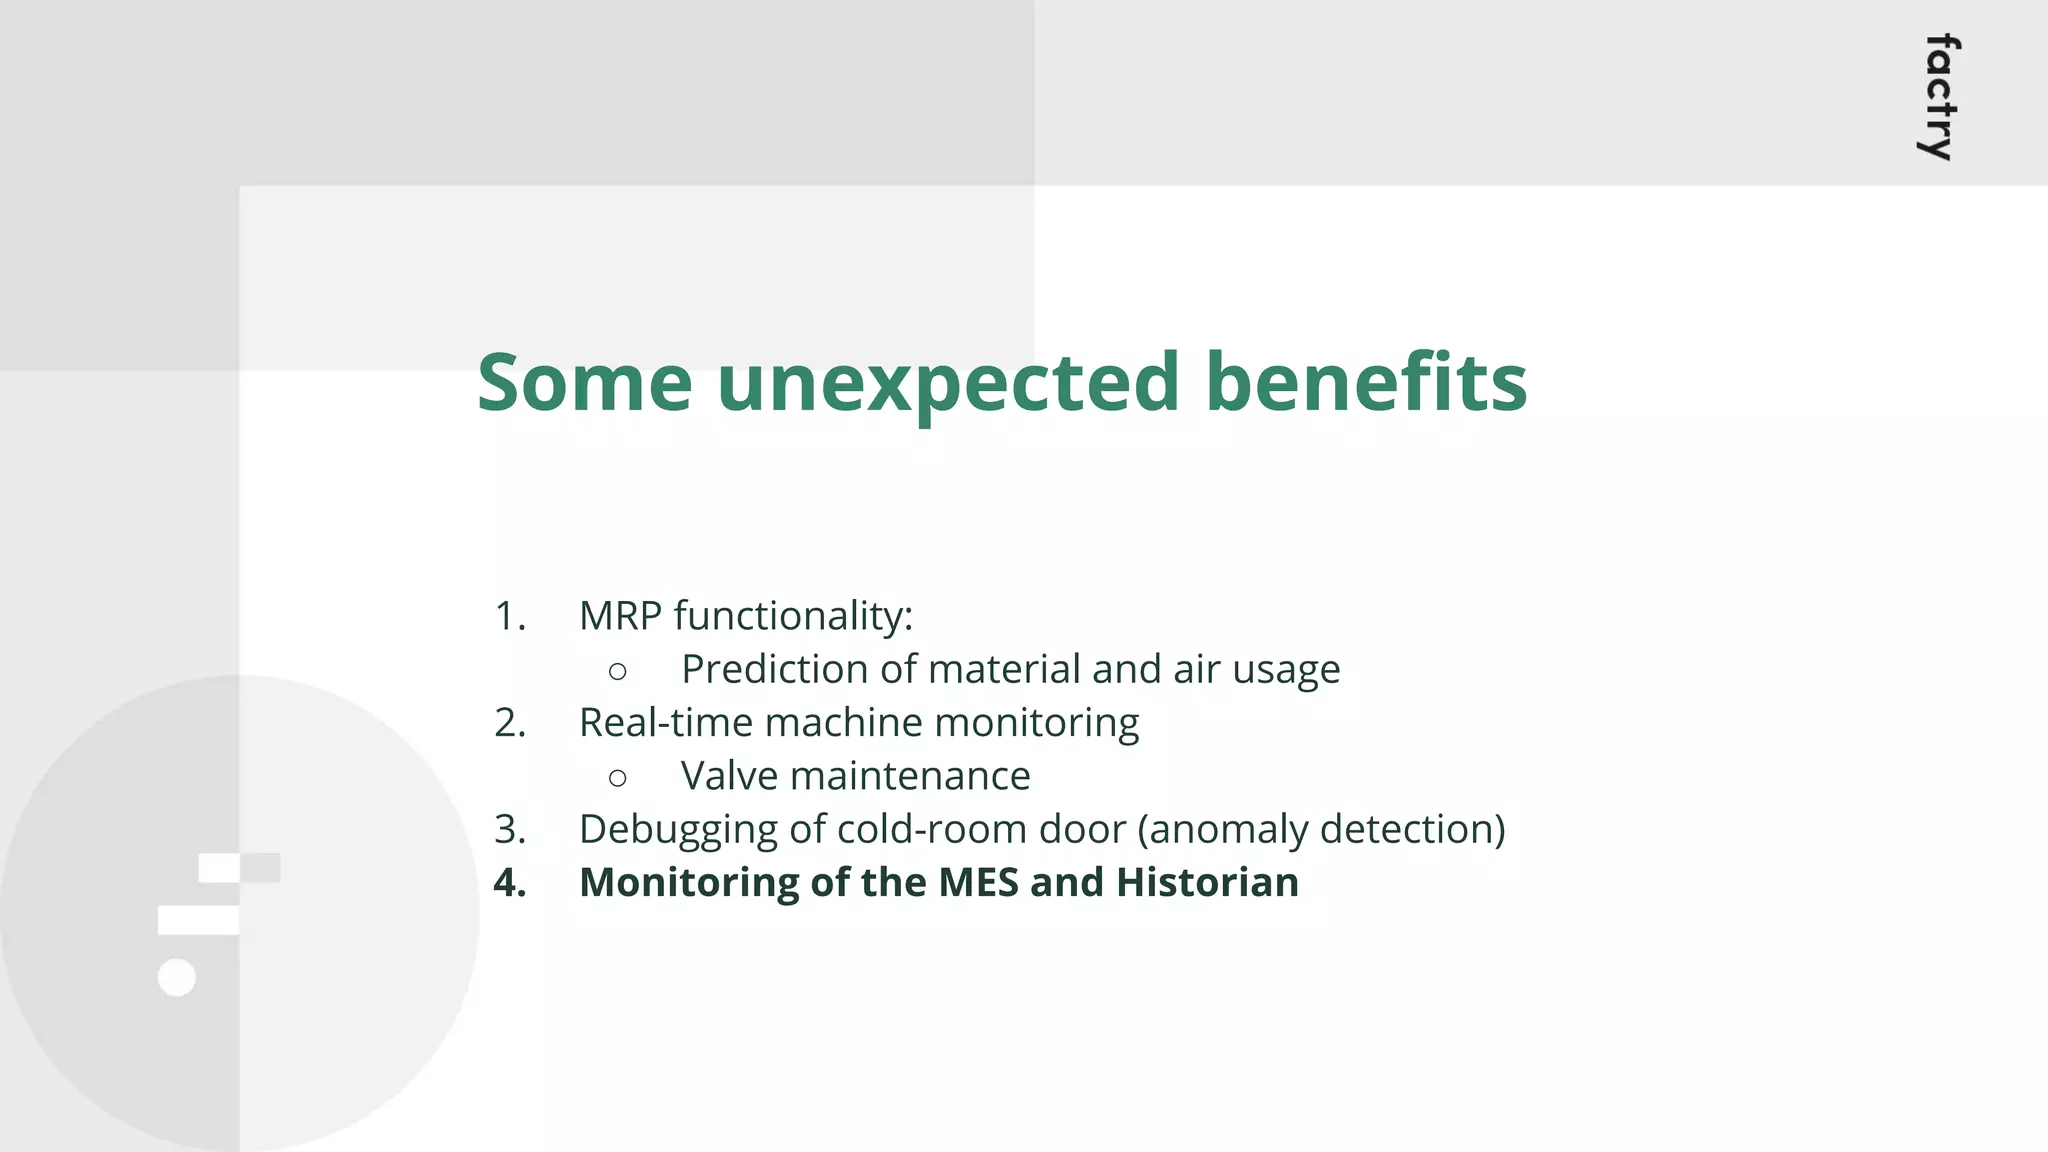
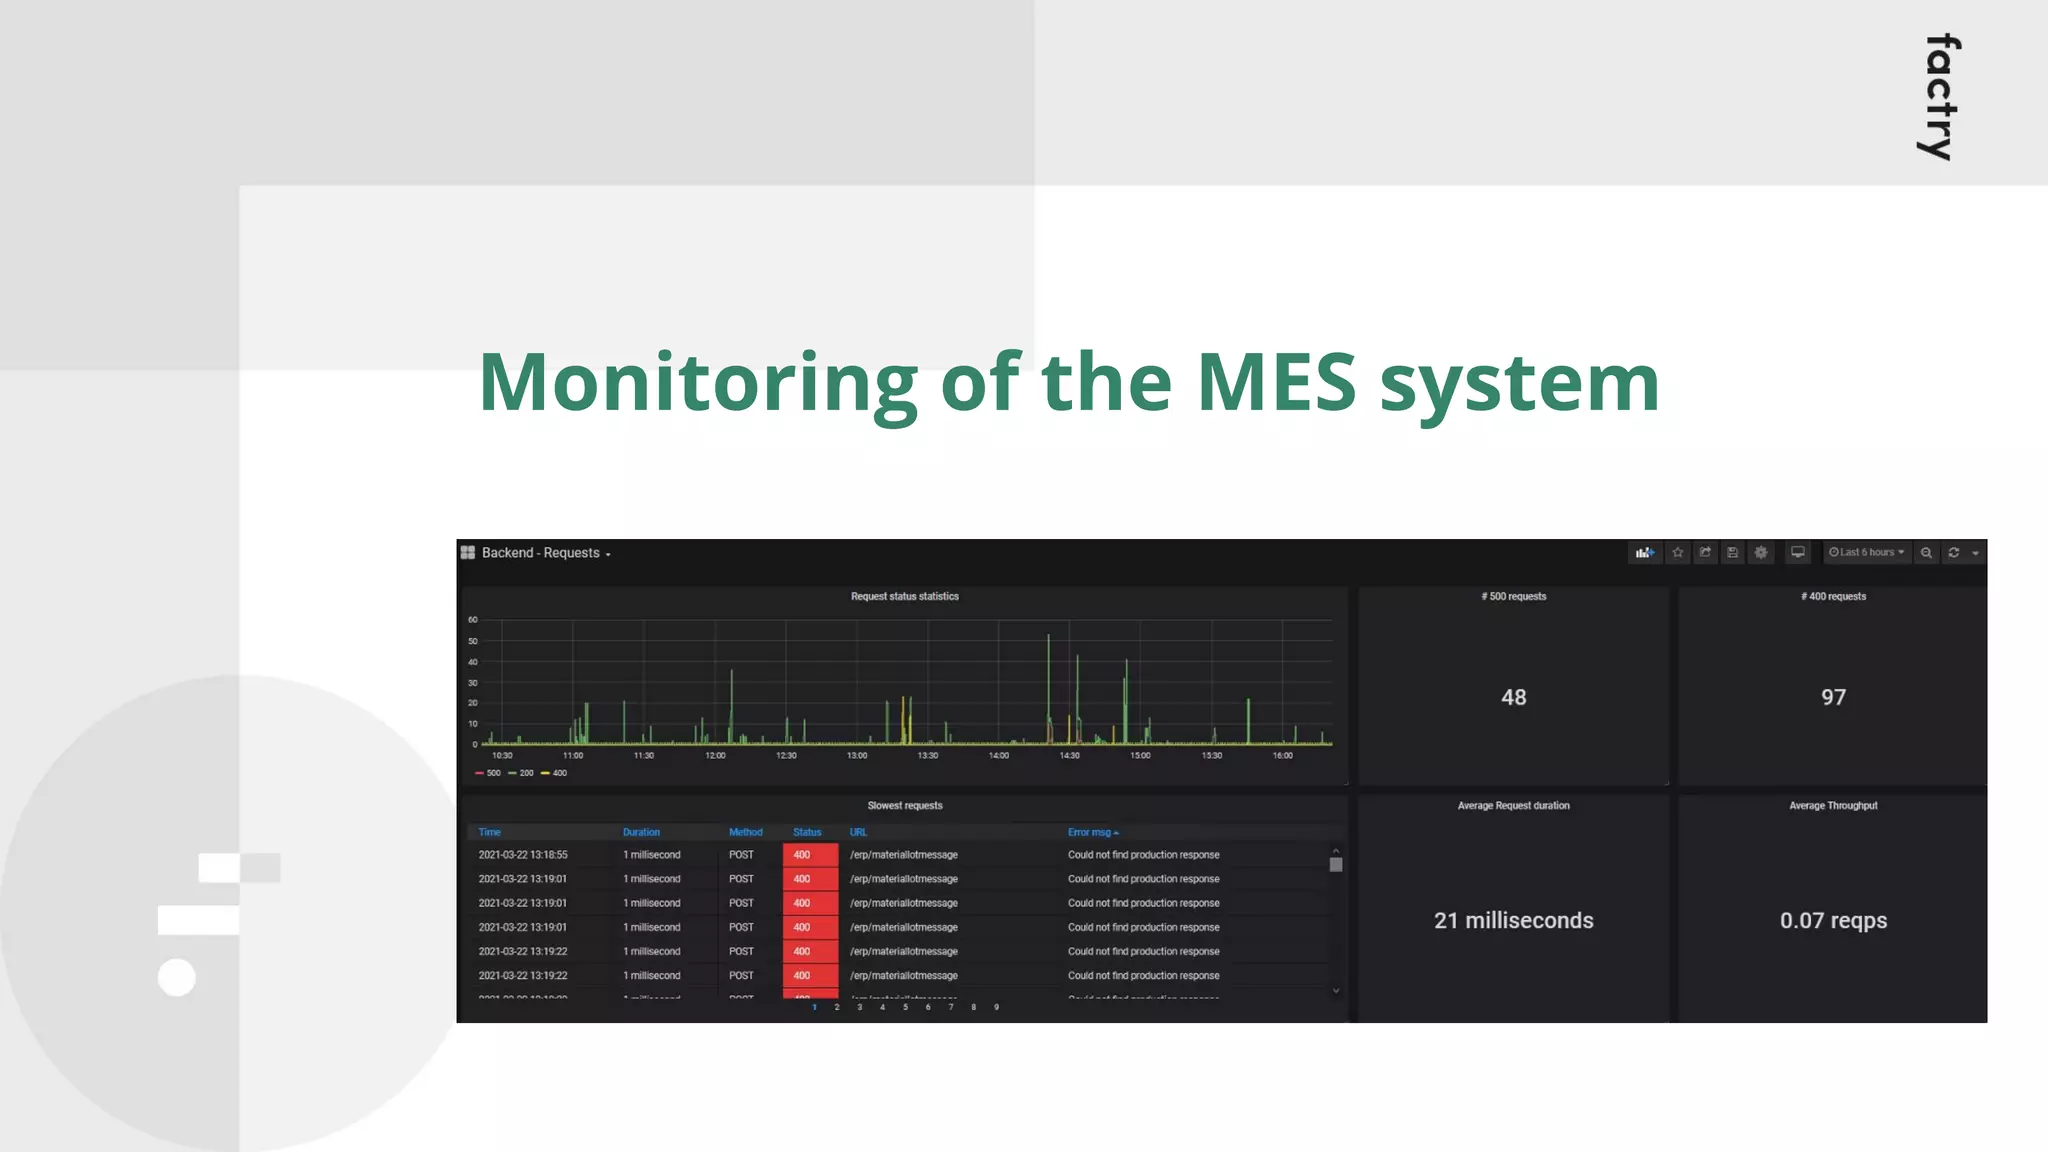
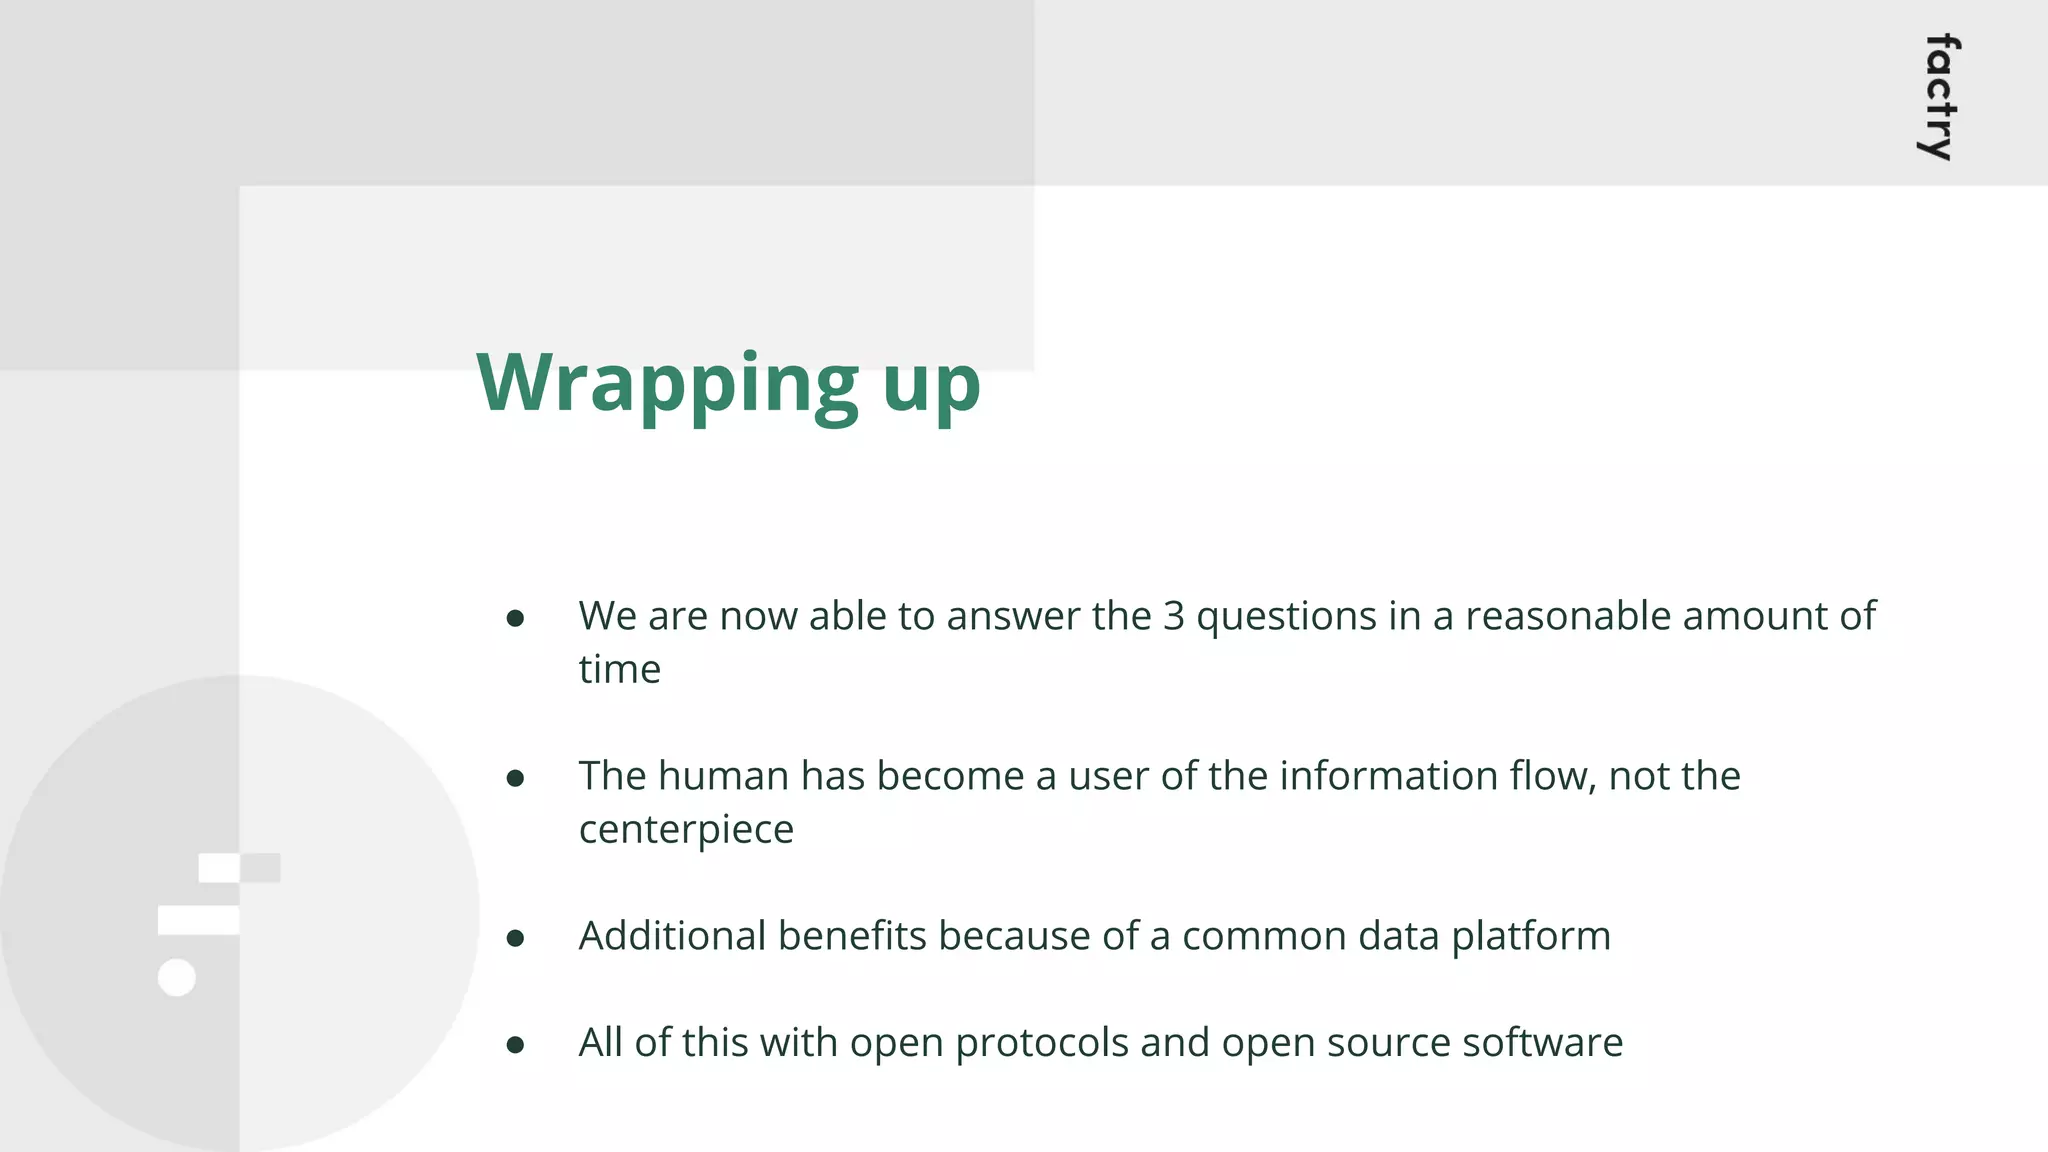
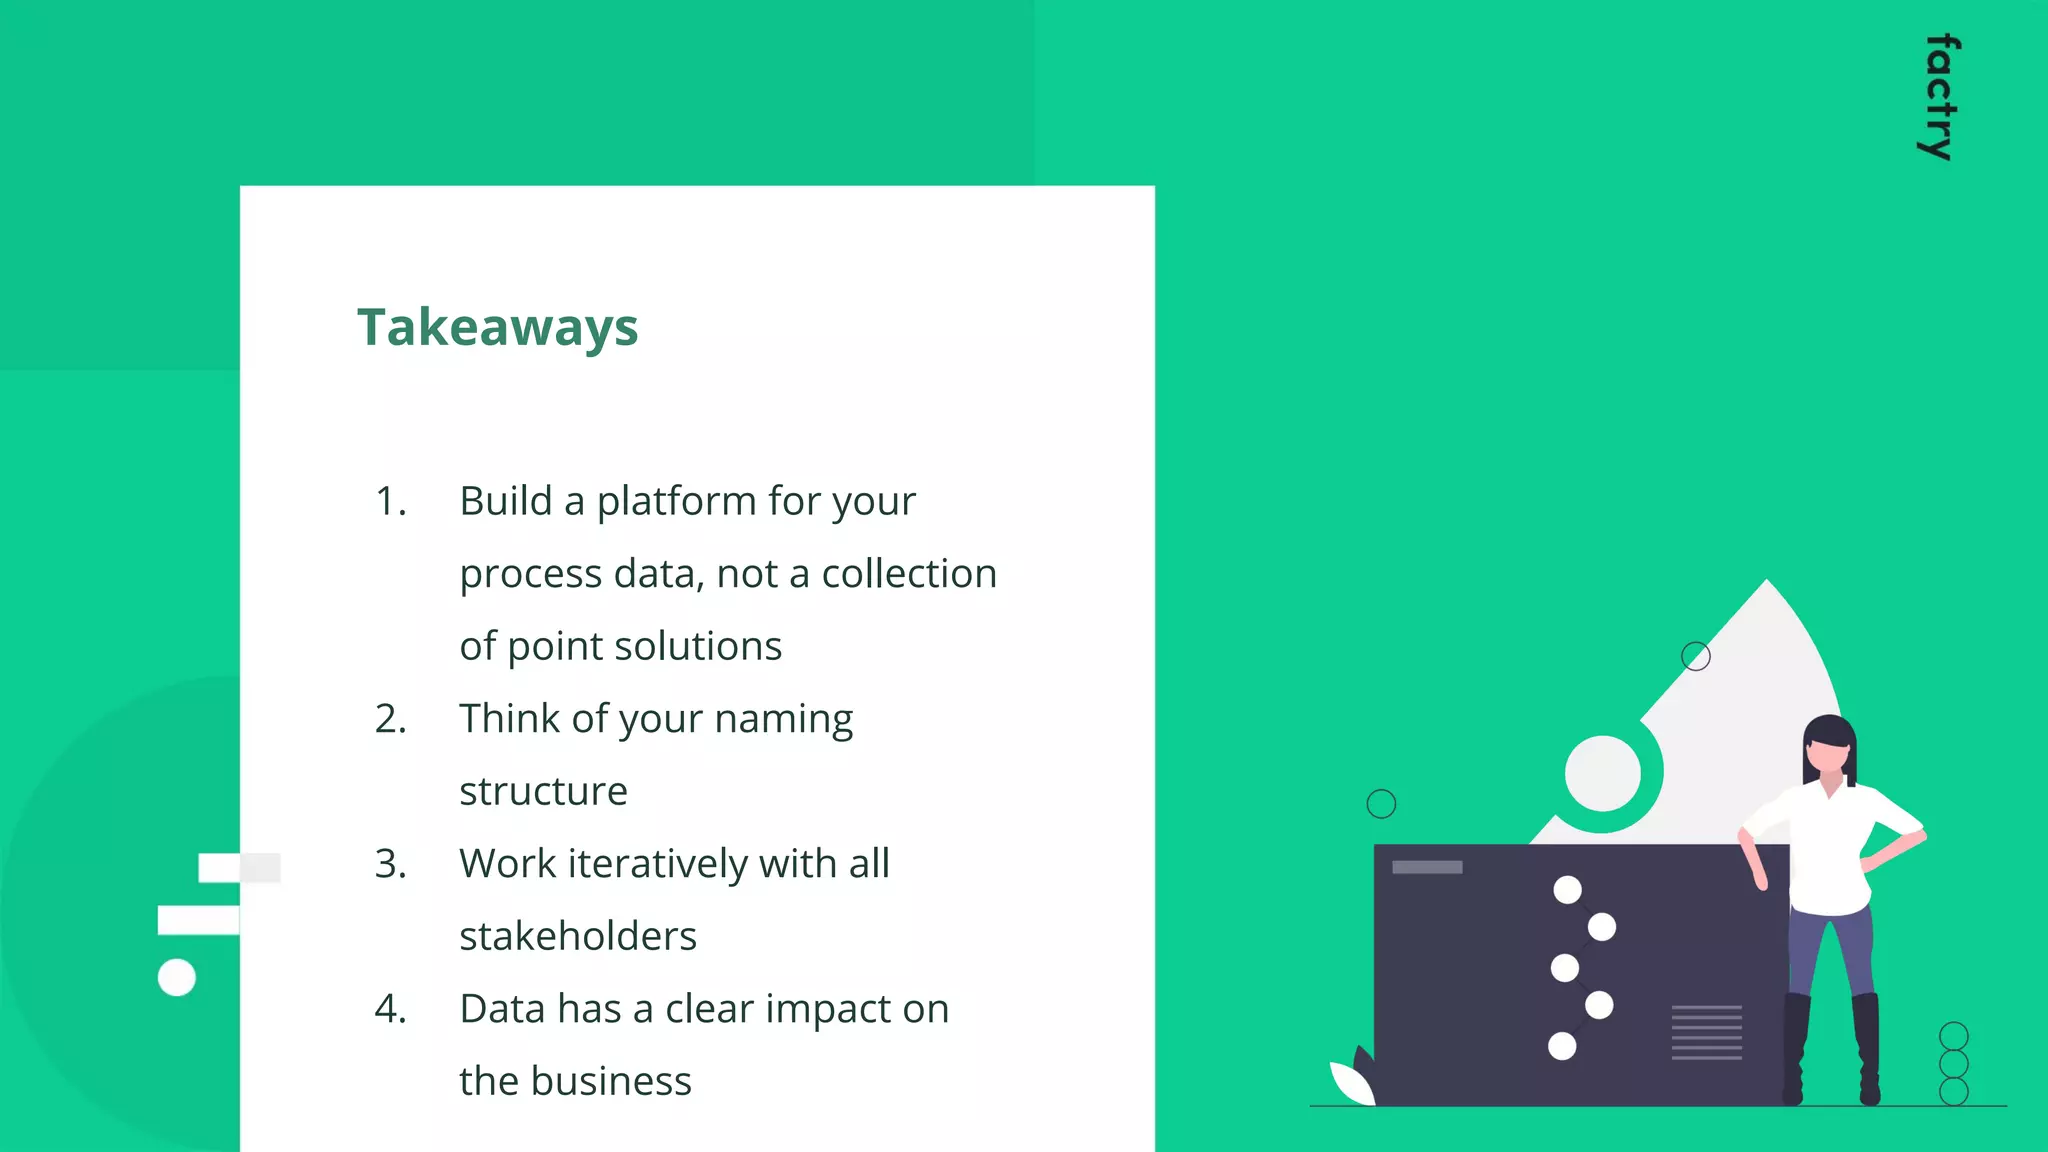

The document discusses a webinar hosted by Factry on improving operational intelligence through data integration, specifically using OPC-UA to collect IIOT time series data from PLC and SCADA systems. It highlights the challenges faced by Algist Bruggeman in managing fermentation data, the solutions implemented to streamline data collection and analysis, and the unexpected benefits achieved since integrating these systems. Key takeaways include the importance of creating a cohesive data platform and the positive impact of proper data management on business operations.


![[ODSC EUROPE 2022] Eagleeye - Data Pipeline for Anomaly Detection in Cyber Se...](https://cdn.slidesharecdn.com/ss_thumbnails/odsceurope2022eagleeye-datapipelineforanomalydetectionincybersecurity-250320161155-77fa6dd8-thumbnail.jpg?width=640&height=640&fit=bounds)


![Ward Bowman [PTC] | ThingWorx Long-Term Data Storage with InfluxDB | InfluxDa...](https://cdn.slidesharecdn.com/ss_thumbnails/influxdays-221027185325-5d2f430b-thumbnail.jpg?width=640&height=640&fit=bounds)
![Scott Anderson [InfluxData] | New & Upcoming Flux Features | InfluxDays 2022](https://cdn.slidesharecdn.com/ss_thumbnails/influxdays2022-fluxupdates-scott-221021210238-9d323cba-thumbnail.jpg?width=640&height=640&fit=bounds)
![Steinkamp, Clifford [InfluxData] | Closing Thoughts | InfluxDays 2022](https://cdn.slidesharecdn.com/ss_thumbnails/influxdays2022closingthoughtsday2-221020220104-abde55ea-thumbnail.jpg?width=640&height=640&fit=bounds)
![Steinkamp, Clifford [InfluxData] | Welcome to InfluxDays 2022 - Day 2 | Influ...](https://cdn.slidesharecdn.com/ss_thumbnails/influxdays2022welcometoday2-221020215815-c8463942-thumbnail.jpg?width=640&height=640&fit=bounds)
![Steinkamp, Clifford [InfluxData] | Closing Thoughts Day 1 | InfluxDays 2022](https://cdn.slidesharecdn.com/ss_thumbnails/influxdays2022closingthoughtsday1-221020215301-f8040e1f-thumbnail.jpg?width=640&height=640&fit=bounds)


![Coded Agents – with UiPath SDK + LangGraph [Virtual Hands-on Workshop]](https://cdn.slidesharecdn.com/ss_thumbnails/codedagentsdeck-251215155422-5497c599-thumbnail.jpg?width=640&height=640&fit=bounds)


