Download as PDF, PPTX


![References
[ITA] Product ownership e misurazione del valore del
prodotto
http://bit.ly/ABD19POUX
Quantitative versus Qualitativa Usability Testing
https://www.nngroup.com/articles/quant-vs-qual/
[BOOK] Observing the User Experience (2012)
https://www.amazon.it/Observing-User-Experience-
Practitioners-Research/dp/0123848695
Thank you! 👋](https://image.slidesharecdn.com/intersectionartangiblehowtomeasuretheproductvalue-191002155710/75/Measuring-the-user-experience-and-the-product-value-35-2048.jpg)

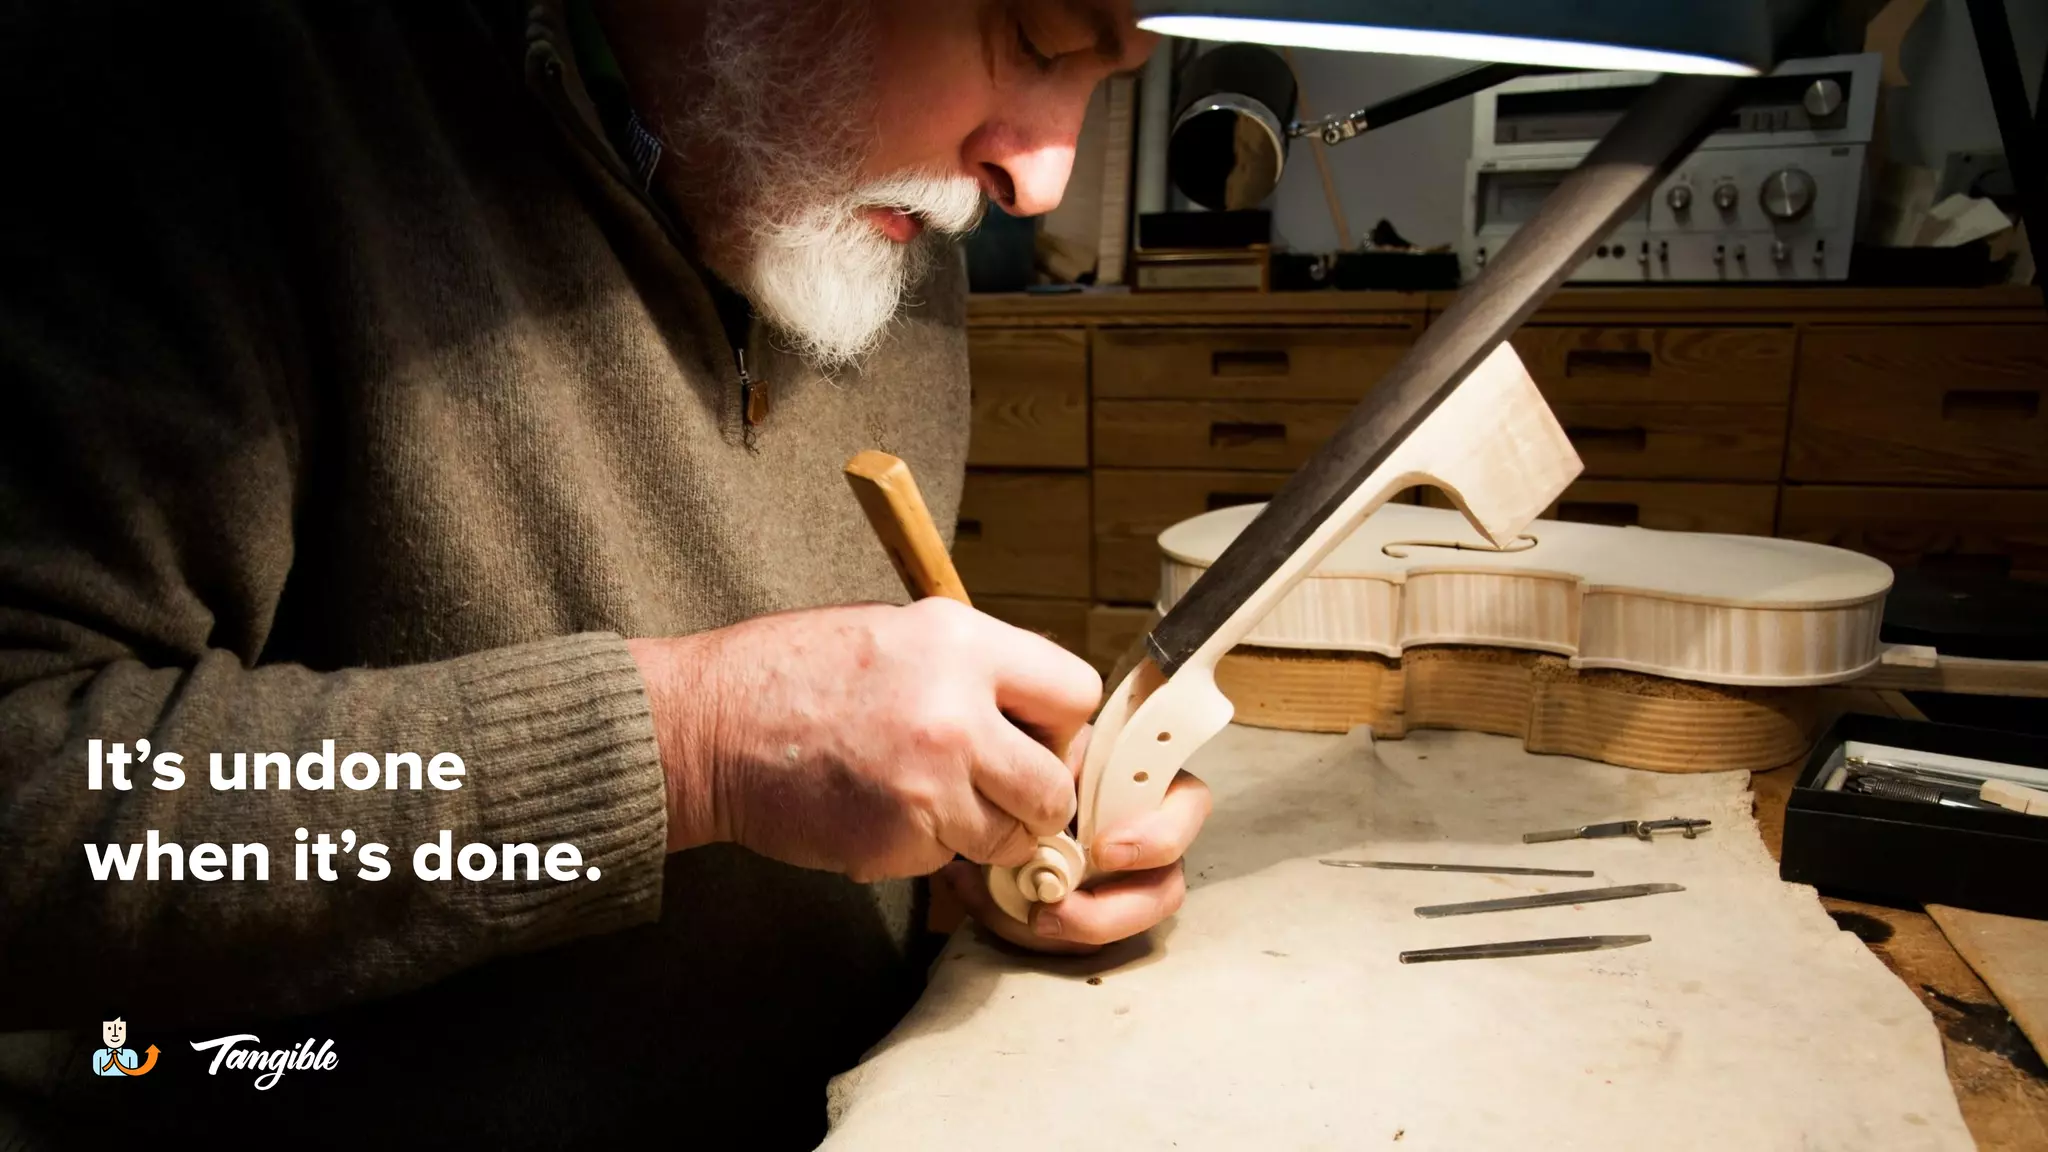
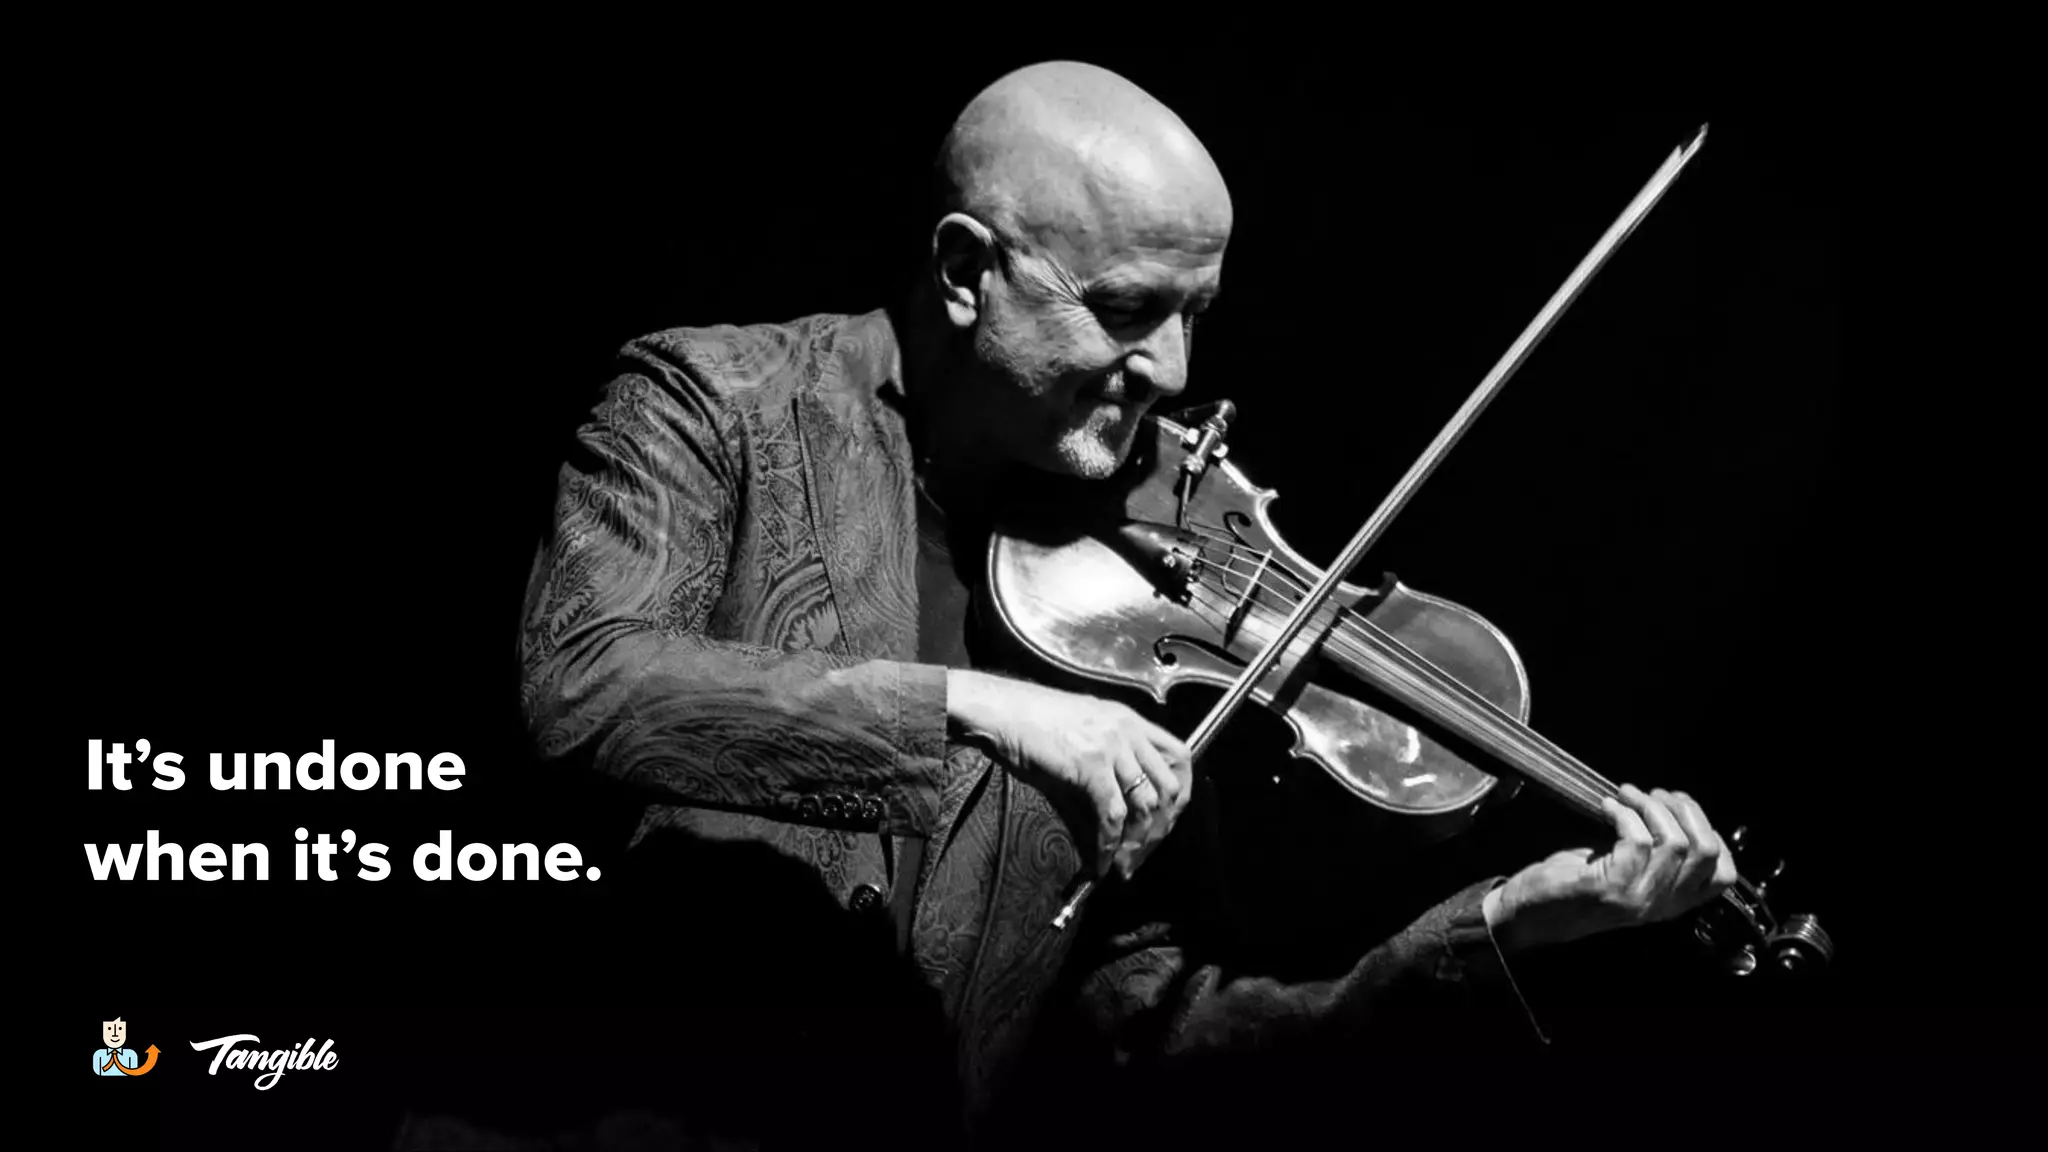
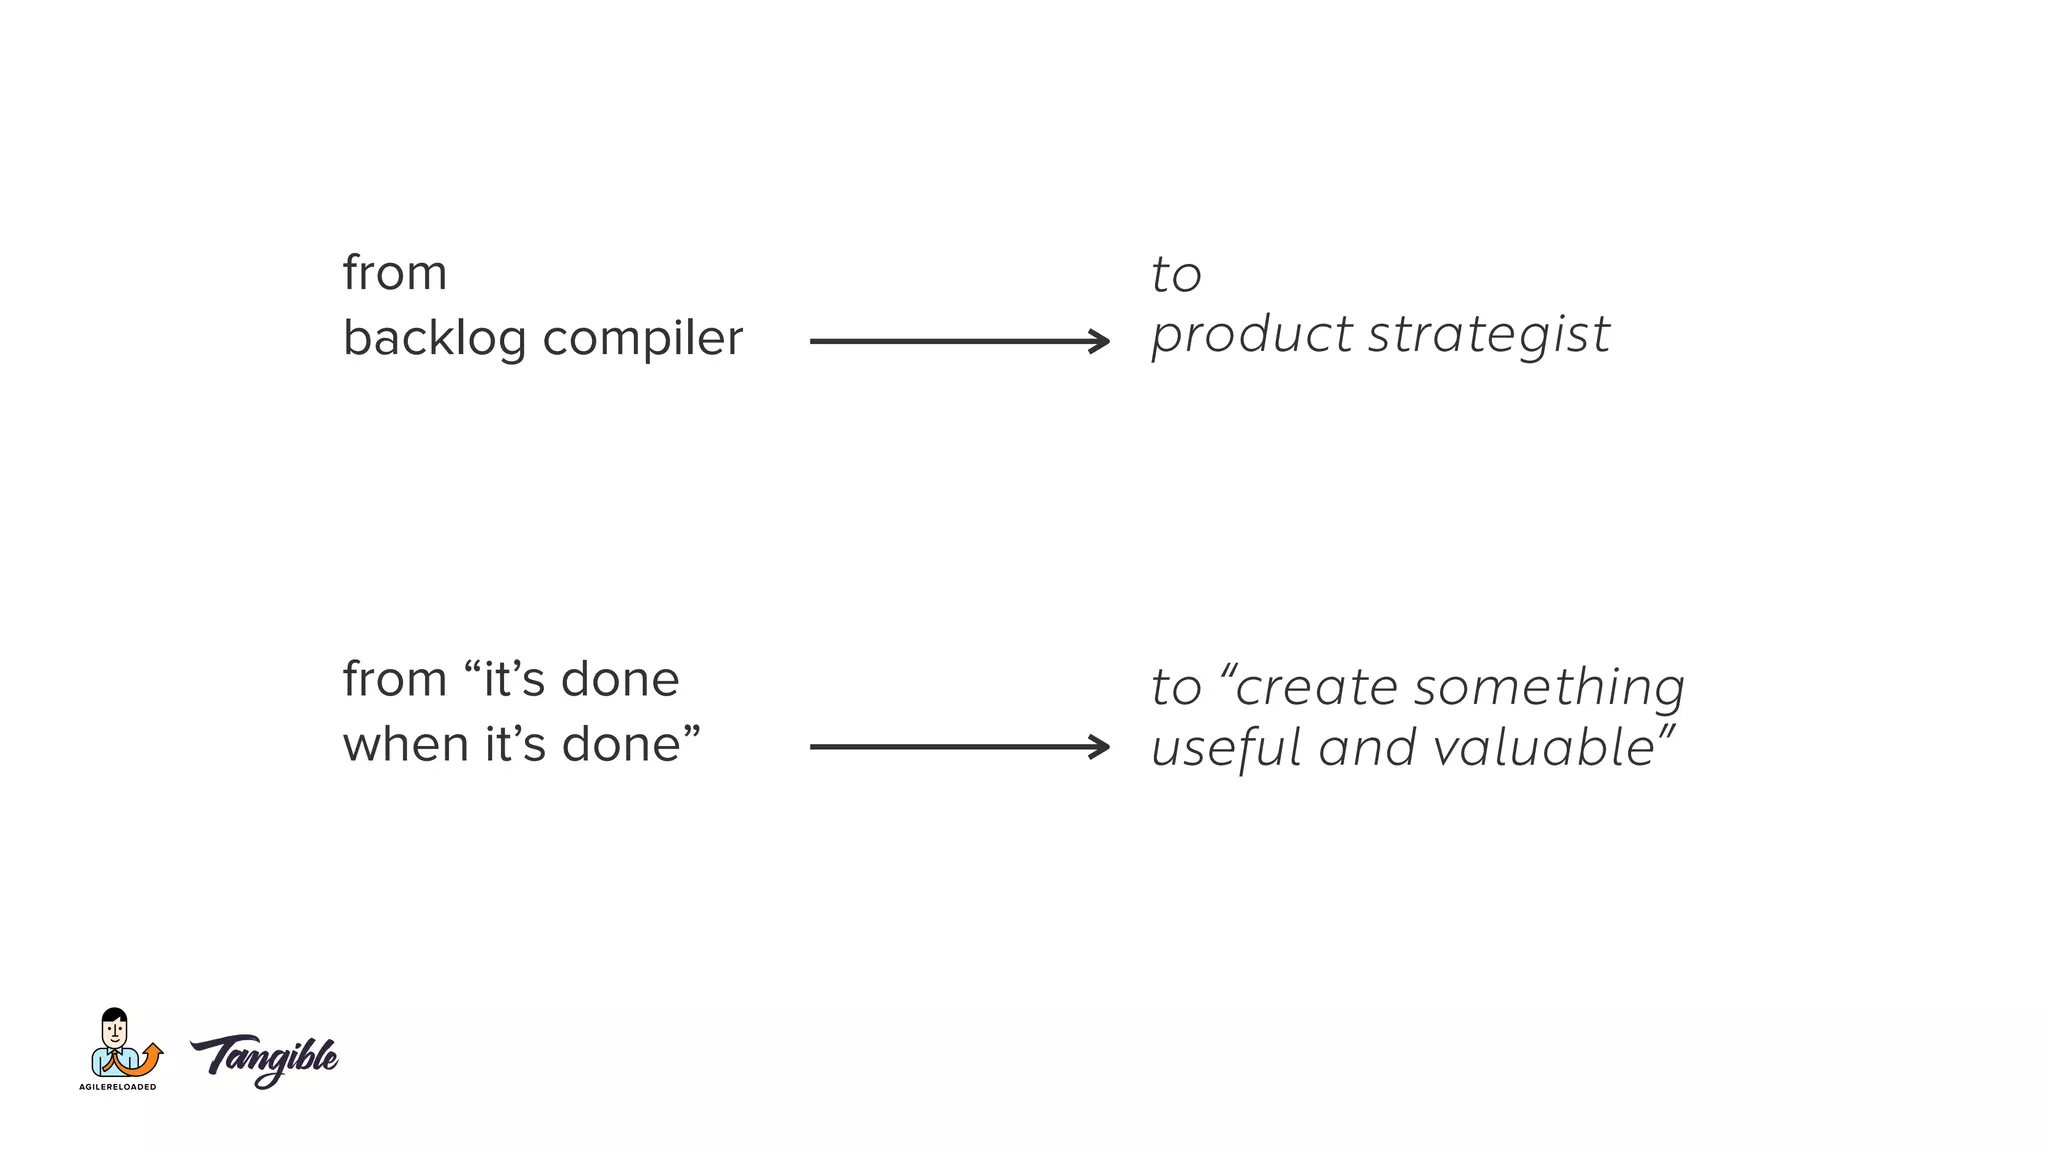
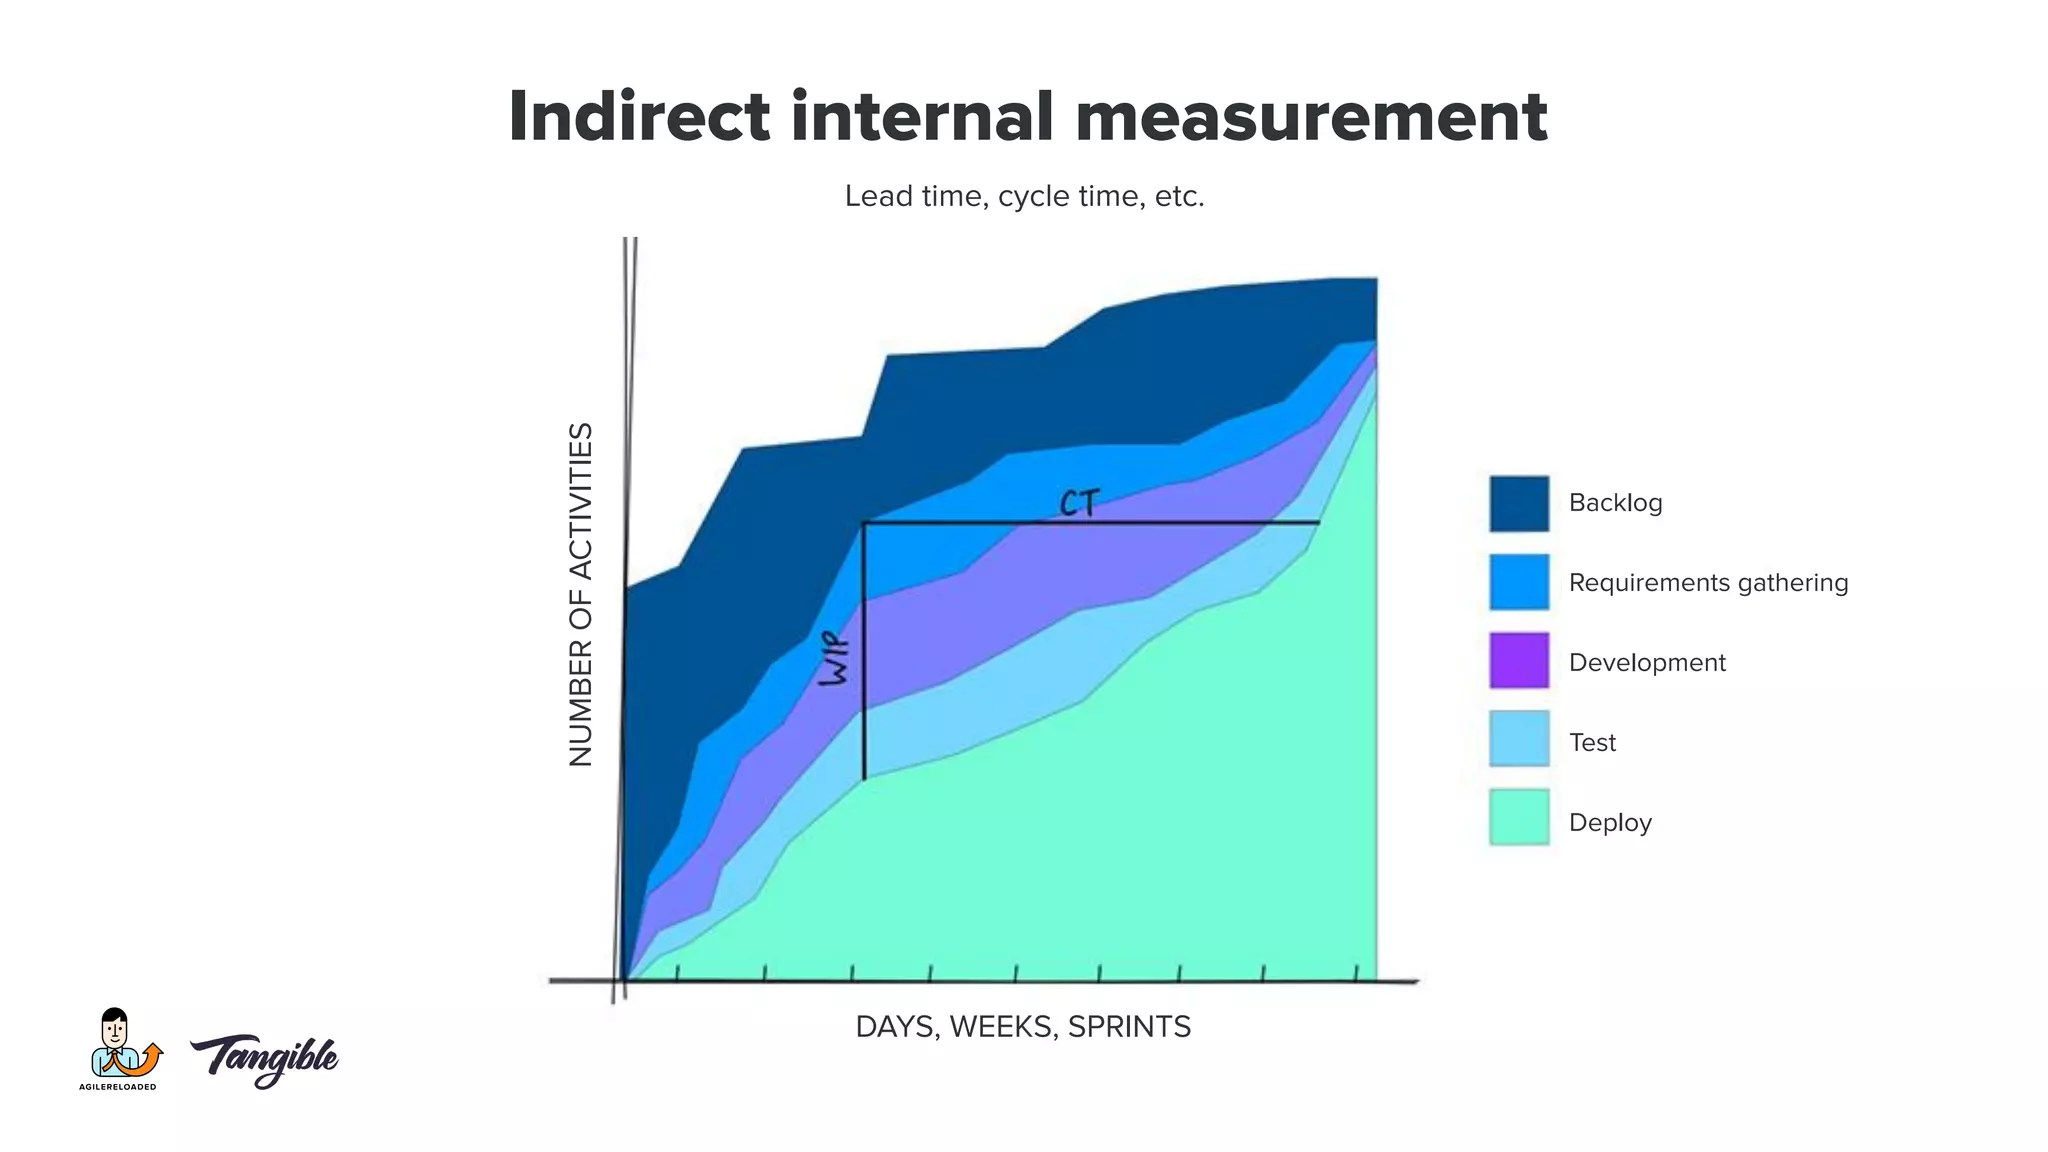
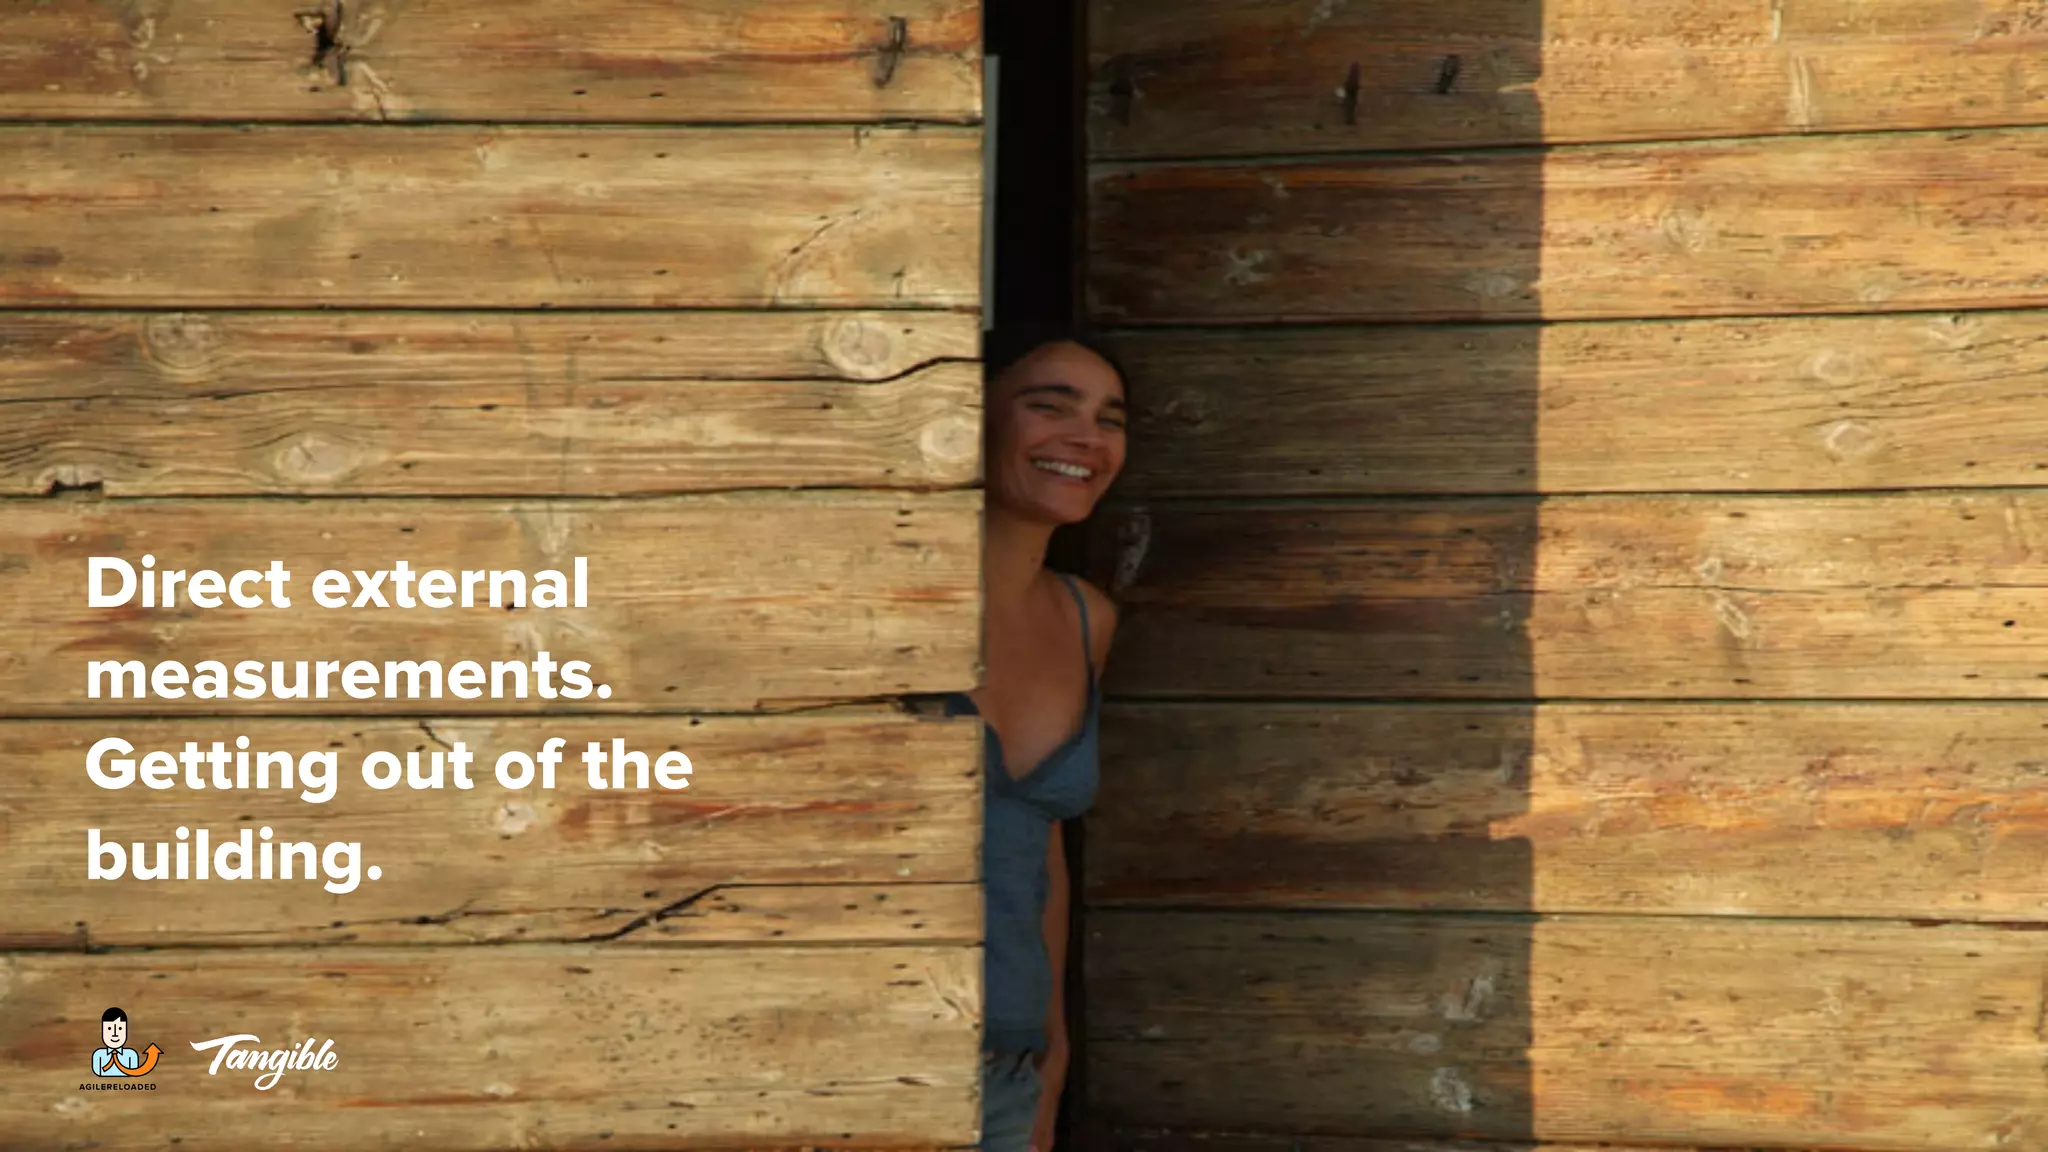
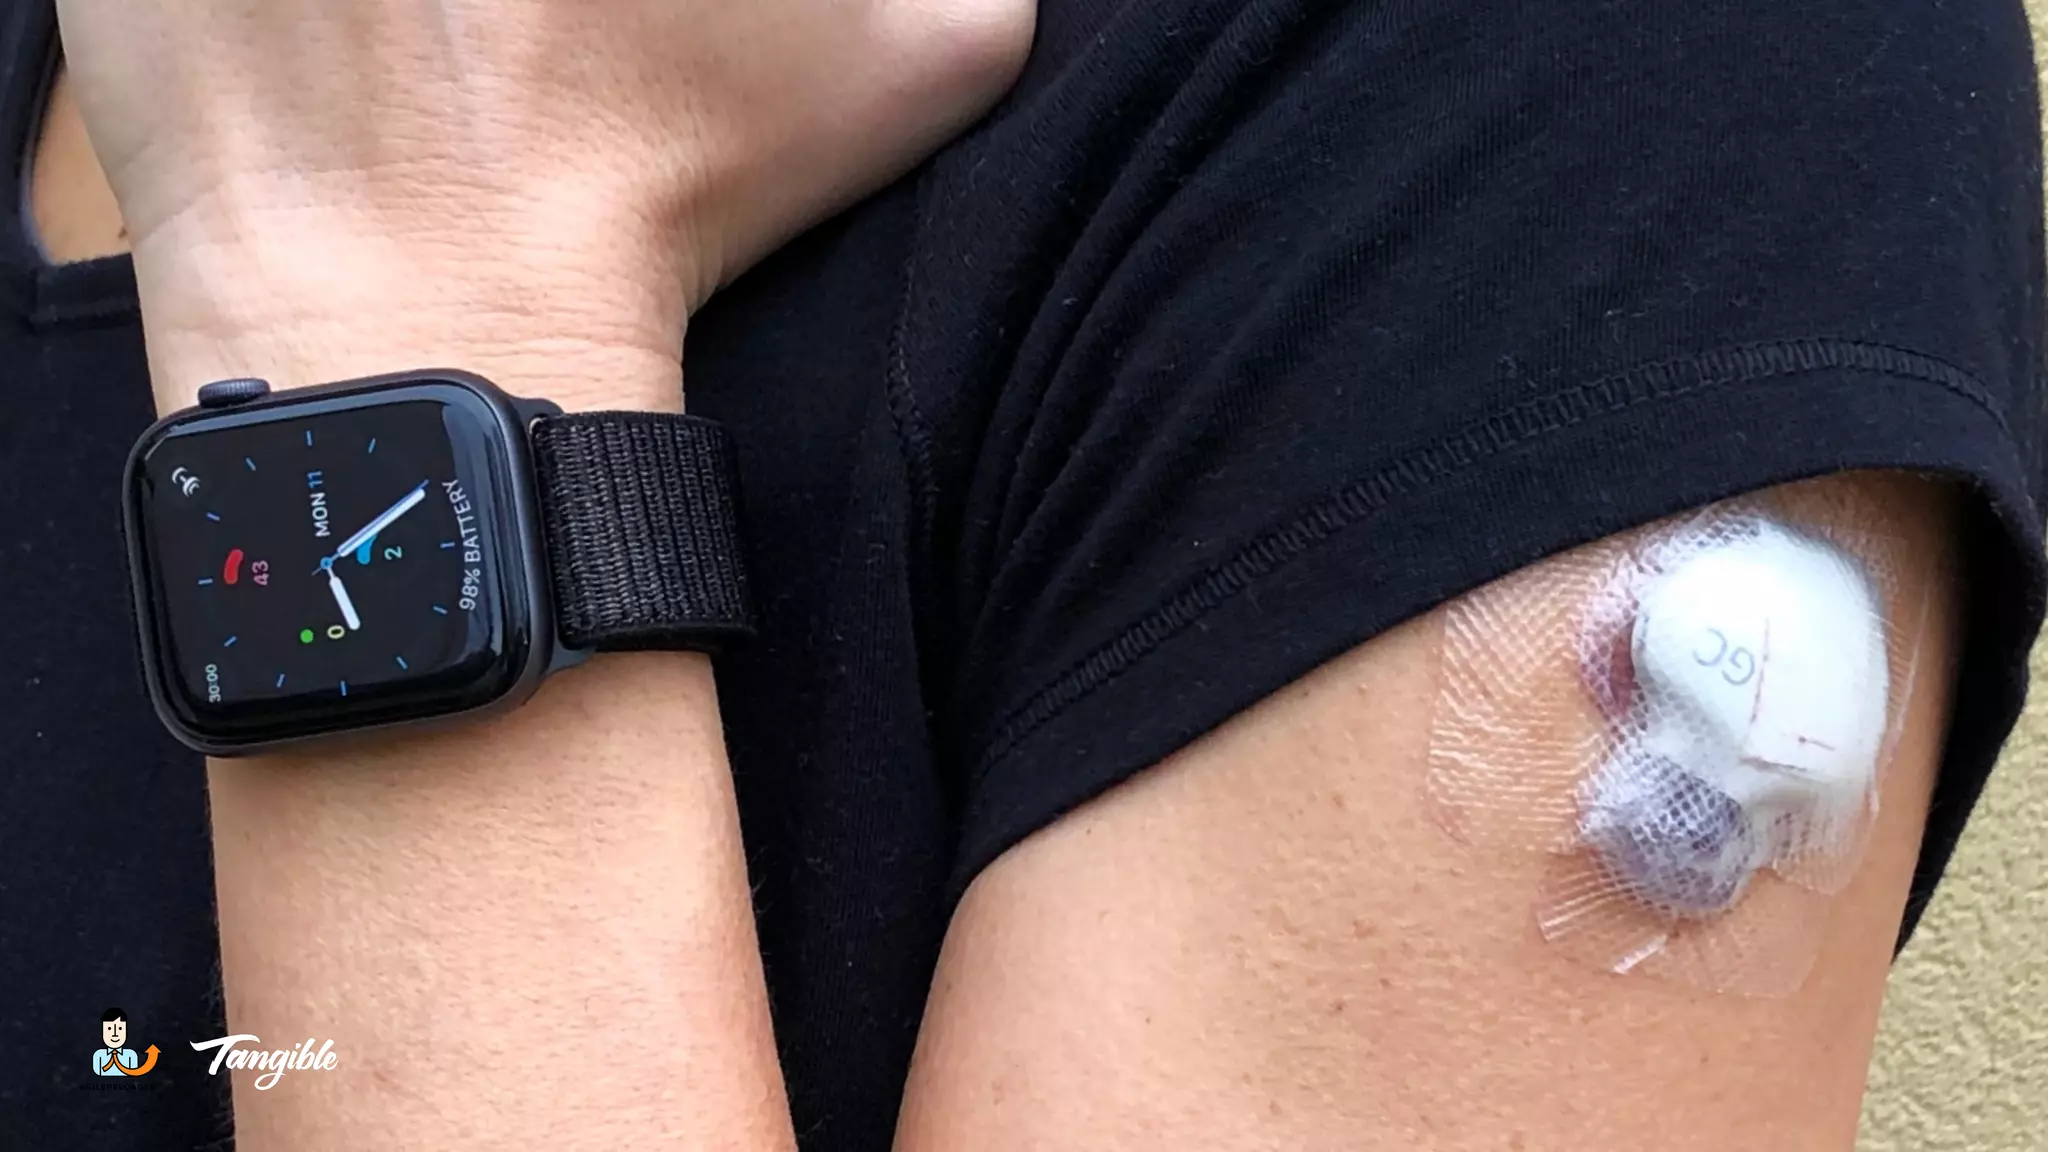
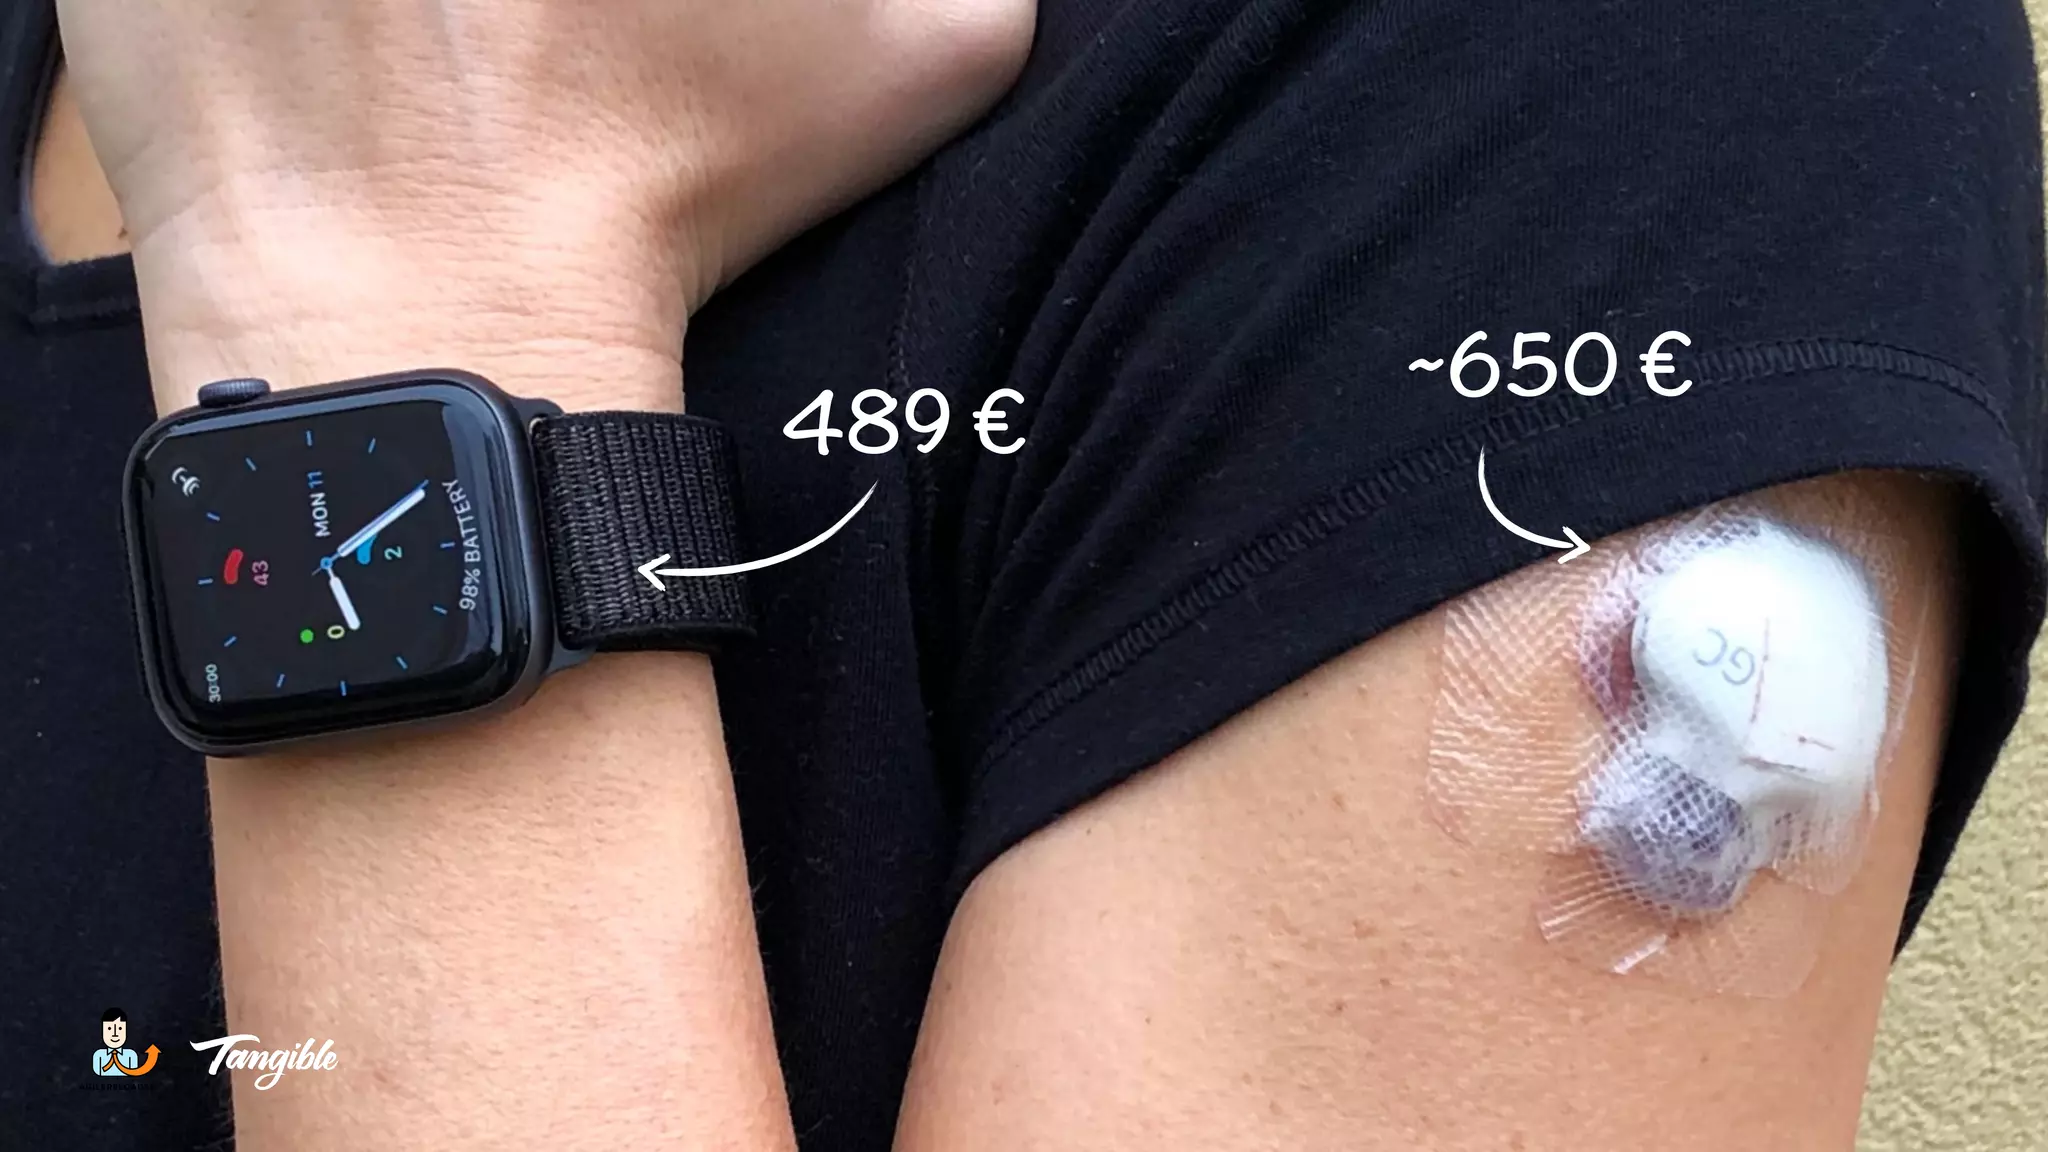
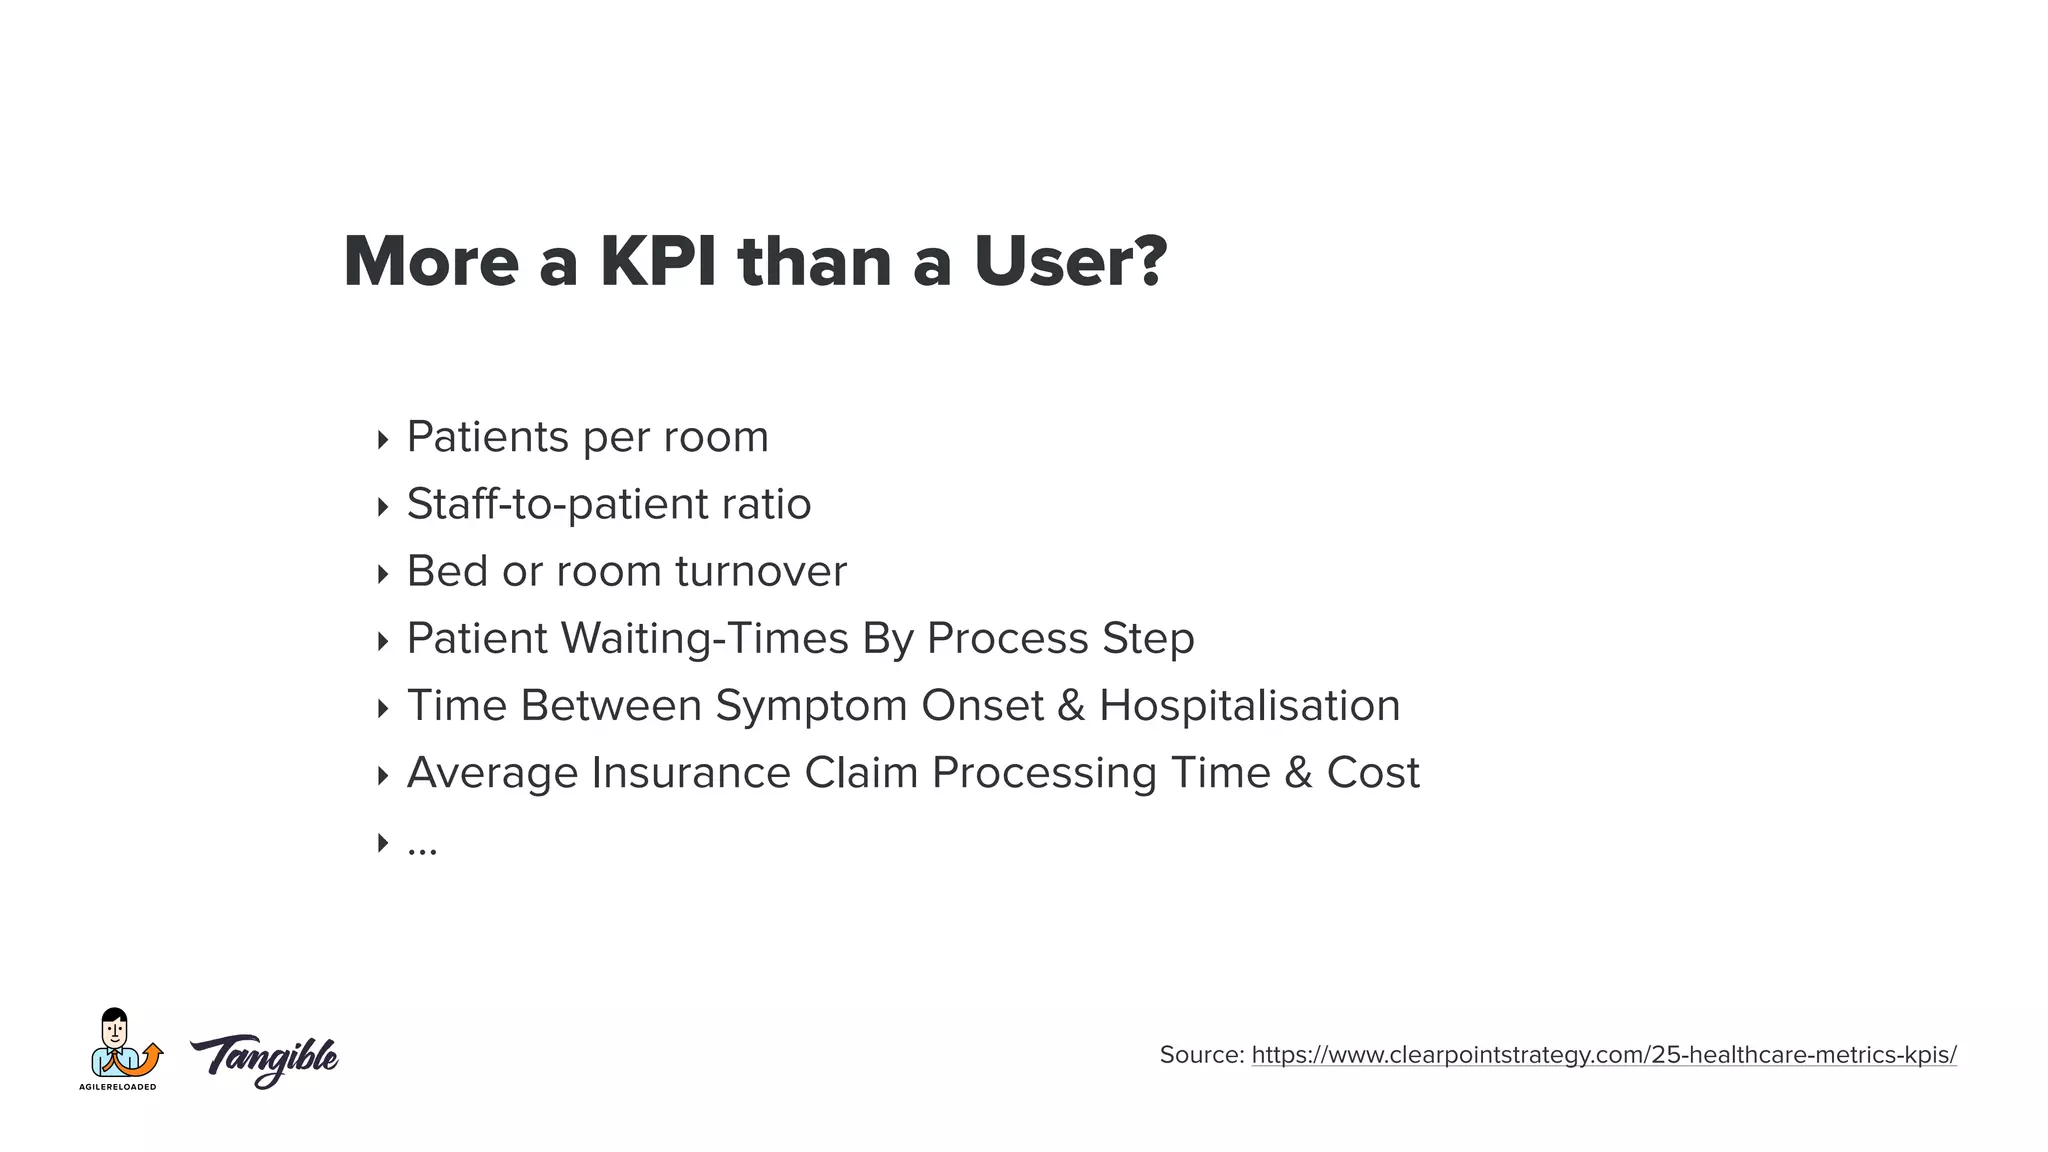
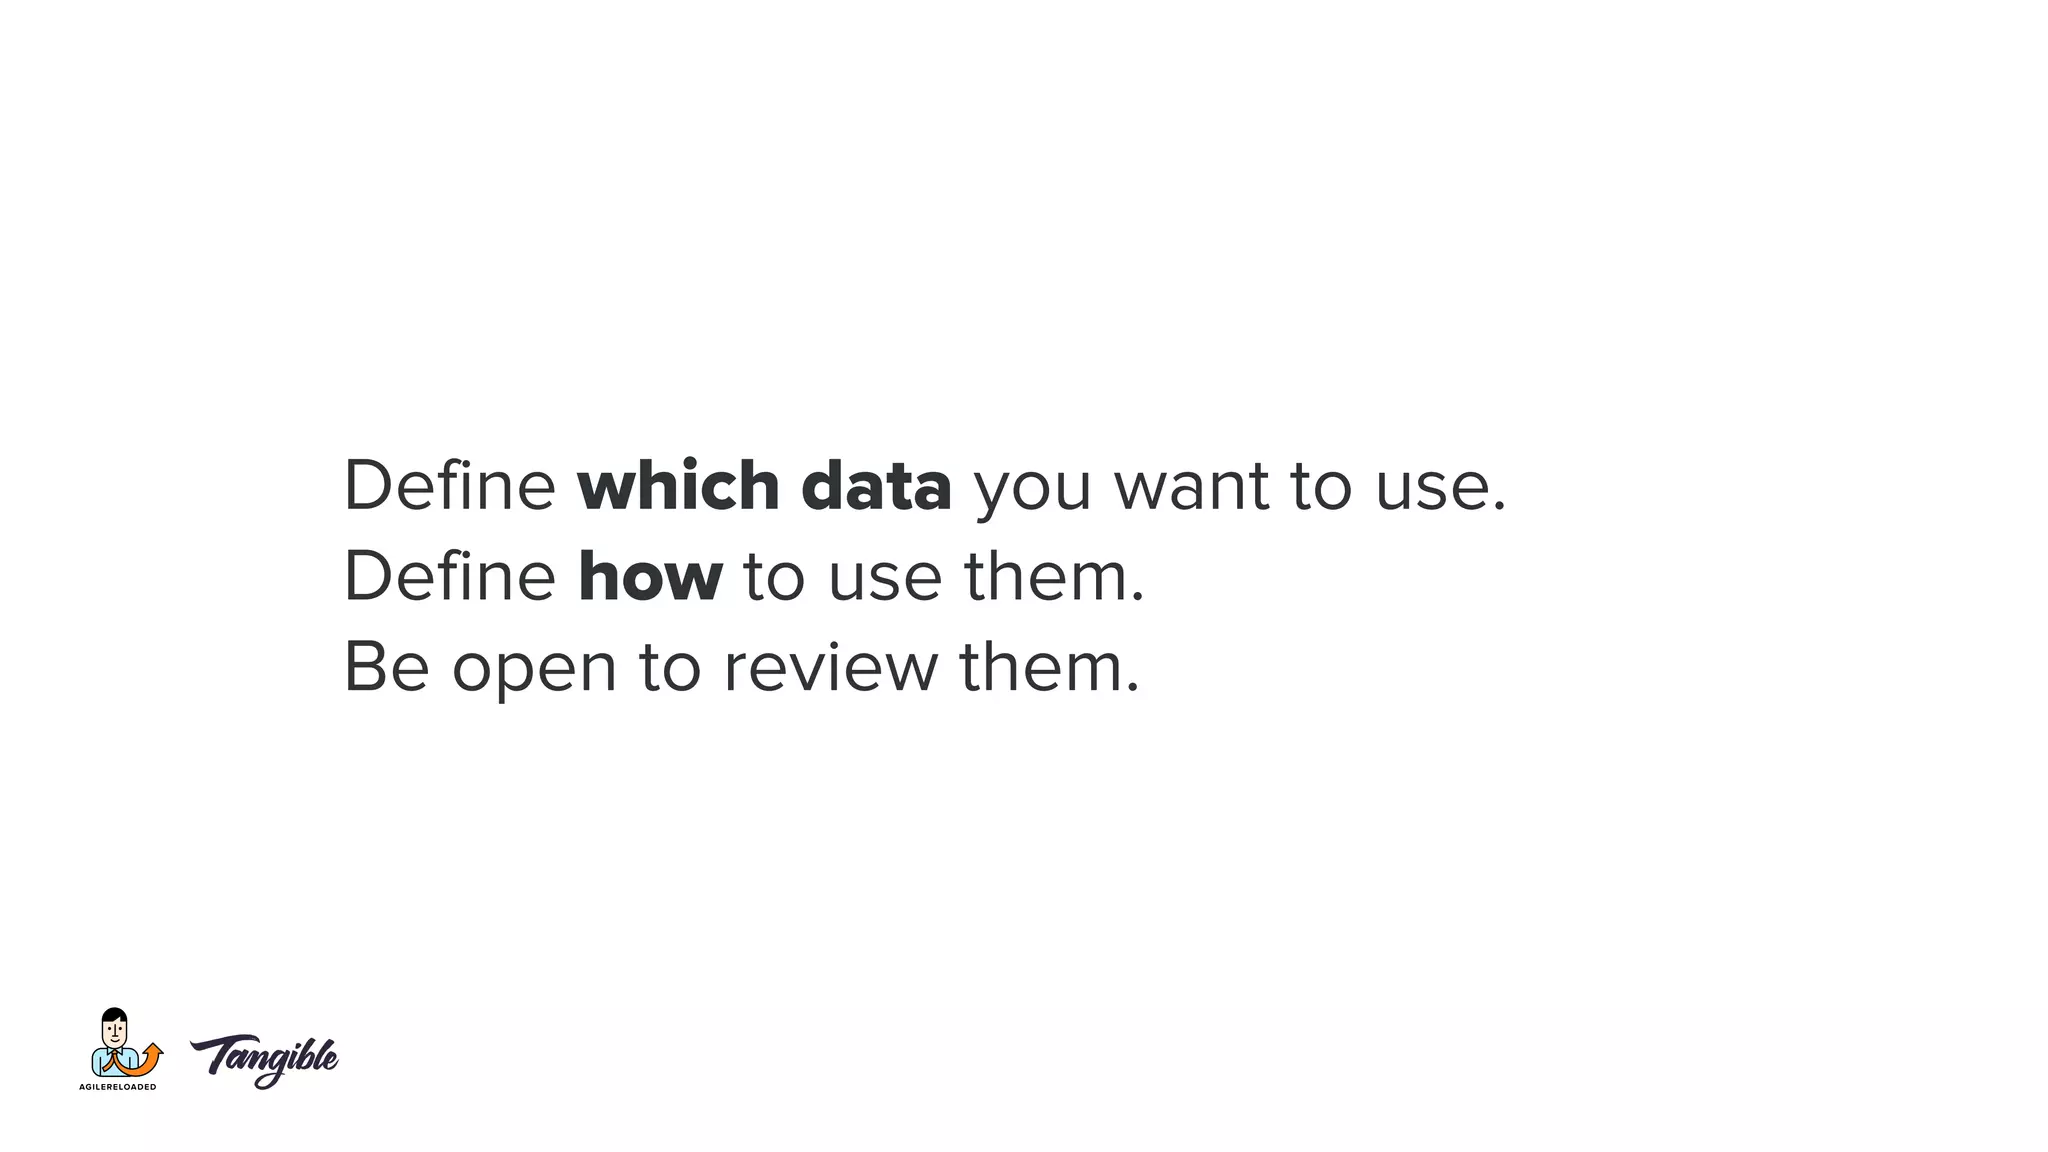
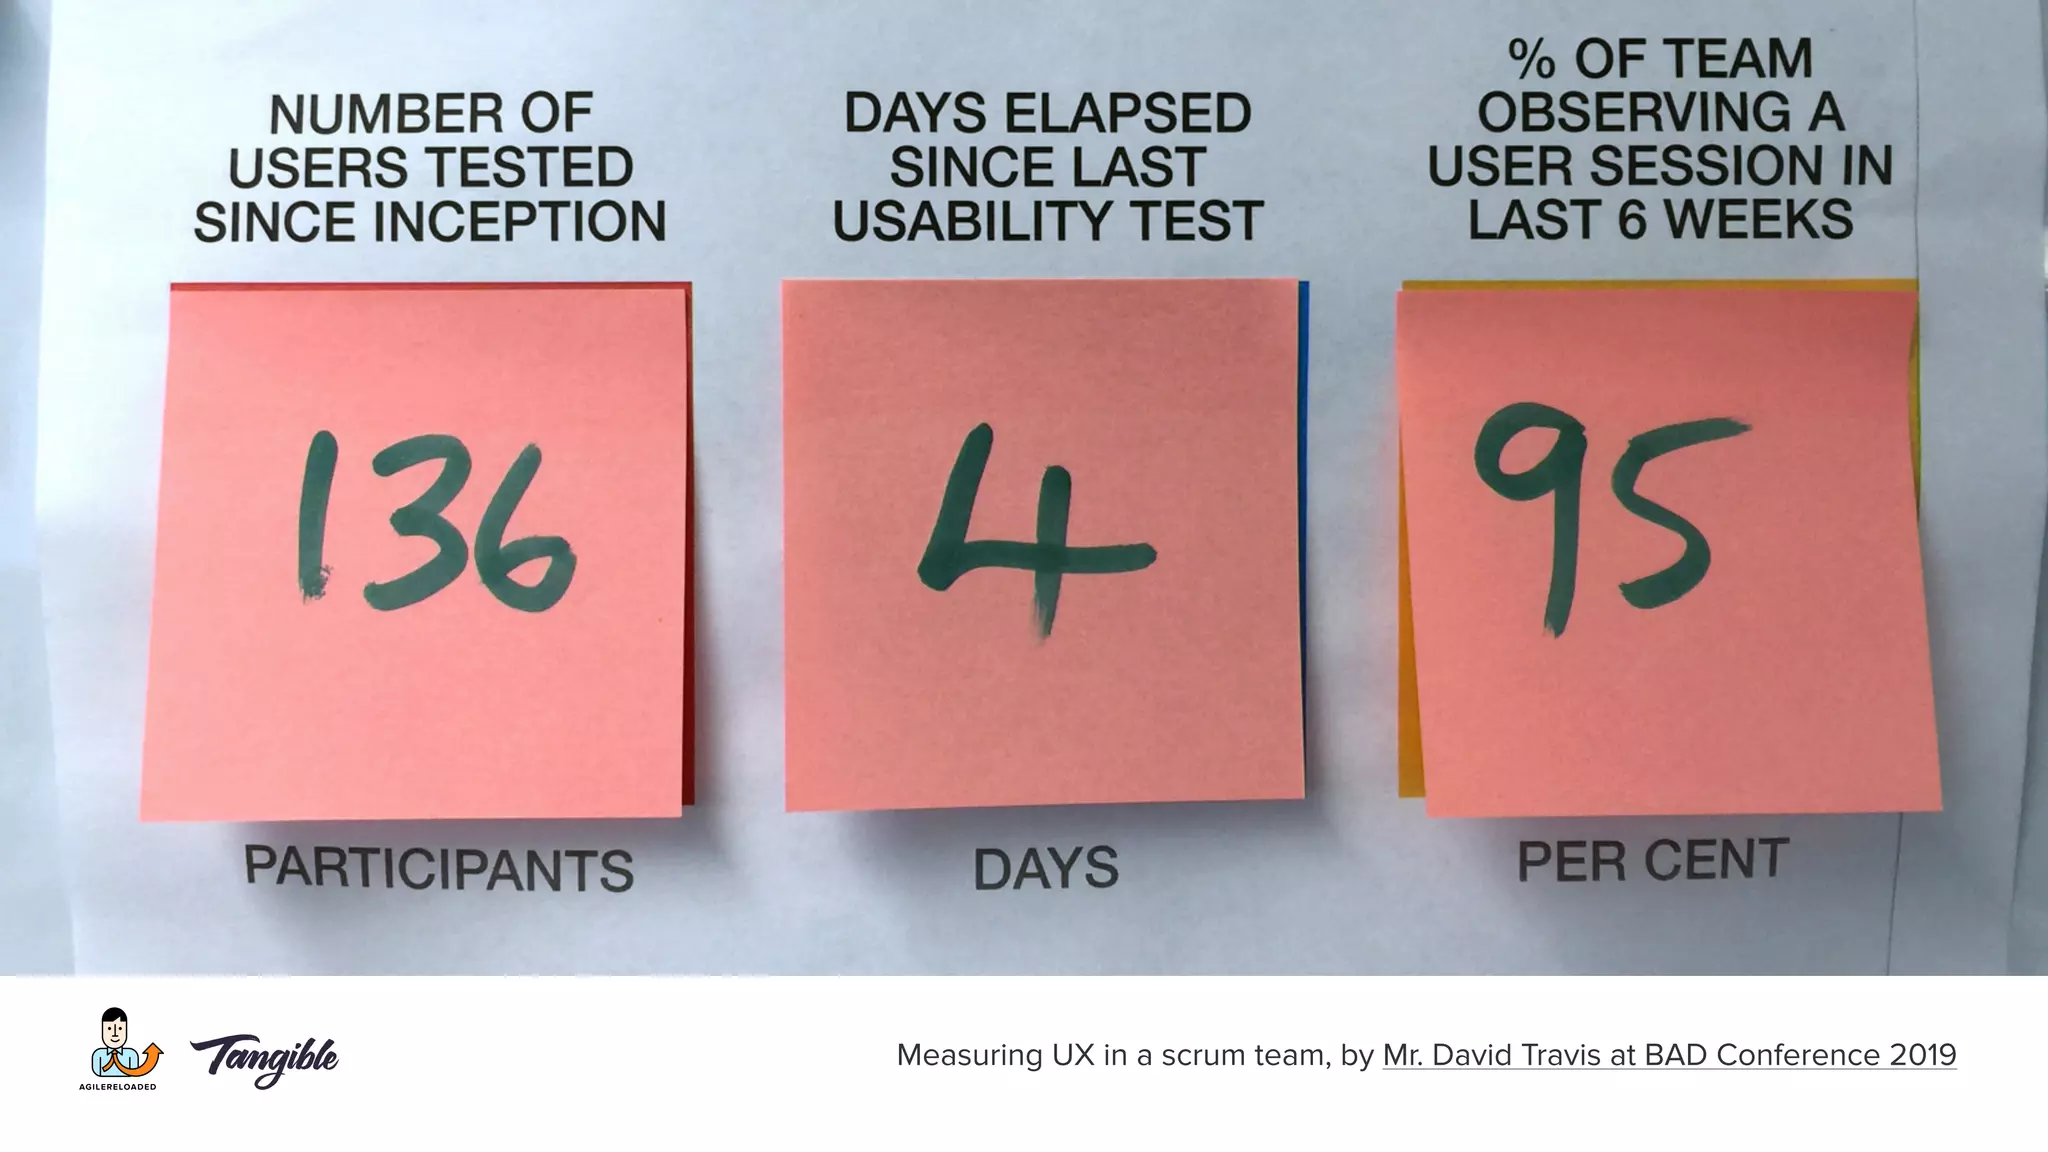
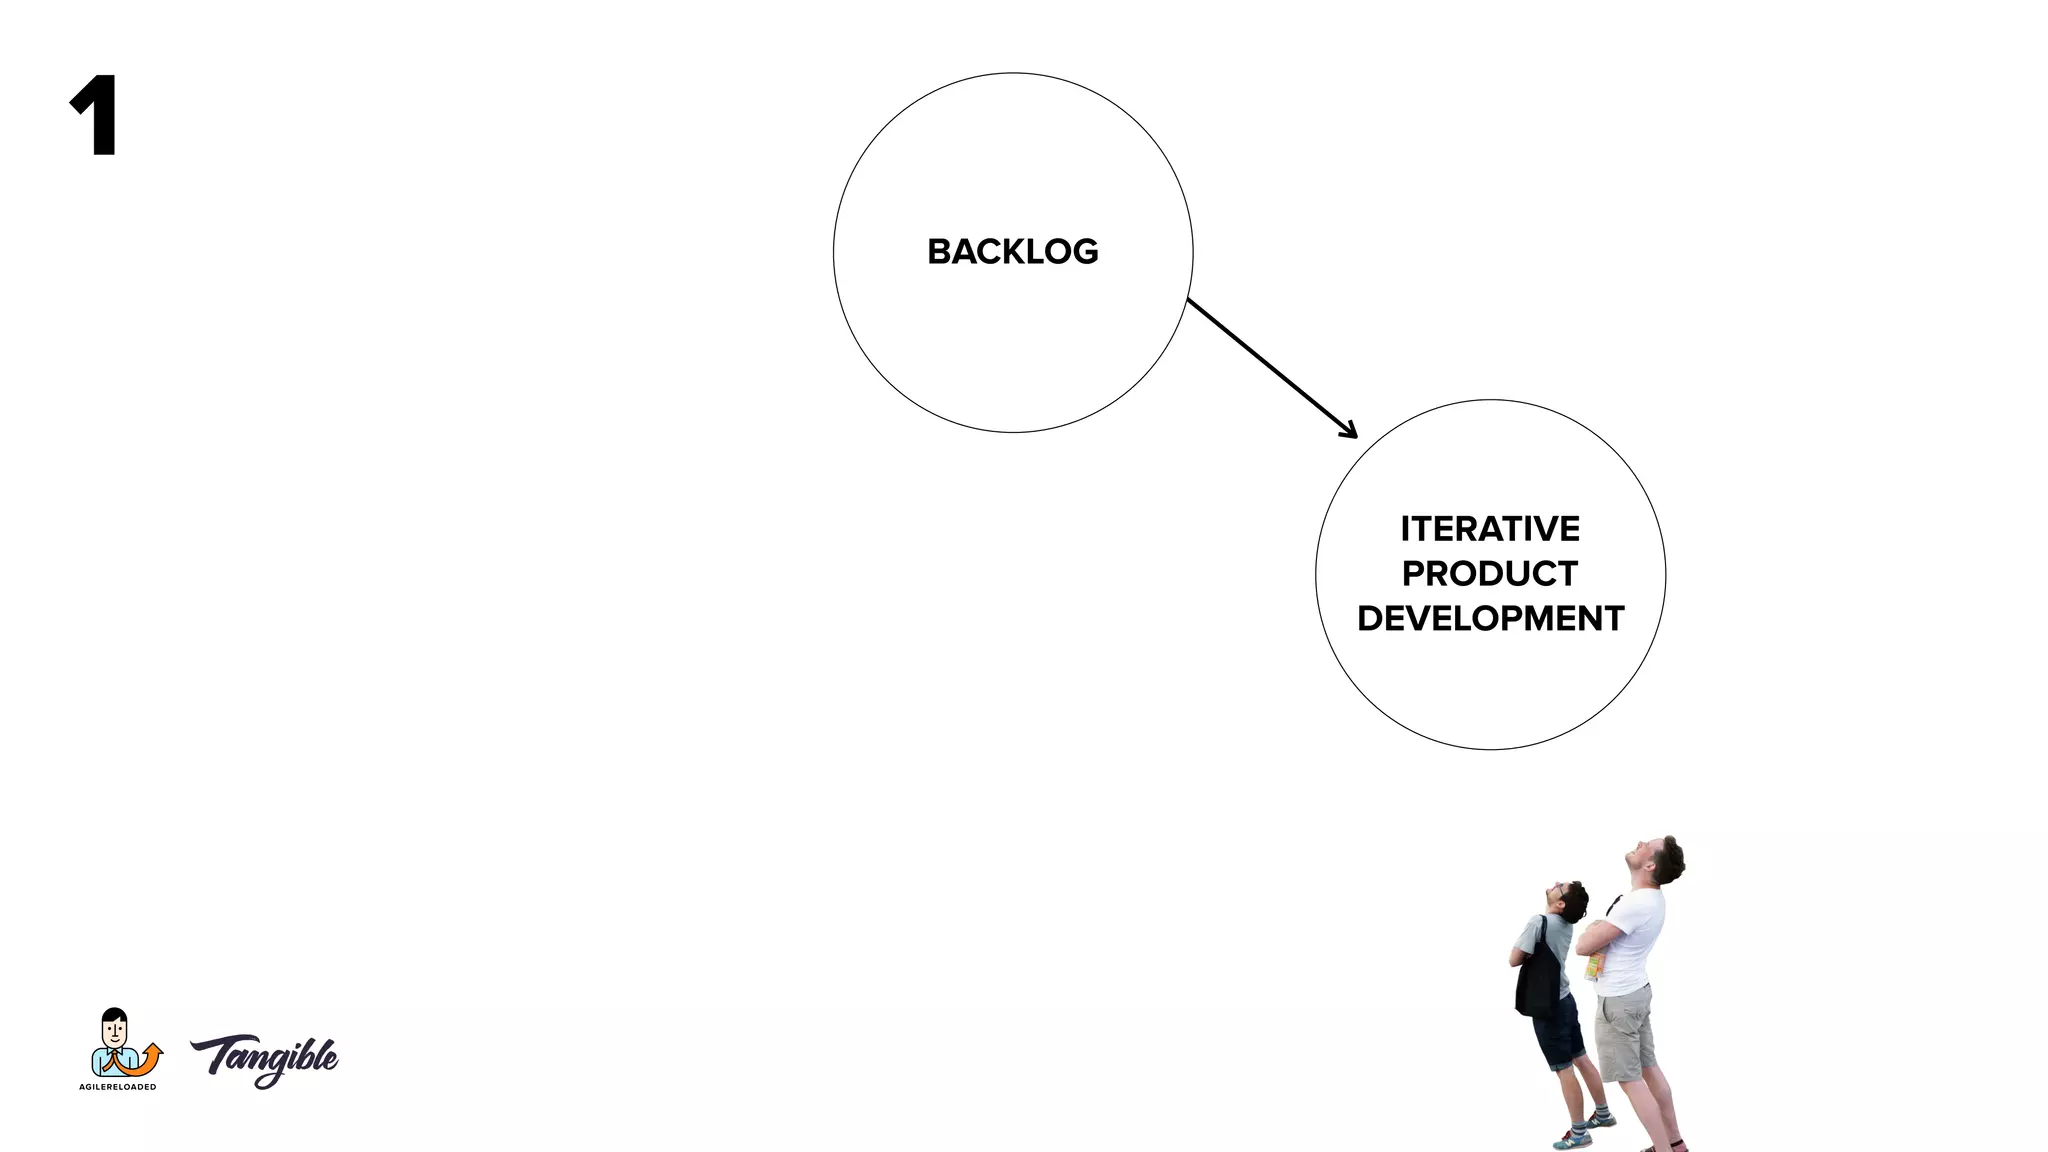
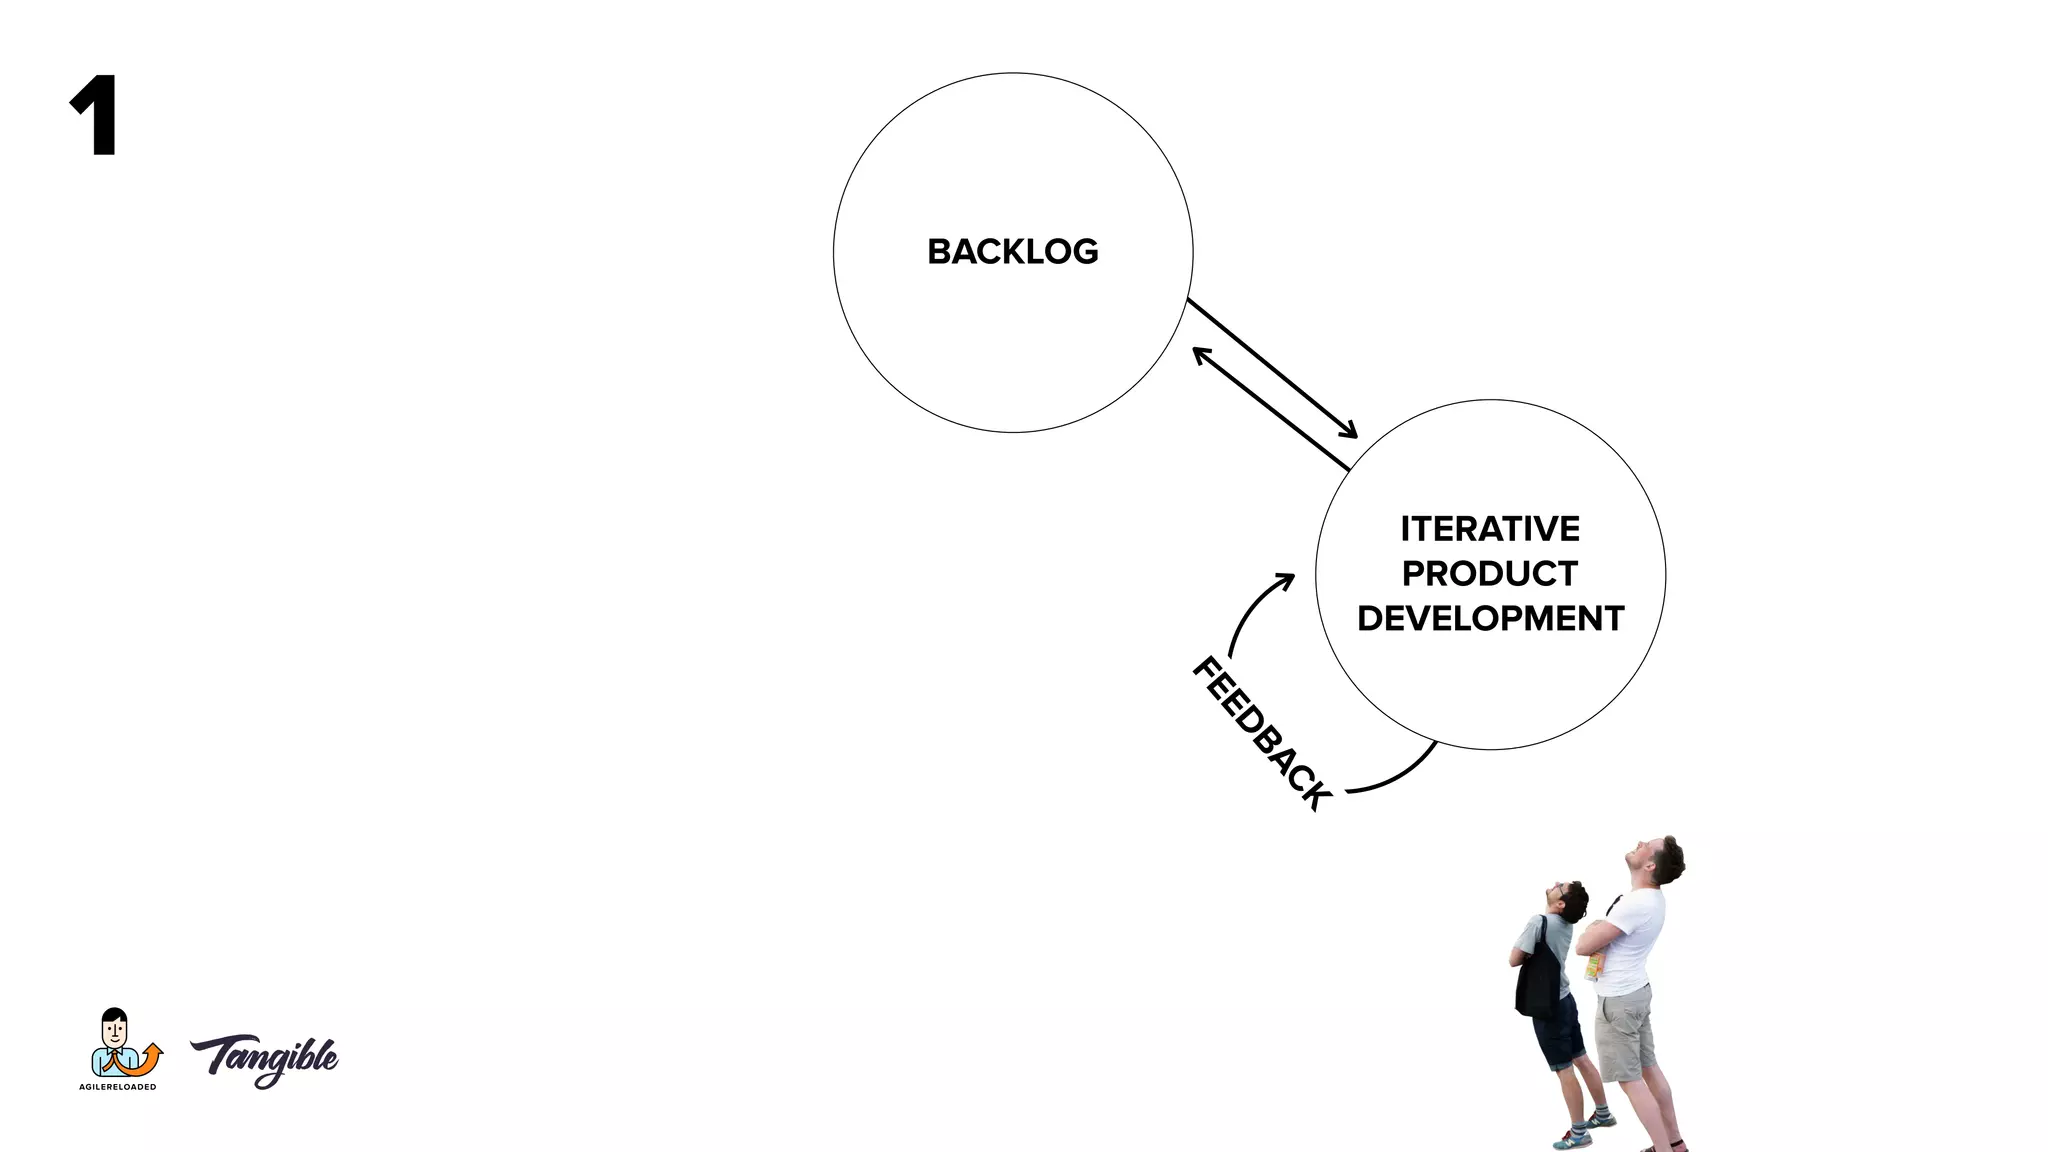
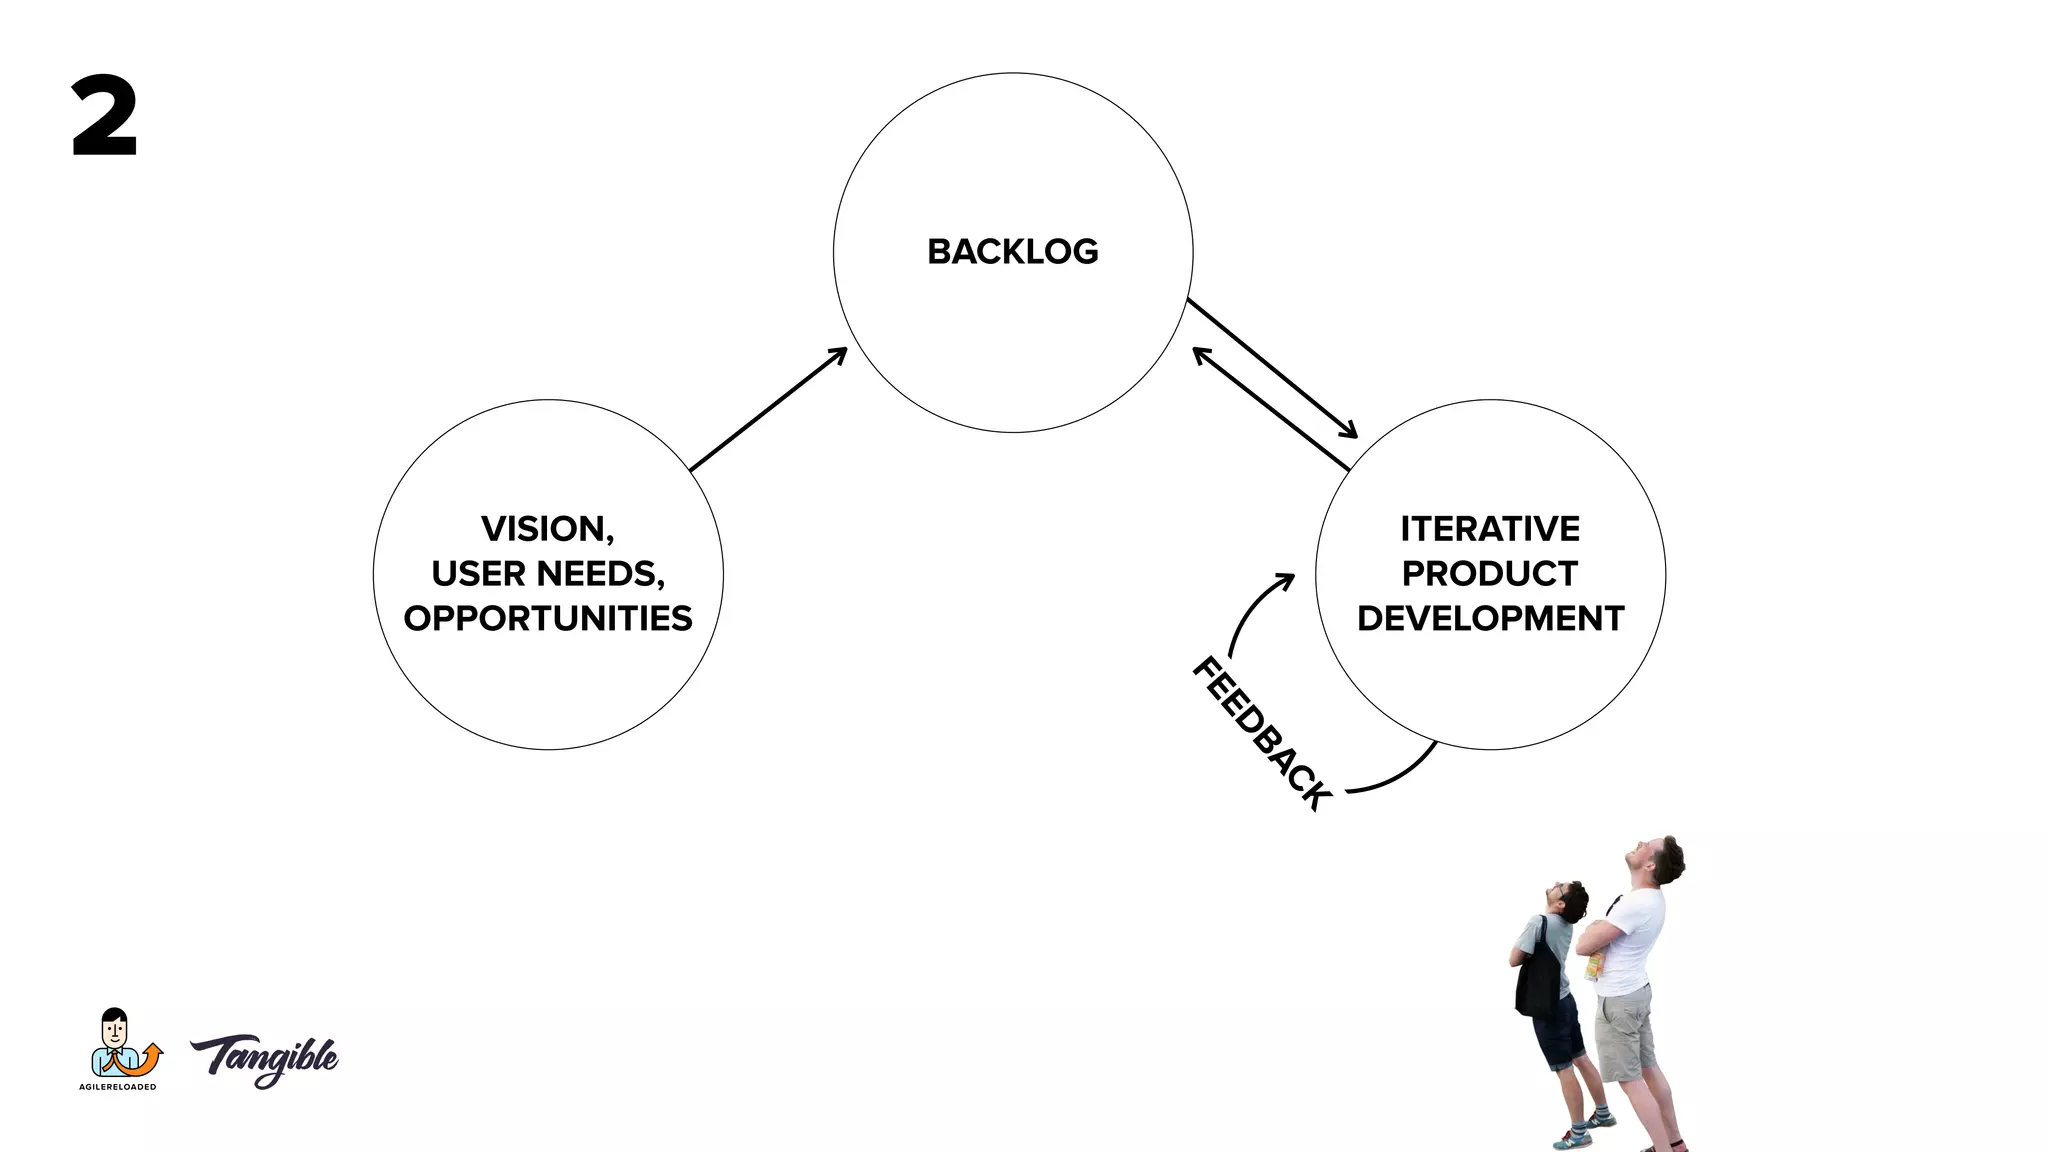
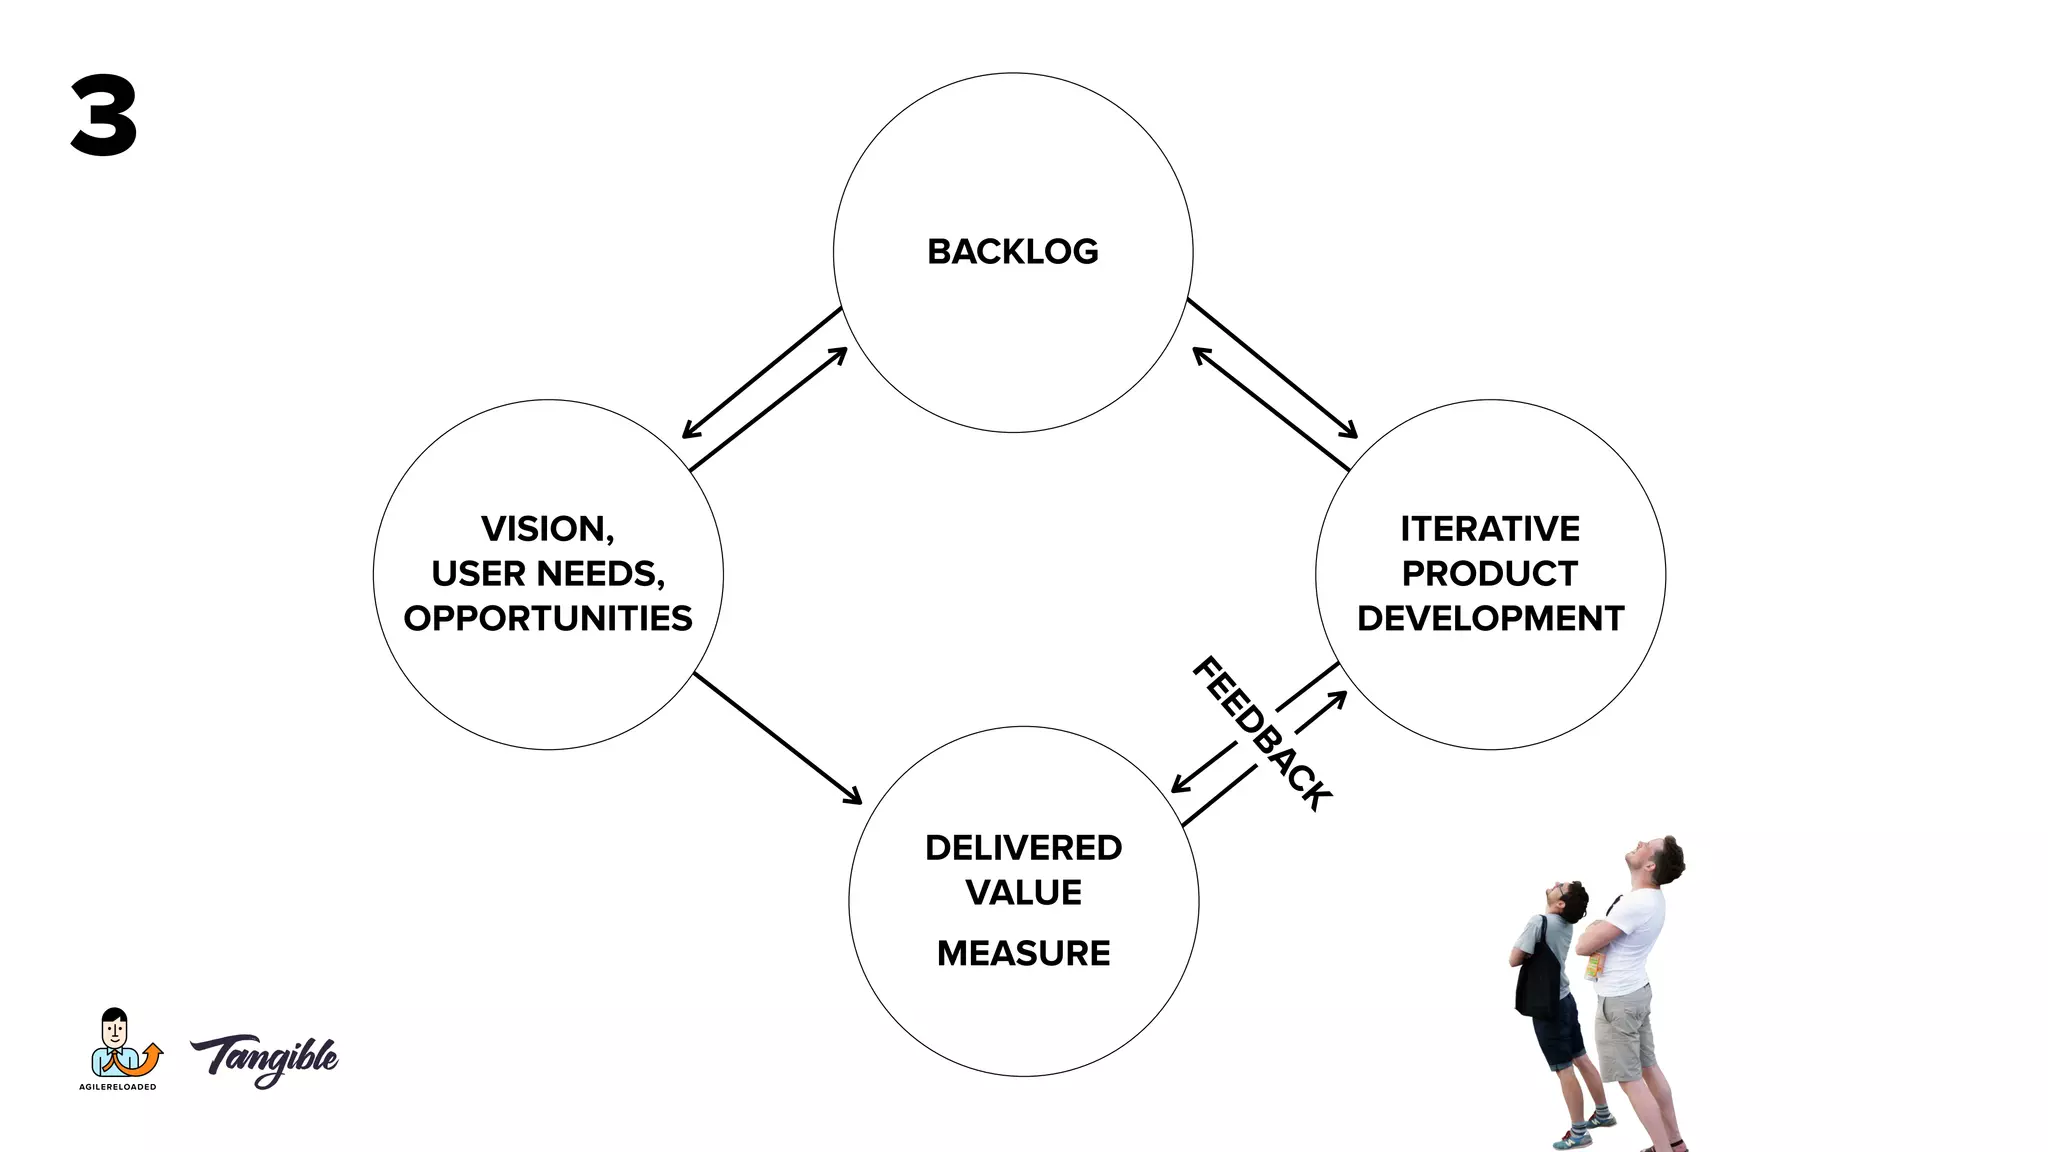
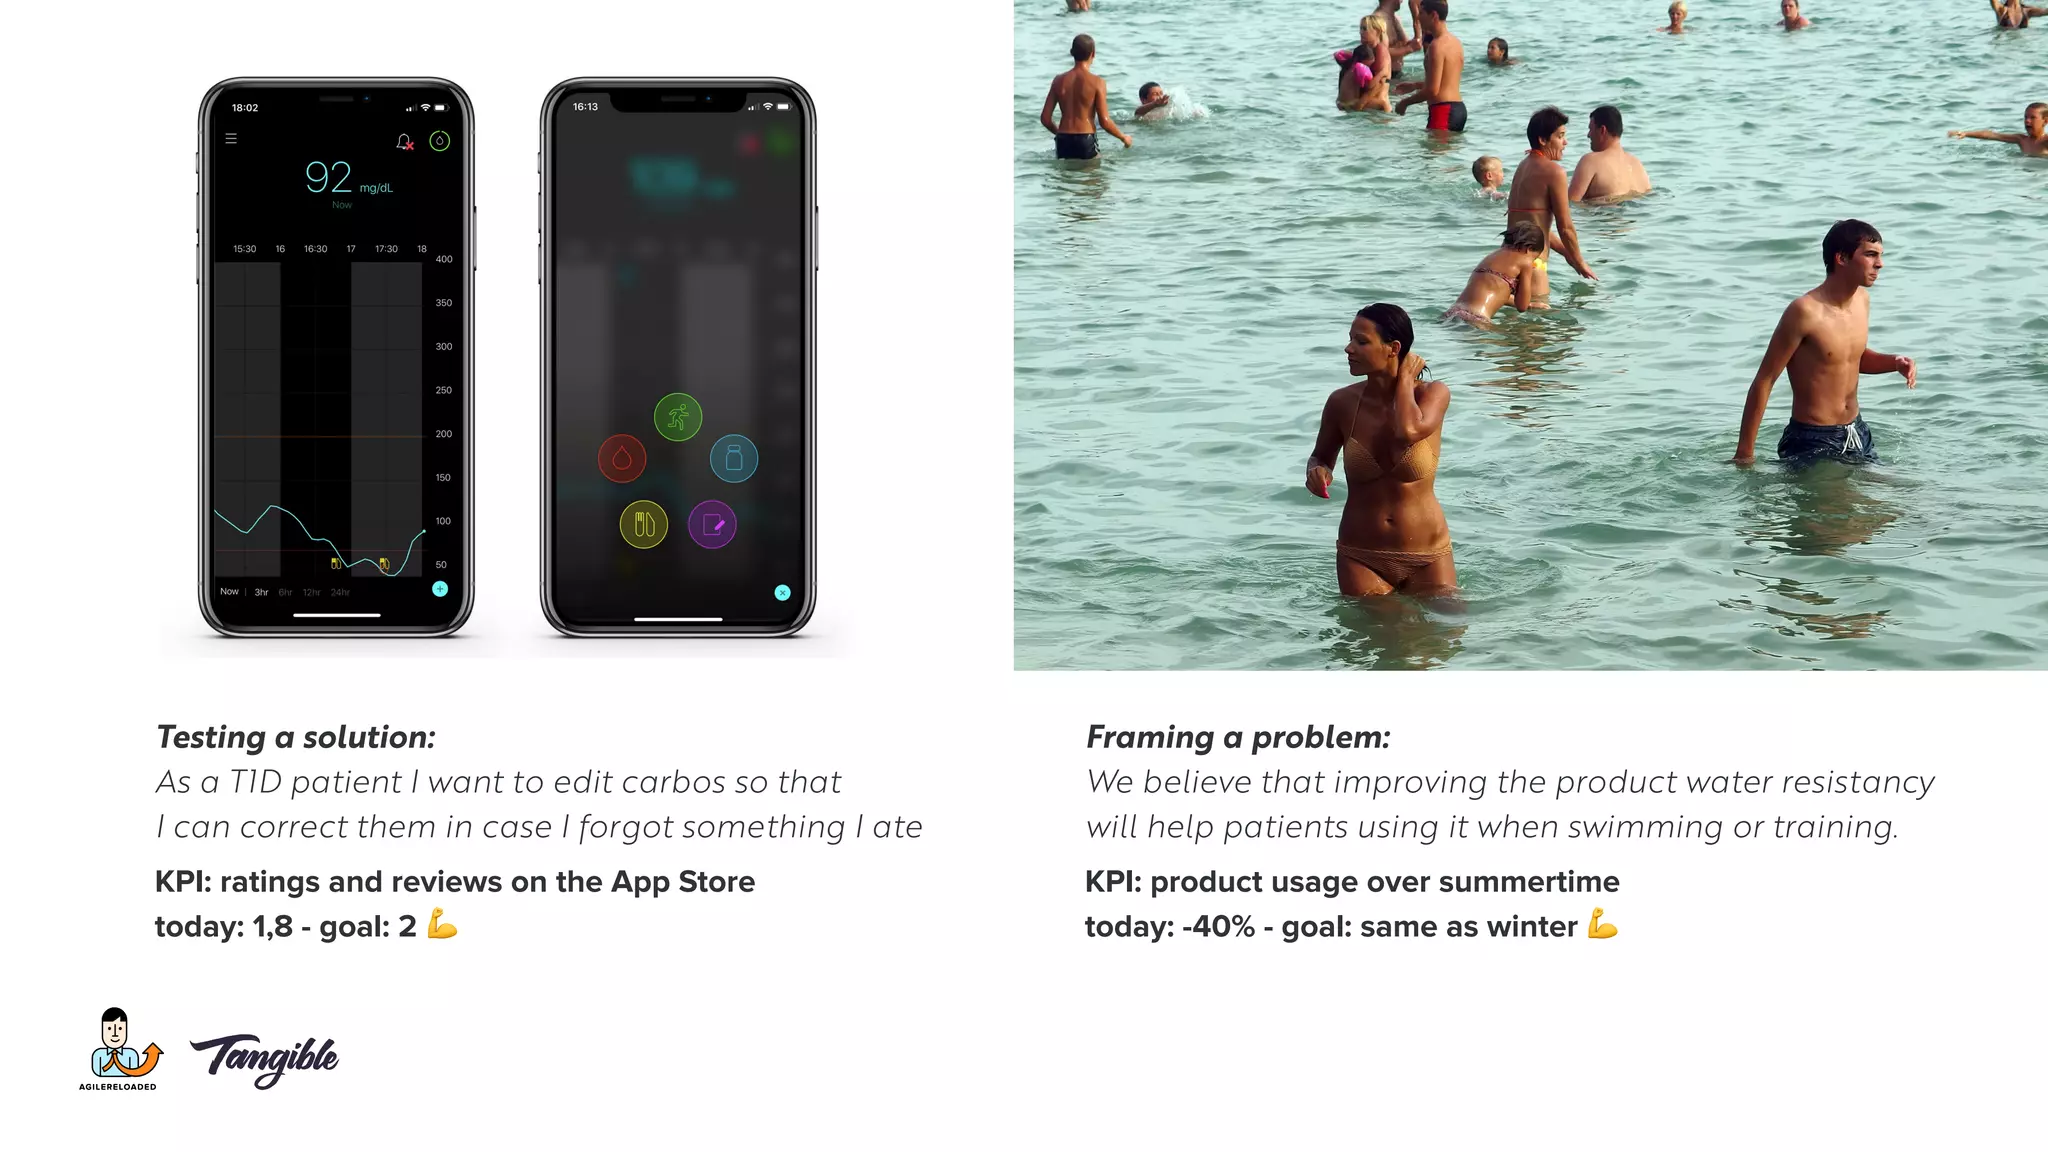
The document discusses the importance of measuring user experience and product value in a business context, emphasizing the transition from a mindset of 'it's done when it's done' to valuing useful and valuable outcomes. It outlines different measurement methods, including qualitative and quantitative approaches, and presents key performance indicators (KPIs) relevant to healthcare services. The goal is to gather actionable insights through iterative feedback, ultimately enhancing product features to meet user needs.


![CleanMyMac X v5.2.8 Crack for MacOS Full Version [Latest] pptx](https://cdn.slidesharecdn.com/ss_thumbnails/softwareoverview-251207194121-a81f0142-thumbnail.jpg?width=640&height=640&fit=bounds)
![iStat Menus 7.20 Crack for MacOS 2026 Full Version [Latest] pptx](https://cdn.slidesharecdn.com/ss_thumbnails/softwareoverview-251207191544-22b737dc-thumbnail.jpg?width=640&height=640&fit=bounds)
![Soundtoys Mac v5.5.5.0 Crack for MacOS Full Version [Latest] pptx](https://cdn.slidesharecdn.com/ss_thumbnails/softwareoverview-251207193711-91d8ae6b-thumbnail.jpg?width=640&height=640&fit=bounds)


![Driver Easy Pro Key 7.1.0.2641 Full Mac Crack Free Activated Download [2026]....](https://cdn.slidesharecdn.com/ss_thumbnails/software-251207185324-b2fb71b4-thumbnail.jpg?width=640&height=640&fit=bounds)


![Chapter4_Initiation_of_Sediment_Motion_v2[1].pptx](https://cdn.slidesharecdn.com/ss_thumbnails/chapter4initiationofsedimentmotionv21-251208223747-f94ef163-thumbnail.jpg?width=640&height=640&fit=bounds)
