SlideShare a Scribd company logo
1 of 7
Download to read offline
C. R. Subudhi et al Int. Journal of Engineering Research and Applications www.ijera.com 
ISSN : 2248-9622, Vol. 4, Issue 9( Version 1), September 2014, pp.139-145 
www.ijera.com 139 | P a g e 
Weekly Rainfall Analysis for Crop Planning Using Markov’s Chain Model for Kandhamal District of Odisha, India S. K. Kar1, D. P. Sahoo2, C. R. Subudhi3 1 & 2 B. Tech Students of C.A.E.T, 3Associate Prof. Dept. of SWCE C.A.E.T Orissa University of Agriculture & Technology, Bhubaneswar, Odisha ABSTRACT Weekly rainfall analysis of Kandhamal district during the period of 1965 to 2010 were taken for analysis purpose, the analysis is very much important for crop planning and analyzing the probability of occurrence of dry and wet periods. This will act as bench mark for crop planning as well as sustainable agricultural management of Kandhamal district which comes under the agro-climatic zone of East-coast hill region. Markov chain model has been utilized to derive the probability of dry or wet weeks and also forward and backward accumulation of rain water suitable for crop production. This analysis can be helpful to find out different cropping system including intercropping and sequence cropping suitable during that period. Key words : Markov chain, dry spell, wet spell, weekly, rainfall 
I. INTRODUCTION 
Phulbani is located at 20.47°N 84.23°E. It has an average elevation of 485 meters in the North Eastern Ghat zone. The geographical area of the Kandhamal district is 7654 sq.km. 76.4 % of this area is coming under forest. According to 2011 census the population of Kandhamal is 7,33,110, rural population is around 93 %. Among of total population 15 % are Scheduled caste and 54 % are Scheduled tribe. So this district is a tribal dominated and rural dominated district, so Agriculture development needs important for development and increase per capita income of the people of the district. So proper crop planning and time of sowing and harvesting will increase their crop yield, for further development of the district and state. So following rainfall models were tried to find out the crop planning. Markov chain probability model has been used extensively to find the long-term frequency behaviour of wet and dry weather spells (Victor and Sastri 1979). Another aspect of crop planning is backward and forward accumulation of rainfall to determine the onset and termination of wet season based on precipitation data. A number of studies have been conducted for location specific agricultural planning in general and crop planning in particular by analyzing daily, weekly, monthly, seasonal and annual rainfall data. Stern and Coe (1982) analyzed daily rainfall data for crop planning in semi-arid, tropics. Similar analysis of rainfall data has been done for crop planning in coastal, semi-arid, dry farming, sub-humid and Himalayan foothill regions, Panigrahi(1998); Sharda and Das (2005). 
Farmer's cropping strategies are greatly influenced by the variability of the onset and termination of rainy season. Accumulation of 75 mm rainfall has been considered as the onset time for growing season for dry-seeded crops in sandy loam soil and 200 mm accumulated rainfall for initiation of paddling i.e. transplanting of rice (Oryza sativa L.). Similarly end of wet season is determined by backward summing of rainfall data. It is considered that 500 mm and 300 mm accumulated values represent the week after which sufficient rain would be expected to sustain a second rice crop or other short duration field crops assuming a fully charge soil profile at planning (WMO 1982). 
II. MATERIALS AND METHODS 
Daily rainfall data for 30 years (1981-2010) were collected from rain gauge stations Khurda (18°46'N to 20°95' N latitude, 83°48'E to 87°46' E longitude and 42 m altitude). The standard 7 day period (weekly) has been taken to establish the dry and wet spell frequency based on Markov Chain Model considering a week receiving rainfall less than 20mm as a dry period and 20 mm or more as a wet period. The different notations followed in this analysis are given below: f(Pd)= …(1) where f (Pd) probability of the period considered being dry , nd number of dry periods observed, yn number of years of data used. f(Pdd)= …(2) 
RESEARCH ARTICLE OPEN ACCESS
C. R. Subudhi et al Int. Journal of Engineering Research and Applications www.ijera.com 
ISSN : 2248-9622, Vol. 4, Issue 9( Version 1), September 2014, pp.139-145 
www.ijera.com 140 | P a g e 
Where f (Pdd), probability of dry period preceded by another dry period (conditional) and ndd , number of dry period preceded by another dry period. f(Pd2)=f(Pd)f'(Pd) …(3) where f(Pd2),probability of 2 consecutive dry period; f(Pd) , probability of the period being dry (1st period) and f'(Pd),probability of 2nd consecutive dry period, given the preceding period being dry. f(Pd3)=f(Pd) f''(Pd) …(4) where f(Pd3), probability of 3 consecutive dry period; and f''(Pd)probability of 3rd being dry given the preceding period dry. f(Pw)= …(5) where f(Pw), probability of the period considered being wet and number of wet periods observed. The f(P ww), f(P w2) and f(P w3) have been estimated in the same manner as f(Pdd), f(Pd2) and f(Pd3) and the notations used are having the same meaning except the period being wet. Using the above formulas, probabilities of dry weeks and wet weeks; conditional probabilities of dry weeks preceded by dry weeks and wet weeks preceded by wet weeks and probability of consecutive 2 and 3 dry or wet weeks starting with weeks dry or wet have been estimated. For the calculation of forward and backward accumulation, weekly rainfalls are arranged in column and the year in rows. For calculation of forward accumulation 22nd week has been considered as the starting period due to start of monsoon rain. The rainfalls are added week wise from 22nd week onwards to find the corresponding week number in which the cumulative rainfall has reached a sum total of 75 mm and 200 mm. Similarly, week -wise rainfalls are added backward from 52nd week (52nd week + 51st week + . ... ) to get 100 mm, 300 mm and 500 mm total and the corresponding week numbers are noted. Then the years are assigned with rank number, i.e. 1981-2010 as 1 to 30. The probability of each rank is calculated by the simple statistical formula. f(P)= …(6) Where f(P), probability (%); Rn, rank number and yn, number of years of observation . 
For forward accumulation the rank order and probability level are arranged in ascending order and the corresponding week numbers are arranged in the same manner. Similarly, for backward accumulation the rank order and probability level are arranged in descending order and the corresponding week number for 500 mm, 300 mm and 100 mm respectively are arranged in ascending order. Table1 Analysis of weekly rainfall pattern Initial Probability(%) Conditional probability(%) SMW PD PW PDD PWD PWW PDW 1 96.2 3.7 92.3 7.7 0 100 2 
92.5 
7.4 
80 
20 
0 
100 3 96.2 7.0 84.6 15.4 0 100 4 
96.2 
3.7 
92.3 
8 
0 
100 5 92.5 11.1 92 8 50 50 6 
96.2 
3.7 
92.3 
8 
0 
100 7 85.1 14.8 82.3 17.7 25 75 8 
100 
0 
96.2 
3.8 
0 
100 9 96.2 3.7 92.3 8 0 100 10 
96.2 
3.7 
92.3 
8 
0 
100 11 96.2 3.7 92.3 8 0 100 12 
100 
0 
96.2 
3.8 
0 
100 13 85.1 14.8 78.2 21.3 25 75 14 
85.1 
14.8 
82.6 
17.4 
0 
100 15 96.2 3.7 92.3 8 0 100 16 
88.8 
11.1 
83.3 
16.7 
0 
100 17 81.4 18.5 81.8 18.2 40 60 18 
85.1 
14.8 
82.6 
17.4 
25 
75
C. R. Subudhi et al Int. Journal of Engineering Research and Applications www.ijera.com 
ISSN : 2248-9622, Vol. 4, Issue 9( Version 1), September 2014, pp.139-145 
www.ijera.com 141 | P a g e 
19 85.1 14.8 78.2 21.8 0 100 20 
81.4 
18.5 
77.2 
22.3 
20 
80 21 77.7 22.2 76.1 23.9 16 84 22 
66.6 
33.3 
72.2 
27.8 
44 
56 23 59.2 40.7 69.5 30.5 36 64 24 
33.3 
66.6 
55.5 
44.5 
72 
28 25 33.3 66.6 11.1 88.9 77 23 26 
22.2 
77.7 
16.6 
83.4 
76 
24 27 11.1 88.8 0 100 83 17 28 
22.2 
77.7 
33.3 
66.7 
90 
10 29 11.1 88.8 0 100 83 17 30 
14.8 
85.1 
0 
100 
78 
22 31 14.8 85.1 0 100 78 22 32 
11.1 
88.8 
0 
100 
83 
17 33 25.9 74 14.2 85.8 65 35 34 
22.2 
77.7 
16.6 
83.4 
80 
20 35 14.8 85.1 25 75 86 14 36 
22.2 
77.7 
0 
100 
71 
29 37 18.5 81.4 0 100 72 28 38 
22.2 
77.7 
0 
100 
71 
29 39 37 62.9 20 80 64 36 40 
55.5 
44.4 
46.6 
53.4 
41 
59 41 59.2 33.3 75 25 44 56 42 
51.8 
48.1 
42.8 
57.2 
38 
62 43 92.5 74 88 12 0 100 44 
88.8 
111 
87.5 
12.5 
33 
67 45 81.4 185 77.2 22.8 0 100 46 
88.8 
111 
87.5 
12.5 
33.3 
67 47 96.2 3.7 92.3 7.7 0 100 48 
100 
0 
96.2 
3.8 
0 
100 49 96.2 3.7 96.1 3.9 0 100 50 
96.2 
3.7 
92.3 
7.7 
0 
100 51 96.2 3.7 84.6 15.4 0 100 52 
100 
0 
96.2 
3.8 
0 
100
C. R. Subudhi et al Int. Journal of Engineering Research and Applications www.ijera.com 
ISSN : 2248-9622, Vol. 4, Issue 9( Version 1), September 2014, pp.139-145 
www.ijera.com 142 | P a g e 
Table.2 Consecutive dry probability and consecutive wet probability of Phulbani block Consecutive dry probability Consecutive wet probability SMW 2D 3D 2W 3W 1 88.7 85.0 0 0 2 
74 
70.3 
0 
0 3 81.3 81.3 0 0 4 
88.7 
73.9 
0 
0 5 85.1 77.6 5.55 0 6 
88.7 
77.6 
0 
0 7 70.0 58.9 3.7 0 8 
96.2 
88.7 
0 
0 9 88.7 70.2 0 0 10 
88.7 
85.0 
0 
0 11 88.7 85.0 0 0 12 
96.2 
92.4 
0 
0 13 66.5 55.4 3.7 0 14 
70.2 
59.1 
0 
0 15 88.7 81.3 0 0 16 
73.9 
59.1 
0 
0 17 66.5 48.0 7.4 3.7 18 
70.2 
51.7 
3.7 
0 19 66.5 48.0 0 0 20 
62.8 
48.0 
3.7 
0 21 59.1 40.6 3.552 0 22 
48.0 
25.8 
14.652 
7.3 23 41.1 30.8 14.652 3.6 24 
18.4 
0 
47.952 
33.1 25 3.6 0 51.282 36.6 26 
3.6 
0 
59.052 
47.9 27 0 0 73.704 58.9 28 
7.3 
0 
69.93 
51.4 29 0 0 73.704 70.0 30 
0 
0 
66.378 
58.9 31 0 0 66.378 51.5 32 
0 
0 
73.704 
58.9 33 3.6 0 48.1 33.2 34 
3.6 
0 
62.16 
36.5 35 3.7 0 73.186 62.2 36 
0 
0 
55.167 
40.4 37 0 0 58.608 32.9 38 
0 
0 
55.167 
40.4 39 7.4 0 40.256 21.9 40 
25.8 
7.3 
18.204 
3.6 41 44.4 29.5 14.652 7.3 42 
22.1 
22.1 
18.278 
10.9 43 81.4 70.2 0 0 44 
77.7 
59.1 
3.663 
0 45 62.8 36.9 0 0 46 
77.7 
59.1 
3.6963 
0 47 88.7 73.9 0 0 48 
96.2 
85.0 
0 
0 49 92.4 85.0 0 0 50 
88.7 
81.3 
0 
0 51 81.3 70.2 0 0 52 
96.2 
92.4 
0 
0
C. R. Subudhi et al Int. Journal of Engineering Research and Applications www.ijera.com 
ISSN : 2248-9622, Vol. 4, Issue 9( Version 1), September 2014, pp.139-145 
www.ijera.com 143 | P a g e 
Table 3 Weekly rainfall pattern at Kandhamal district of Odisha SMW Mean Max Min SD CV 1 1.2 30.3 0 5.8 458.5 2 
4.6 
78 
0 
15.5 
0.77 3 20.1 59 0 11.7 58.1 4 
39.2 
61.8 
0 
12.3 
31.3 5 11.4 38 0 11.9 72.5 6 
16.7 
35 
0 
12.5 
42.0 7 10.3 66.9 0 8.4 147.5 8 
9.2 
13 
0 
7.1 
31.6 9 13.8 44 0 15.5 69.6 10 
8.3 
23 
0 
2.9 
63.3 11 10.4 29 0 9.8 57.5 12 
9.1 
15 
0 
5.4 
63.1 13 9.0 56 0 6.0 168.8 14 
9.9 
70 
0 
5.8 
185.0 15 11.8 27 0 15.5 51.5 16 
15.8 
33 
0 
18.6 
56.1 17 9.8 38 0 6.2 145.9 18 
11.6 
64 
0 
9.0 
156.2 19 12.8 146 0 14.5 290.4 20 
17.8 
101 
0 
18.5 
166.7 21 20.3 100.2 0 38.1 128.1 22 
19.2 
122 
0 
30.2 
127.1 23 16.9 137.6 0 20.3 214.0 24 
45.7 
235 
0 
33.4 
165.7 25 32.2 116 0 46.1 218.8 26 
55.1 
359.6 
0 
65.6 
127.4 27 48.2 429 0 54.8 193.4 28 
79.7 
401 
0 
70.6 
117.4 29 69.7 348.8 0 94.7 122.2 30 
59.2 
344 
0 
94.8 
121.9 31 73.8 329.8 0 85.7 112.6 32 
71.7 
342 
0 
72.9 
117.2 33 88.0 280 0 84.7 98.9 34 
104.8 
222 
0 
85.5 
57.5 35 69.4 361.6 0 88.7 125.4 36 
62.3 
155 
0 
60.6 
66.2 37 84.7 346.2 0 87.3 99.1 38 
60.3 
308.1 
0 
41.8 
108.5 39 64.0 133 0 85.6 55.4 40 
100.1 
153 
0 
66.7 
40.4 41 49.9 238 0 35.4 71.3 42 
38.5 
129 
0 
40.91 
144.9 43 32.4 103.8 0 36.16 63.2 44 
39.5 
97 
0 
56.9 
51.6 45 22.1 98 0 20.9 88.9 46 
24.5 
41.11 
0 
20.7 
75.6 47 21.9 67 0 19.3 58.7 48 
23.7 
5 
0 
18.8 
4.0 49 20.9 33 0 13.1 30.2 50 
19.9 
54 
0 
0.980 
53.5 51 20.2 62 0 0.392 68.7 52 
0.1 
3 
0 
0.577 
519.8
C. R. Subudhi et al Int. Journal of Engineering Research and Applications www.ijera.com 
ISSN : 2248-9622, Vol. 4, Issue 9( Version 1), September 2014, pp.139-145 
www.ijera.com 144 | P a g e 
Weekly rainfall Data of 27 years (1984– 2010) indicated that the monsoon starts effectively from 24th SMW (11 – 17th June) and remains active up to 39th SMW (30th November). Therefore, mean length of rainy season was found to be 15 weeks (105days). It is seen from the above table 3 that among all the 52 weeks contributes an average rainfall of 28.57mm with minimum and maximum rainfall of 0 mm and 429mm. The coefficient of variance (CV) 5.1. It was also observed that even at probability level of 0.55, there was no rainfall from 30th to 52nd week. There is only 19 % probability of receiving more than 10mm rainfall from 11th to 21st week. At 0.80 probability levels, no rainfall was assured during 43rd to 52nd weeks. The winter seasons weeks (between 39th and 52nd) weeks received no rainfall. It was also observed that within a normal month there were weekly rainfall variations causing temporary dry spells. When these dry spells coincide with the critical stage of crop growth, there will be considerable reduction in the yield of standing field crops. Therefore, appropriate moisture conservation measures such as mulching and water harvesting should be adopted to save crops from damaging action of drought. Table 1 shows that the probability of occurrence of dry week is high untill end of 23rd week. The range of probability of occurrence of dry week from 1st to 23rd week is between 59.2% to 100 %. The probability of occurrence of dry week preceded by another dry week and that of dry week preceded by another wet week vary from 0% to 96.2% and 50% to 100% respectively during these periods. The probability of occurrence of wet week preceded by wet week and that of wet week preceded by dry week vary from 0% to 44% and 3.8% to 30.5%. From 24th to 41st week the probability of dry week and that of dry week preceded by another dry week varies from 11.1% to 59.2% and 0% to 75%. The probability that these weeks remain wet varies between 33.3% and 88.8%. The transitional probability of wet week preceded by another wet week varies from 14.65% to 73.7%. The chances of occurrence of dry spells are again high from 44th week to the end of the year. Probability of occurrence of wet week preceded by another wet week during these periods is between 0.00% and 86%. 
The results pertaining to initial and conditional probabilities of dry and wet weeks and consecutive dry and wet weeks are presented in table 1 and 2 respectively for all the 52 standard meteorological weeks but, the results are discussed in relevance with rainy season (24th SMW –39th SMW) only. The probability of occurrence of 2 consecutive wet weeks are more than 35% during 24th –39th SMW and the probability of occurrence of 3 consecutive wet weeks are more than 25% during 24th –38th SMW (Table 2). The weekly rainfall attributes showing mean, maximum, minimum, standard deviation, coefficient of variation and percentage of weekly rainfall contribution towards annual rainfall are presented in table 5. The results reveal that, there are total of 48 weeks (1st –7th, 9th –11th SMW) where rainfall exceeds more than 20 mm. So harvesting excess runoff water for future supplemental irrigations and also drives attention towards soil erosion measures to be taken up for soil erosion control. During rainy season the mean weekly rainfall is found to be more than the weekly contribution of rainfall towards annual average rainfall is found to be highest during 25th –38th SMW. Crop planning for kharif (monsoon) season: During the kharif season, a good weekly rainfall (above 10mm) was received during 11th to 21st at 0.20-0.30 probability level, which was expected to take care of dry spells during the season. It indicates that seedbed preparation and sowing of kharif crops can be initiated in the 11th week. The reliability of getting rainfall at least equal to the mean rainfall is between 0.20 and 0.50 probability levels. Thus, it seems difficult to plan agricultural operations based on mean weekly rainfall alone. At above 0.55 probability level, there was no rainfall after 30th week and it may not be possible to replenish soil moisture in the soils with low water holding capacity. If green manuring crop is harvested early and spread on the surface, it may function as mulch and may reduce evaporation losses from the soil to some extent. Crop planning for Rabi (winter) season: 
During the winter season (31st week onwards), negligible rainfall is recorded at 0.55 probability level. So the surface soil would become dry with rare chances of getting adequate soil-moisture in the seeding zone. Hence, surface moisture conservation would be essential for germination of seed and plant establishment and, if possible, water harvesting should be done to ensure a pre-sowing irrigation. It was also revealed that the rabi crops have to be raised under moisture stress conditions. The crops should be able to use residual soil profile moisture more judiciously as reliability of getting adequate weekly rainfall is low. If irrigation facilities are available, then early sown varieties may be grown with the application of pre- sowing irrigation.
C. R. Subudhi et al Int. Journal of Engineering Research and Applications www.ijera.com 
ISSN : 2248-9622, Vol. 4, Issue 9( Version 1), September 2014, pp.139-145 
www.ijera.com 145 | P a g e 
24 28 32 36 40 44 48 52 
Category 1 
Category 2 
Category 3 
Category 4 
Category 5 
Category 6 
Category 7 
Rice(S) Mustard 
Pigeon Pea Mustard 
Rice(S) HorseGram 
Ground Nut Mustard 
Rice(S) Radish 
Rice (M) Mustard 
Rice (L) Radis 
h 
Fig I Different cropping patterns for Kandhamal district 
Table 4 shows results obtained from Markov chain analysis 
REFERENCES 
[1] Pandarinath N. 1991. Markov Chain Model 
probability of dry and wet weeks during 
monsoon period over Andhra Pradesh. 
Mausam 42 (4) : 393--400. 
[2] Pradhan P.C, Senapati P.C and Subudhi C.R 
1998. Crop plans based on frequencies of 
dry and wet spells at Daringibadi block of 
Kandhamal district. Indian Journal of 
Agricultural Science 345-9. 
[3] Panigrahi, B., 1998. Probability analysis of 
short duration rainfall for crop planning in 
coastal Orissa. Indian J. Soil Cons. 26(2): 
178-182. 
[4] Sharda, V.N. and Das, P.K. 2005. Modeling 
weekly rainfall data for crop planning in a 
sub-humid climate of India. Agricultural 
Water Management.76:120-138 
Month nd ndd Pd Pdd Pd2 Pd3 nw nww Pw Pww Pw2 Pw3 
Jan 41 39 98 95 93 86 1 0 2.4 0 0.0 0.0 
Feb 41 39 98 95 90 84 1 0 2.4 0 0.0 0.0 
March 40 37 95 93 88 67 2 0 4.8 0 0.0 0.0 
April 40 37 95 93 72 0 2 0 4.8 0 0.5 0.4 
May 33 25 79 76 0 0 9 1 21.4 11 17.3 9.1 
June 6 0 14 0 0 0 36 29 85.7 81 83.7 72.7 
July 0 0 0 0 0 0 42 41 100.0 98 97.6 38.7 
Aug 0 0 0 0 0 0 42 41 100.0 98 92.5 41.6 
Sept 2 0 5 0 2 0 40 37 95.2 93 42.9 6.1 
Oct 22 11 52 50 42 0 20 9 47.6 45 42.9 0.0 
Nov 35 28 83 80 81 7 1 16.7 14 0.0 
Dec 42 41 100 98 0 0 0.0 0 
WEEKS (SMW)

More Related Content

Viewers also liked

Viewers also liked (17)

Resolución
ResoluciónResolución
Resolución
 
Ena i santi
Ena i santiEna i santi
Ena i santi
 
Historia de la tecnologia
Historia de la tecnologiaHistoria de la tecnologia
Historia de la tecnologia
 
Lineamientos políticos en nee
Lineamientos políticos en neeLineamientos políticos en nee
Lineamientos políticos en nee
 
tejeRedes. Metodologias tejeredes para desarrolar
tejeRedes. Metodologias tejeredes para desarrolartejeRedes. Metodologias tejeredes para desarrolar
tejeRedes. Metodologias tejeredes para desarrolar
 
Power Quality Improvement at Distribution Level for Grid Connected Renewable ...
Power Quality Improvement at Distribution Level for Grid Connected Renewable ...Power Quality Improvement at Distribution Level for Grid Connected Renewable ...
Power Quality Improvement at Distribution Level for Grid Connected Renewable ...
 
Limitación auditiva
Limitación auditivaLimitación auditiva
Limitación auditiva
 
Procesos aplicados al desarrollo de software
Procesos aplicados al desarrollo de softwareProcesos aplicados al desarrollo de software
Procesos aplicados al desarrollo de software
 
.Tecnologiaseducativas
.Tecnologiaseducativas.Tecnologiaseducativas
.Tecnologiaseducativas
 
1
11
1
 
Miniaturk Istanbul
Miniaturk  IstanbulMiniaturk  Istanbul
Miniaturk Istanbul
 
Mundial
MundialMundial
Mundial
 
Convenio de locales de espectáculos y deportes
Convenio de locales de espectáculos y deportesConvenio de locales de espectáculos y deportes
Convenio de locales de espectáculos y deportes
 
Subjetividad y sujetos sociales.do c (1 a torres)
Subjetividad y sujetos sociales.do c (1 a torres)Subjetividad y sujetos sociales.do c (1 a torres)
Subjetividad y sujetos sociales.do c (1 a torres)
 
Primer taller ami 2010
Primer taller ami 2010Primer taller ami 2010
Primer taller ami 2010
 
A química dos alimentos famasul
A química dos alimentos famasulA química dos alimentos famasul
A química dos alimentos famasul
 
Webquest
WebquestWebquest
Webquest
 

Similar to Weekly Rainfall Analysis for Crop Planning Using Markov’s Chain Model for Kandhamal District of Odisha, India

Derivation Of Intensity Duration Frequency Curves Using Short Duration Rainfa...
Derivation Of Intensity Duration Frequency Curves Using Short Duration Rainfa...Derivation Of Intensity Duration Frequency Curves Using Short Duration Rainfa...
Derivation Of Intensity Duration Frequency Curves Using Short Duration Rainfa...Mohammed Badiuddin Parvez
 
Rekayasa hidrologi pertemuan 2
Rekayasa hidrologi pertemuan 2Rekayasa hidrologi pertemuan 2
Rekayasa hidrologi pertemuan 2Aswar Amiruddin
 
Modelling monthly rainfall time series using Markov Chains
Modelling monthly rainfall time series using Markov ChainsModelling monthly rainfall time series using Markov Chains
Modelling monthly rainfall time series using Markov ChainsAmro Elfeki
 
Estimation of clearness index from different meteorological parameters in IRAQ
Estimation of clearness index from different meteorological parameters in IRAQEstimation of clearness index from different meteorological parameters in IRAQ
Estimation of clearness index from different meteorological parameters in IRAQIOSR Journals
 
Generation of intensity_duration_frequency_curves_for manvi taluk raichur dis...
Generation of intensity_duration_frequency_curves_for manvi taluk raichur dis...Generation of intensity_duration_frequency_curves_for manvi taluk raichur dis...
Generation of intensity_duration_frequency_curves_for manvi taluk raichur dis...Mohammed Badiuddin Parvez
 
IJERD (www.ijerd.com) International Journal of Engineering Research and Devel...
IJERD (www.ijerd.com) International Journal of Engineering Research and Devel...IJERD (www.ijerd.com) International Journal of Engineering Research and Devel...
IJERD (www.ijerd.com) International Journal of Engineering Research and Devel...IJERD Editor
 
International Journal of Engineering and Science Invention (IJESI)
International Journal of Engineering and Science Invention (IJESI)International Journal of Engineering and Science Invention (IJESI)
International Journal of Engineering and Science Invention (IJESI)inventionjournals
 
Modeling Monthly Rainfall Records in Arid Zones Using Markov Chains: Saudi Ar...
Modeling Monthly Rainfall Records in Arid Zones Using Markov Chains: Saudi Ar...Modeling Monthly Rainfall Records in Arid Zones Using Markov Chains: Saudi Ar...
Modeling Monthly Rainfall Records in Arid Zones Using Markov Chains: Saudi Ar...Amro Elfeki
 
Analysis of Annual Rainfall Climate Variability in Saudi Arabia by Using Spec...
Analysis of Annual Rainfall Climate Variability in Saudi Arabia by Using Spec...Analysis of Annual Rainfall Climate Variability in Saudi Arabia by Using Spec...
Analysis of Annual Rainfall Climate Variability in Saudi Arabia by Using Spec...Amro Elfeki
 
Seasonal modeling in time series with R
Seasonal modeling in time series with RSeasonal modeling in time series with R
Seasonal modeling in time series with Rmahmuda27
 
ANNUAL PRECIPITATION IN SOUTHERN OF MADAGASCAR: MODELING USING HIGH ORDER FUZ...
ANNUAL PRECIPITATION IN SOUTHERN OF MADAGASCAR: MODELING USING HIGH ORDER FUZ...ANNUAL PRECIPITATION IN SOUTHERN OF MADAGASCAR: MODELING USING HIGH ORDER FUZ...
ANNUAL PRECIPITATION IN SOUTHERN OF MADAGASCAR: MODELING USING HIGH ORDER FUZ...ijfls
 
Presentation on risk perception and safety analysis of petroleum production s...
Presentation on risk perception and safety analysis of petroleum production s...Presentation on risk perception and safety analysis of petroleum production s...
Presentation on risk perception and safety analysis of petroleum production s...Numan Hossain
 
Assessment of solar_potential_rooftops_by_using_gis_and_remote_sensing_techni...
Assessment of solar_potential_rooftops_by_using_gis_and_remote_sensing_techni...Assessment of solar_potential_rooftops_by_using_gis_and_remote_sensing_techni...
Assessment of solar_potential_rooftops_by_using_gis_and_remote_sensing_techni...Sabaragamuwa University of Sri Lanka
 

Similar to Weekly Rainfall Analysis for Crop Planning Using Markov’s Chain Model for Kandhamal District of Odisha, India (20)

Derivation Of Intensity Duration Frequency Curves Using Short Duration Rainfa...
Derivation Of Intensity Duration Frequency Curves Using Short Duration Rainfa...Derivation Of Intensity Duration Frequency Curves Using Short Duration Rainfa...
Derivation Of Intensity Duration Frequency Curves Using Short Duration Rainfa...
 
Rekayasa hidrologi pertemuan 2
Rekayasa hidrologi pertemuan 2Rekayasa hidrologi pertemuan 2
Rekayasa hidrologi pertemuan 2
 
3 ijsrmss-02686-paid
3 ijsrmss-02686-paid3 ijsrmss-02686-paid
3 ijsrmss-02686-paid
 
Modelling monthly rainfall time series using Markov Chains
Modelling monthly rainfall time series using Markov ChainsModelling monthly rainfall time series using Markov Chains
Modelling monthly rainfall time series using Markov Chains
 
16 ijsrms-02614 (1)
16 ijsrms-02614 (1)16 ijsrms-02614 (1)
16 ijsrms-02614 (1)
 
Multi criteria decision-making-analysis
Multi criteria decision-making-analysisMulti criteria decision-making-analysis
Multi criteria decision-making-analysis
 
Estimation of clearness index from different meteorological parameters in IRAQ
Estimation of clearness index from different meteorological parameters in IRAQEstimation of clearness index from different meteorological parameters in IRAQ
Estimation of clearness index from different meteorological parameters in IRAQ
 
Generation of intensity_duration_frequency_curves_for manvi taluk raichur dis...
Generation of intensity_duration_frequency_curves_for manvi taluk raichur dis...Generation of intensity_duration_frequency_curves_for manvi taluk raichur dis...
Generation of intensity_duration_frequency_curves_for manvi taluk raichur dis...
 
IJERD (www.ijerd.com) International Journal of Engineering Research and Devel...
IJERD (www.ijerd.com) International Journal of Engineering Research and Devel...IJERD (www.ijerd.com) International Journal of Engineering Research and Devel...
IJERD (www.ijerd.com) International Journal of Engineering Research and Devel...
 
International Journal of Engineering and Science Invention (IJESI)
International Journal of Engineering and Science Invention (IJESI)International Journal of Engineering and Science Invention (IJESI)
International Journal of Engineering and Science Invention (IJESI)
 
Informe final riegos i
Informe final riegos iInforme final riegos i
Informe final riegos i
 
Modeling Monthly Rainfall Records in Arid Zones Using Markov Chains: Saudi Ar...
Modeling Monthly Rainfall Records in Arid Zones Using Markov Chains: Saudi Ar...Modeling Monthly Rainfall Records in Arid Zones Using Markov Chains: Saudi Ar...
Modeling Monthly Rainfall Records in Arid Zones Using Markov Chains: Saudi Ar...
 
Analysis of Annual Rainfall Climate Variability in Saudi Arabia by Using Spec...
Analysis of Annual Rainfall Climate Variability in Saudi Arabia by Using Spec...Analysis of Annual Rainfall Climate Variability in Saudi Arabia by Using Spec...
Analysis of Annual Rainfall Climate Variability in Saudi Arabia by Using Spec...
 
Seasonal modeling in time series with R
Seasonal modeling in time series with RSeasonal modeling in time series with R
Seasonal modeling in time series with R
 
Ft3510171021
Ft3510171021Ft3510171021
Ft3510171021
 
ANNUAL PRECIPITATION IN SOUTHERN OF MADAGASCAR: MODELING USING HIGH ORDER FUZ...
ANNUAL PRECIPITATION IN SOUTHERN OF MADAGASCAR: MODELING USING HIGH ORDER FUZ...ANNUAL PRECIPITATION IN SOUTHERN OF MADAGASCAR: MODELING USING HIGH ORDER FUZ...
ANNUAL PRECIPITATION IN SOUTHERN OF MADAGASCAR: MODELING USING HIGH ORDER FUZ...
 
Presentation on risk perception and safety analysis of petroleum production s...
Presentation on risk perception and safety analysis of petroleum production s...Presentation on risk perception and safety analysis of petroleum production s...
Presentation on risk perception and safety analysis of petroleum production s...
 
1 Survey Report_Riska_230717.pptx
1 Survey Report_Riska_230717.pptx1 Survey Report_Riska_230717.pptx
1 Survey Report_Riska_230717.pptx
 
F04414145
F04414145F04414145
F04414145
 
Assessment of solar_potential_rooftops_by_using_gis_and_remote_sensing_techni...
Assessment of solar_potential_rooftops_by_using_gis_and_remote_sensing_techni...Assessment of solar_potential_rooftops_by_using_gis_and_remote_sensing_techni...
Assessment of solar_potential_rooftops_by_using_gis_and_remote_sensing_techni...
 

Recently uploaded

SPICE PARK APR2024 ( 6,793 SPICE Models )
SPICE PARK APR2024 ( 6,793 SPICE Models )SPICE PARK APR2024 ( 6,793 SPICE Models )
SPICE PARK APR2024 ( 6,793 SPICE Models )Tsuyoshi Horigome
 
High Profile Call Girls Nagpur Meera Call 7001035870 Meet With Nagpur Escorts
High Profile Call Girls Nagpur Meera Call 7001035870 Meet With Nagpur EscortsHigh Profile Call Girls Nagpur Meera Call 7001035870 Meet With Nagpur Escorts
High Profile Call Girls Nagpur Meera Call 7001035870 Meet With Nagpur EscortsCall Girls in Nagpur High Profile
 
Software Development Life Cycle By Team Orange (Dept. of Pharmacy)
Software Development Life Cycle By  Team Orange (Dept. of Pharmacy)Software Development Life Cycle By  Team Orange (Dept. of Pharmacy)
Software Development Life Cycle By Team Orange (Dept. of Pharmacy)Suman Mia
 
(MEERA) Dapodi Call Girls Just Call 7001035870 [ Cash on Delivery ] Pune Escorts
(MEERA) Dapodi Call Girls Just Call 7001035870 [ Cash on Delivery ] Pune Escorts(MEERA) Dapodi Call Girls Just Call 7001035870 [ Cash on Delivery ] Pune Escorts
(MEERA) Dapodi Call Girls Just Call 7001035870 [ Cash on Delivery ] Pune Escortsranjana rawat
 
(ANJALI) Dange Chowk Call Girls Just Call 7001035870 [ Cash on Delivery ] Pun...
(ANJALI) Dange Chowk Call Girls Just Call 7001035870 [ Cash on Delivery ] Pun...(ANJALI) Dange Chowk Call Girls Just Call 7001035870 [ Cash on Delivery ] Pun...
(ANJALI) Dange Chowk Call Girls Just Call 7001035870 [ Cash on Delivery ] Pun...ranjana rawat
 
Current Transformer Drawing and GTP for MSETCL
Current Transformer Drawing and GTP for MSETCLCurrent Transformer Drawing and GTP for MSETCL
Current Transformer Drawing and GTP for MSETCLDeelipZope
 
High Profile Call Girls Nashik Megha 7001305949 Independent Escort Service Na...
High Profile Call Girls Nashik Megha 7001305949 Independent Escort Service Na...High Profile Call Girls Nashik Megha 7001305949 Independent Escort Service Na...
High Profile Call Girls Nashik Megha 7001305949 Independent Escort Service Na...Call Girls in Nagpur High Profile
 
Sheet Pile Wall Design and Construction: A Practical Guide for Civil Engineer...
Sheet Pile Wall Design and Construction: A Practical Guide for Civil Engineer...Sheet Pile Wall Design and Construction: A Practical Guide for Civil Engineer...
Sheet Pile Wall Design and Construction: A Practical Guide for Civil Engineer...Dr.Costas Sachpazis
 
(ANVI) Koregaon Park Call Girls Just Call 7001035870 [ Cash on Delivery ] Pun...
(ANVI) Koregaon Park Call Girls Just Call 7001035870 [ Cash on Delivery ] Pun...(ANVI) Koregaon Park Call Girls Just Call 7001035870 [ Cash on Delivery ] Pun...
(ANVI) Koregaon Park Call Girls Just Call 7001035870 [ Cash on Delivery ] Pun...ranjana rawat
 
Internship report on mechanical engineering
Internship report on mechanical engineeringInternship report on mechanical engineering
Internship report on mechanical engineeringmalavadedarshan25
 
IVE Industry Focused Event - Defence Sector 2024
IVE Industry Focused Event - Defence Sector 2024IVE Industry Focused Event - Defence Sector 2024
IVE Industry Focused Event - Defence Sector 2024Mark Billinghurst
 
Decoding Kotlin - Your guide to solving the mysterious in Kotlin.pptx
Decoding Kotlin - Your guide to solving the mysterious in Kotlin.pptxDecoding Kotlin - Your guide to solving the mysterious in Kotlin.pptx
Decoding Kotlin - Your guide to solving the mysterious in Kotlin.pptxJoão Esperancinha
 
Porous Ceramics seminar and technical writing
Porous Ceramics seminar and technical writingPorous Ceramics seminar and technical writing
Porous Ceramics seminar and technical writingrakeshbaidya232001
 
IMPLICATIONS OF THE ABOVE HOLISTIC UNDERSTANDING OF HARMONY ON PROFESSIONAL E...
IMPLICATIONS OF THE ABOVE HOLISTIC UNDERSTANDING OF HARMONY ON PROFESSIONAL E...IMPLICATIONS OF THE ABOVE HOLISTIC UNDERSTANDING OF HARMONY ON PROFESSIONAL E...
IMPLICATIONS OF THE ABOVE HOLISTIC UNDERSTANDING OF HARMONY ON PROFESSIONAL E...RajaP95
 
VIP Call Girls Service Hitech City Hyderabad Call +91-8250192130
VIP Call Girls Service Hitech City Hyderabad Call +91-8250192130VIP Call Girls Service Hitech City Hyderabad Call +91-8250192130
VIP Call Girls Service Hitech City Hyderabad Call +91-8250192130Suhani Kapoor
 
Introduction and different types of Ethernet.pptx
Introduction and different types of Ethernet.pptxIntroduction and different types of Ethernet.pptx
Introduction and different types of Ethernet.pptxupamatechverse
 
GDSC ASEB Gen AI study jams presentation
GDSC ASEB Gen AI study jams presentationGDSC ASEB Gen AI study jams presentation
GDSC ASEB Gen AI study jams presentationGDSCAESB
 
MANUFACTURING PROCESS-II UNIT-2 LATHE MACHINE
MANUFACTURING PROCESS-II UNIT-2 LATHE MACHINEMANUFACTURING PROCESS-II UNIT-2 LATHE MACHINE
MANUFACTURING PROCESS-II UNIT-2 LATHE MACHINESIVASHANKAR N
 

Recently uploaded (20)

DJARUM4D - SLOT GACOR ONLINE | SLOT DEMO ONLINE
DJARUM4D - SLOT GACOR ONLINE | SLOT DEMO ONLINEDJARUM4D - SLOT GACOR ONLINE | SLOT DEMO ONLINE
DJARUM4D - SLOT GACOR ONLINE | SLOT DEMO ONLINE
 
SPICE PARK APR2024 ( 6,793 SPICE Models )
SPICE PARK APR2024 ( 6,793 SPICE Models )SPICE PARK APR2024 ( 6,793 SPICE Models )
SPICE PARK APR2024 ( 6,793 SPICE Models )
 
High Profile Call Girls Nagpur Meera Call 7001035870 Meet With Nagpur Escorts
High Profile Call Girls Nagpur Meera Call 7001035870 Meet With Nagpur EscortsHigh Profile Call Girls Nagpur Meera Call 7001035870 Meet With Nagpur Escorts
High Profile Call Girls Nagpur Meera Call 7001035870 Meet With Nagpur Escorts
 
Software Development Life Cycle By Team Orange (Dept. of Pharmacy)
Software Development Life Cycle By  Team Orange (Dept. of Pharmacy)Software Development Life Cycle By  Team Orange (Dept. of Pharmacy)
Software Development Life Cycle By Team Orange (Dept. of Pharmacy)
 
(MEERA) Dapodi Call Girls Just Call 7001035870 [ Cash on Delivery ] Pune Escorts
(MEERA) Dapodi Call Girls Just Call 7001035870 [ Cash on Delivery ] Pune Escorts(MEERA) Dapodi Call Girls Just Call 7001035870 [ Cash on Delivery ] Pune Escorts
(MEERA) Dapodi Call Girls Just Call 7001035870 [ Cash on Delivery ] Pune Escorts
 
(ANJALI) Dange Chowk Call Girls Just Call 7001035870 [ Cash on Delivery ] Pun...
(ANJALI) Dange Chowk Call Girls Just Call 7001035870 [ Cash on Delivery ] Pun...(ANJALI) Dange Chowk Call Girls Just Call 7001035870 [ Cash on Delivery ] Pun...
(ANJALI) Dange Chowk Call Girls Just Call 7001035870 [ Cash on Delivery ] Pun...
 
Current Transformer Drawing and GTP for MSETCL
Current Transformer Drawing and GTP for MSETCLCurrent Transformer Drawing and GTP for MSETCL
Current Transformer Drawing and GTP for MSETCL
 
High Profile Call Girls Nashik Megha 7001305949 Independent Escort Service Na...
High Profile Call Girls Nashik Megha 7001305949 Independent Escort Service Na...High Profile Call Girls Nashik Megha 7001305949 Independent Escort Service Na...
High Profile Call Girls Nashik Megha 7001305949 Independent Escort Service Na...
 
Sheet Pile Wall Design and Construction: A Practical Guide for Civil Engineer...
Sheet Pile Wall Design and Construction: A Practical Guide for Civil Engineer...Sheet Pile Wall Design and Construction: A Practical Guide for Civil Engineer...
Sheet Pile Wall Design and Construction: A Practical Guide for Civil Engineer...
 
(ANVI) Koregaon Park Call Girls Just Call 7001035870 [ Cash on Delivery ] Pun...
(ANVI) Koregaon Park Call Girls Just Call 7001035870 [ Cash on Delivery ] Pun...(ANVI) Koregaon Park Call Girls Just Call 7001035870 [ Cash on Delivery ] Pun...
(ANVI) Koregaon Park Call Girls Just Call 7001035870 [ Cash on Delivery ] Pun...
 
Internship report on mechanical engineering
Internship report on mechanical engineeringInternship report on mechanical engineering
Internship report on mechanical engineering
 
IVE Industry Focused Event - Defence Sector 2024
IVE Industry Focused Event - Defence Sector 2024IVE Industry Focused Event - Defence Sector 2024
IVE Industry Focused Event - Defence Sector 2024
 
Decoding Kotlin - Your guide to solving the mysterious in Kotlin.pptx
Decoding Kotlin - Your guide to solving the mysterious in Kotlin.pptxDecoding Kotlin - Your guide to solving the mysterious in Kotlin.pptx
Decoding Kotlin - Your guide to solving the mysterious in Kotlin.pptx
 
Porous Ceramics seminar and technical writing
Porous Ceramics seminar and technical writingPorous Ceramics seminar and technical writing
Porous Ceramics seminar and technical writing
 
IMPLICATIONS OF THE ABOVE HOLISTIC UNDERSTANDING OF HARMONY ON PROFESSIONAL E...
IMPLICATIONS OF THE ABOVE HOLISTIC UNDERSTANDING OF HARMONY ON PROFESSIONAL E...IMPLICATIONS OF THE ABOVE HOLISTIC UNDERSTANDING OF HARMONY ON PROFESSIONAL E...
IMPLICATIONS OF THE ABOVE HOLISTIC UNDERSTANDING OF HARMONY ON PROFESSIONAL E...
 
VIP Call Girls Service Hitech City Hyderabad Call +91-8250192130
VIP Call Girls Service Hitech City Hyderabad Call +91-8250192130VIP Call Girls Service Hitech City Hyderabad Call +91-8250192130
VIP Call Girls Service Hitech City Hyderabad Call +91-8250192130
 
Call Us -/9953056974- Call Girls In Vikaspuri-/- Delhi NCR
Call Us -/9953056974- Call Girls In Vikaspuri-/- Delhi NCRCall Us -/9953056974- Call Girls In Vikaspuri-/- Delhi NCR
Call Us -/9953056974- Call Girls In Vikaspuri-/- Delhi NCR
 
Introduction and different types of Ethernet.pptx
Introduction and different types of Ethernet.pptxIntroduction and different types of Ethernet.pptx
Introduction and different types of Ethernet.pptx
 
GDSC ASEB Gen AI study jams presentation
GDSC ASEB Gen AI study jams presentationGDSC ASEB Gen AI study jams presentation
GDSC ASEB Gen AI study jams presentation
 
MANUFACTURING PROCESS-II UNIT-2 LATHE MACHINE
MANUFACTURING PROCESS-II UNIT-2 LATHE MACHINEMANUFACTURING PROCESS-II UNIT-2 LATHE MACHINE
MANUFACTURING PROCESS-II UNIT-2 LATHE MACHINE
 

Weekly Rainfall Analysis for Crop Planning Using Markov’s Chain Model for Kandhamal District of Odisha, India

  • 1. C. R. Subudhi et al Int. Journal of Engineering Research and Applications www.ijera.com ISSN : 2248-9622, Vol. 4, Issue 9( Version 1), September 2014, pp.139-145 www.ijera.com 139 | P a g e Weekly Rainfall Analysis for Crop Planning Using Markov’s Chain Model for Kandhamal District of Odisha, India S. K. Kar1, D. P. Sahoo2, C. R. Subudhi3 1 & 2 B. Tech Students of C.A.E.T, 3Associate Prof. Dept. of SWCE C.A.E.T Orissa University of Agriculture & Technology, Bhubaneswar, Odisha ABSTRACT Weekly rainfall analysis of Kandhamal district during the period of 1965 to 2010 were taken for analysis purpose, the analysis is very much important for crop planning and analyzing the probability of occurrence of dry and wet periods. This will act as bench mark for crop planning as well as sustainable agricultural management of Kandhamal district which comes under the agro-climatic zone of East-coast hill region. Markov chain model has been utilized to derive the probability of dry or wet weeks and also forward and backward accumulation of rain water suitable for crop production. This analysis can be helpful to find out different cropping system including intercropping and sequence cropping suitable during that period. Key words : Markov chain, dry spell, wet spell, weekly, rainfall I. INTRODUCTION Phulbani is located at 20.47°N 84.23°E. It has an average elevation of 485 meters in the North Eastern Ghat zone. The geographical area of the Kandhamal district is 7654 sq.km. 76.4 % of this area is coming under forest. According to 2011 census the population of Kandhamal is 7,33,110, rural population is around 93 %. Among of total population 15 % are Scheduled caste and 54 % are Scheduled tribe. So this district is a tribal dominated and rural dominated district, so Agriculture development needs important for development and increase per capita income of the people of the district. So proper crop planning and time of sowing and harvesting will increase their crop yield, for further development of the district and state. So following rainfall models were tried to find out the crop planning. Markov chain probability model has been used extensively to find the long-term frequency behaviour of wet and dry weather spells (Victor and Sastri 1979). Another aspect of crop planning is backward and forward accumulation of rainfall to determine the onset and termination of wet season based on precipitation data. A number of studies have been conducted for location specific agricultural planning in general and crop planning in particular by analyzing daily, weekly, monthly, seasonal and annual rainfall data. Stern and Coe (1982) analyzed daily rainfall data for crop planning in semi-arid, tropics. Similar analysis of rainfall data has been done for crop planning in coastal, semi-arid, dry farming, sub-humid and Himalayan foothill regions, Panigrahi(1998); Sharda and Das (2005). Farmer's cropping strategies are greatly influenced by the variability of the onset and termination of rainy season. Accumulation of 75 mm rainfall has been considered as the onset time for growing season for dry-seeded crops in sandy loam soil and 200 mm accumulated rainfall for initiation of paddling i.e. transplanting of rice (Oryza sativa L.). Similarly end of wet season is determined by backward summing of rainfall data. It is considered that 500 mm and 300 mm accumulated values represent the week after which sufficient rain would be expected to sustain a second rice crop or other short duration field crops assuming a fully charge soil profile at planning (WMO 1982). II. MATERIALS AND METHODS Daily rainfall data for 30 years (1981-2010) were collected from rain gauge stations Khurda (18°46'N to 20°95' N latitude, 83°48'E to 87°46' E longitude and 42 m altitude). The standard 7 day period (weekly) has been taken to establish the dry and wet spell frequency based on Markov Chain Model considering a week receiving rainfall less than 20mm as a dry period and 20 mm or more as a wet period. The different notations followed in this analysis are given below: f(Pd)= …(1) where f (Pd) probability of the period considered being dry , nd number of dry periods observed, yn number of years of data used. f(Pdd)= …(2) RESEARCH ARTICLE OPEN ACCESS
  • 2. C. R. Subudhi et al Int. Journal of Engineering Research and Applications www.ijera.com ISSN : 2248-9622, Vol. 4, Issue 9( Version 1), September 2014, pp.139-145 www.ijera.com 140 | P a g e Where f (Pdd), probability of dry period preceded by another dry period (conditional) and ndd , number of dry period preceded by another dry period. f(Pd2)=f(Pd)f'(Pd) …(3) where f(Pd2),probability of 2 consecutive dry period; f(Pd) , probability of the period being dry (1st period) and f'(Pd),probability of 2nd consecutive dry period, given the preceding period being dry. f(Pd3)=f(Pd) f''(Pd) …(4) where f(Pd3), probability of 3 consecutive dry period; and f''(Pd)probability of 3rd being dry given the preceding period dry. f(Pw)= …(5) where f(Pw), probability of the period considered being wet and number of wet periods observed. The f(P ww), f(P w2) and f(P w3) have been estimated in the same manner as f(Pdd), f(Pd2) and f(Pd3) and the notations used are having the same meaning except the period being wet. Using the above formulas, probabilities of dry weeks and wet weeks; conditional probabilities of dry weeks preceded by dry weeks and wet weeks preceded by wet weeks and probability of consecutive 2 and 3 dry or wet weeks starting with weeks dry or wet have been estimated. For the calculation of forward and backward accumulation, weekly rainfalls are arranged in column and the year in rows. For calculation of forward accumulation 22nd week has been considered as the starting period due to start of monsoon rain. The rainfalls are added week wise from 22nd week onwards to find the corresponding week number in which the cumulative rainfall has reached a sum total of 75 mm and 200 mm. Similarly, week -wise rainfalls are added backward from 52nd week (52nd week + 51st week + . ... ) to get 100 mm, 300 mm and 500 mm total and the corresponding week numbers are noted. Then the years are assigned with rank number, i.e. 1981-2010 as 1 to 30. The probability of each rank is calculated by the simple statistical formula. f(P)= …(6) Where f(P), probability (%); Rn, rank number and yn, number of years of observation . For forward accumulation the rank order and probability level are arranged in ascending order and the corresponding week numbers are arranged in the same manner. Similarly, for backward accumulation the rank order and probability level are arranged in descending order and the corresponding week number for 500 mm, 300 mm and 100 mm respectively are arranged in ascending order. Table1 Analysis of weekly rainfall pattern Initial Probability(%) Conditional probability(%) SMW PD PW PDD PWD PWW PDW 1 96.2 3.7 92.3 7.7 0 100 2 92.5 7.4 80 20 0 100 3 96.2 7.0 84.6 15.4 0 100 4 96.2 3.7 92.3 8 0 100 5 92.5 11.1 92 8 50 50 6 96.2 3.7 92.3 8 0 100 7 85.1 14.8 82.3 17.7 25 75 8 100 0 96.2 3.8 0 100 9 96.2 3.7 92.3 8 0 100 10 96.2 3.7 92.3 8 0 100 11 96.2 3.7 92.3 8 0 100 12 100 0 96.2 3.8 0 100 13 85.1 14.8 78.2 21.3 25 75 14 85.1 14.8 82.6 17.4 0 100 15 96.2 3.7 92.3 8 0 100 16 88.8 11.1 83.3 16.7 0 100 17 81.4 18.5 81.8 18.2 40 60 18 85.1 14.8 82.6 17.4 25 75
  • 3. C. R. Subudhi et al Int. Journal of Engineering Research and Applications www.ijera.com ISSN : 2248-9622, Vol. 4, Issue 9( Version 1), September 2014, pp.139-145 www.ijera.com 141 | P a g e 19 85.1 14.8 78.2 21.8 0 100 20 81.4 18.5 77.2 22.3 20 80 21 77.7 22.2 76.1 23.9 16 84 22 66.6 33.3 72.2 27.8 44 56 23 59.2 40.7 69.5 30.5 36 64 24 33.3 66.6 55.5 44.5 72 28 25 33.3 66.6 11.1 88.9 77 23 26 22.2 77.7 16.6 83.4 76 24 27 11.1 88.8 0 100 83 17 28 22.2 77.7 33.3 66.7 90 10 29 11.1 88.8 0 100 83 17 30 14.8 85.1 0 100 78 22 31 14.8 85.1 0 100 78 22 32 11.1 88.8 0 100 83 17 33 25.9 74 14.2 85.8 65 35 34 22.2 77.7 16.6 83.4 80 20 35 14.8 85.1 25 75 86 14 36 22.2 77.7 0 100 71 29 37 18.5 81.4 0 100 72 28 38 22.2 77.7 0 100 71 29 39 37 62.9 20 80 64 36 40 55.5 44.4 46.6 53.4 41 59 41 59.2 33.3 75 25 44 56 42 51.8 48.1 42.8 57.2 38 62 43 92.5 74 88 12 0 100 44 88.8 111 87.5 12.5 33 67 45 81.4 185 77.2 22.8 0 100 46 88.8 111 87.5 12.5 33.3 67 47 96.2 3.7 92.3 7.7 0 100 48 100 0 96.2 3.8 0 100 49 96.2 3.7 96.1 3.9 0 100 50 96.2 3.7 92.3 7.7 0 100 51 96.2 3.7 84.6 15.4 0 100 52 100 0 96.2 3.8 0 100
  • 4. C. R. Subudhi et al Int. Journal of Engineering Research and Applications www.ijera.com ISSN : 2248-9622, Vol. 4, Issue 9( Version 1), September 2014, pp.139-145 www.ijera.com 142 | P a g e Table.2 Consecutive dry probability and consecutive wet probability of Phulbani block Consecutive dry probability Consecutive wet probability SMW 2D 3D 2W 3W 1 88.7 85.0 0 0 2 74 70.3 0 0 3 81.3 81.3 0 0 4 88.7 73.9 0 0 5 85.1 77.6 5.55 0 6 88.7 77.6 0 0 7 70.0 58.9 3.7 0 8 96.2 88.7 0 0 9 88.7 70.2 0 0 10 88.7 85.0 0 0 11 88.7 85.0 0 0 12 96.2 92.4 0 0 13 66.5 55.4 3.7 0 14 70.2 59.1 0 0 15 88.7 81.3 0 0 16 73.9 59.1 0 0 17 66.5 48.0 7.4 3.7 18 70.2 51.7 3.7 0 19 66.5 48.0 0 0 20 62.8 48.0 3.7 0 21 59.1 40.6 3.552 0 22 48.0 25.8 14.652 7.3 23 41.1 30.8 14.652 3.6 24 18.4 0 47.952 33.1 25 3.6 0 51.282 36.6 26 3.6 0 59.052 47.9 27 0 0 73.704 58.9 28 7.3 0 69.93 51.4 29 0 0 73.704 70.0 30 0 0 66.378 58.9 31 0 0 66.378 51.5 32 0 0 73.704 58.9 33 3.6 0 48.1 33.2 34 3.6 0 62.16 36.5 35 3.7 0 73.186 62.2 36 0 0 55.167 40.4 37 0 0 58.608 32.9 38 0 0 55.167 40.4 39 7.4 0 40.256 21.9 40 25.8 7.3 18.204 3.6 41 44.4 29.5 14.652 7.3 42 22.1 22.1 18.278 10.9 43 81.4 70.2 0 0 44 77.7 59.1 3.663 0 45 62.8 36.9 0 0 46 77.7 59.1 3.6963 0 47 88.7 73.9 0 0 48 96.2 85.0 0 0 49 92.4 85.0 0 0 50 88.7 81.3 0 0 51 81.3 70.2 0 0 52 96.2 92.4 0 0
  • 5. C. R. Subudhi et al Int. Journal of Engineering Research and Applications www.ijera.com ISSN : 2248-9622, Vol. 4, Issue 9( Version 1), September 2014, pp.139-145 www.ijera.com 143 | P a g e Table 3 Weekly rainfall pattern at Kandhamal district of Odisha SMW Mean Max Min SD CV 1 1.2 30.3 0 5.8 458.5 2 4.6 78 0 15.5 0.77 3 20.1 59 0 11.7 58.1 4 39.2 61.8 0 12.3 31.3 5 11.4 38 0 11.9 72.5 6 16.7 35 0 12.5 42.0 7 10.3 66.9 0 8.4 147.5 8 9.2 13 0 7.1 31.6 9 13.8 44 0 15.5 69.6 10 8.3 23 0 2.9 63.3 11 10.4 29 0 9.8 57.5 12 9.1 15 0 5.4 63.1 13 9.0 56 0 6.0 168.8 14 9.9 70 0 5.8 185.0 15 11.8 27 0 15.5 51.5 16 15.8 33 0 18.6 56.1 17 9.8 38 0 6.2 145.9 18 11.6 64 0 9.0 156.2 19 12.8 146 0 14.5 290.4 20 17.8 101 0 18.5 166.7 21 20.3 100.2 0 38.1 128.1 22 19.2 122 0 30.2 127.1 23 16.9 137.6 0 20.3 214.0 24 45.7 235 0 33.4 165.7 25 32.2 116 0 46.1 218.8 26 55.1 359.6 0 65.6 127.4 27 48.2 429 0 54.8 193.4 28 79.7 401 0 70.6 117.4 29 69.7 348.8 0 94.7 122.2 30 59.2 344 0 94.8 121.9 31 73.8 329.8 0 85.7 112.6 32 71.7 342 0 72.9 117.2 33 88.0 280 0 84.7 98.9 34 104.8 222 0 85.5 57.5 35 69.4 361.6 0 88.7 125.4 36 62.3 155 0 60.6 66.2 37 84.7 346.2 0 87.3 99.1 38 60.3 308.1 0 41.8 108.5 39 64.0 133 0 85.6 55.4 40 100.1 153 0 66.7 40.4 41 49.9 238 0 35.4 71.3 42 38.5 129 0 40.91 144.9 43 32.4 103.8 0 36.16 63.2 44 39.5 97 0 56.9 51.6 45 22.1 98 0 20.9 88.9 46 24.5 41.11 0 20.7 75.6 47 21.9 67 0 19.3 58.7 48 23.7 5 0 18.8 4.0 49 20.9 33 0 13.1 30.2 50 19.9 54 0 0.980 53.5 51 20.2 62 0 0.392 68.7 52 0.1 3 0 0.577 519.8
  • 6. C. R. Subudhi et al Int. Journal of Engineering Research and Applications www.ijera.com ISSN : 2248-9622, Vol. 4, Issue 9( Version 1), September 2014, pp.139-145 www.ijera.com 144 | P a g e Weekly rainfall Data of 27 years (1984– 2010) indicated that the monsoon starts effectively from 24th SMW (11 – 17th June) and remains active up to 39th SMW (30th November). Therefore, mean length of rainy season was found to be 15 weeks (105days). It is seen from the above table 3 that among all the 52 weeks contributes an average rainfall of 28.57mm with minimum and maximum rainfall of 0 mm and 429mm. The coefficient of variance (CV) 5.1. It was also observed that even at probability level of 0.55, there was no rainfall from 30th to 52nd week. There is only 19 % probability of receiving more than 10mm rainfall from 11th to 21st week. At 0.80 probability levels, no rainfall was assured during 43rd to 52nd weeks. The winter seasons weeks (between 39th and 52nd) weeks received no rainfall. It was also observed that within a normal month there were weekly rainfall variations causing temporary dry spells. When these dry spells coincide with the critical stage of crop growth, there will be considerable reduction in the yield of standing field crops. Therefore, appropriate moisture conservation measures such as mulching and water harvesting should be adopted to save crops from damaging action of drought. Table 1 shows that the probability of occurrence of dry week is high untill end of 23rd week. The range of probability of occurrence of dry week from 1st to 23rd week is between 59.2% to 100 %. The probability of occurrence of dry week preceded by another dry week and that of dry week preceded by another wet week vary from 0% to 96.2% and 50% to 100% respectively during these periods. The probability of occurrence of wet week preceded by wet week and that of wet week preceded by dry week vary from 0% to 44% and 3.8% to 30.5%. From 24th to 41st week the probability of dry week and that of dry week preceded by another dry week varies from 11.1% to 59.2% and 0% to 75%. The probability that these weeks remain wet varies between 33.3% and 88.8%. The transitional probability of wet week preceded by another wet week varies from 14.65% to 73.7%. The chances of occurrence of dry spells are again high from 44th week to the end of the year. Probability of occurrence of wet week preceded by another wet week during these periods is between 0.00% and 86%. The results pertaining to initial and conditional probabilities of dry and wet weeks and consecutive dry and wet weeks are presented in table 1 and 2 respectively for all the 52 standard meteorological weeks but, the results are discussed in relevance with rainy season (24th SMW –39th SMW) only. The probability of occurrence of 2 consecutive wet weeks are more than 35% during 24th –39th SMW and the probability of occurrence of 3 consecutive wet weeks are more than 25% during 24th –38th SMW (Table 2). The weekly rainfall attributes showing mean, maximum, minimum, standard deviation, coefficient of variation and percentage of weekly rainfall contribution towards annual rainfall are presented in table 5. The results reveal that, there are total of 48 weeks (1st –7th, 9th –11th SMW) where rainfall exceeds more than 20 mm. So harvesting excess runoff water for future supplemental irrigations and also drives attention towards soil erosion measures to be taken up for soil erosion control. During rainy season the mean weekly rainfall is found to be more than the weekly contribution of rainfall towards annual average rainfall is found to be highest during 25th –38th SMW. Crop planning for kharif (monsoon) season: During the kharif season, a good weekly rainfall (above 10mm) was received during 11th to 21st at 0.20-0.30 probability level, which was expected to take care of dry spells during the season. It indicates that seedbed preparation and sowing of kharif crops can be initiated in the 11th week. The reliability of getting rainfall at least equal to the mean rainfall is between 0.20 and 0.50 probability levels. Thus, it seems difficult to plan agricultural operations based on mean weekly rainfall alone. At above 0.55 probability level, there was no rainfall after 30th week and it may not be possible to replenish soil moisture in the soils with low water holding capacity. If green manuring crop is harvested early and spread on the surface, it may function as mulch and may reduce evaporation losses from the soil to some extent. Crop planning for Rabi (winter) season: During the winter season (31st week onwards), negligible rainfall is recorded at 0.55 probability level. So the surface soil would become dry with rare chances of getting adequate soil-moisture in the seeding zone. Hence, surface moisture conservation would be essential for germination of seed and plant establishment and, if possible, water harvesting should be done to ensure a pre-sowing irrigation. It was also revealed that the rabi crops have to be raised under moisture stress conditions. The crops should be able to use residual soil profile moisture more judiciously as reliability of getting adequate weekly rainfall is low. If irrigation facilities are available, then early sown varieties may be grown with the application of pre- sowing irrigation.
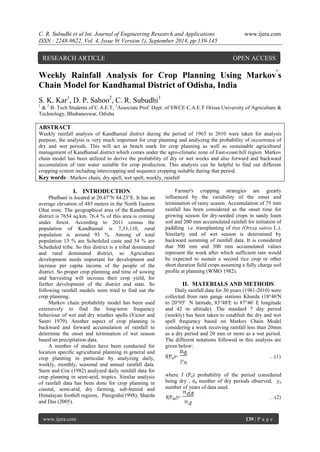
  • 7. C. R. Subudhi et al Int. Journal of Engineering Research and Applications www.ijera.com ISSN : 2248-9622, Vol. 4, Issue 9( Version 1), September 2014, pp.139-145 www.ijera.com 145 | P a g e 24 28 32 36 40 44 48 52 Category 1 Category 2 Category 3 Category 4 Category 5 Category 6 Category 7 Rice(S) Mustard Pigeon Pea Mustard Rice(S) HorseGram Ground Nut Mustard Rice(S) Radish Rice (M) Mustard Rice (L) Radis h Fig I Different cropping patterns for Kandhamal district Table 4 shows results obtained from Markov chain analysis REFERENCES [1] Pandarinath N. 1991. Markov Chain Model probability of dry and wet weeks during monsoon period over Andhra Pradesh. Mausam 42 (4) : 393--400. [2] Pradhan P.C, Senapati P.C and Subudhi C.R 1998. Crop plans based on frequencies of dry and wet spells at Daringibadi block of Kandhamal district. Indian Journal of Agricultural Science 345-9. [3] Panigrahi, B., 1998. Probability analysis of short duration rainfall for crop planning in coastal Orissa. Indian J. Soil Cons. 26(2): 178-182. [4] Sharda, V.N. and Das, P.K. 2005. Modeling weekly rainfall data for crop planning in a sub-humid climate of India. Agricultural Water Management.76:120-138 Month nd ndd Pd Pdd Pd2 Pd3 nw nww Pw Pww Pw2 Pw3 Jan 41 39 98 95 93 86 1 0 2.4 0 0.0 0.0 Feb 41 39 98 95 90 84 1 0 2.4 0 0.0 0.0 March 40 37 95 93 88 67 2 0 4.8 0 0.0 0.0 April 40 37 95 93 72 0 2 0 4.8 0 0.5 0.4 May 33 25 79 76 0 0 9 1 21.4 11 17.3 9.1 June 6 0 14 0 0 0 36 29 85.7 81 83.7 72.7 July 0 0 0 0 0 0 42 41 100.0 98 97.6 38.7 Aug 0 0 0 0 0 0 42 41 100.0 98 92.5 41.6 Sept 2 0 5 0 2 0 40 37 95.2 93 42.9 6.1 Oct 22 11 52 50 42 0 20 9 47.6 45 42.9 0.0 Nov 35 28 83 80 81 7 1 16.7 14 0.0 Dec 42 41 100 98 0 0 0.0 0 WEEKS (SMW)