Absorber Models for absorption of Carbon dioxide from sour natural gas byMethyl-diethanol Amine (MDEA)

Mathematical models of the absorber for the absorption of carbon dioxide (CO2)from sour natural gas in Methyl-diethanol Amine (MDEA)solution were developed. The resulting ordinary differential model equations were solved numerically using theode45 solver of MATLAB 7.5. The accuracy of the models was ascertained using industrial plant data from the carbon dioxide absorber of the Obiafu/Obrikom Gas Treatment plant in Rivers State, Nigeria. The models predicted the CO2 concentration in the sweet gas, gas and solvent (MDEA) temperature progressions along the packed absorber. The results obtained from solutions to the models compared favorably with the plant outputs with a maximum deviation between models predictions and industrial plant outputs of 0.44%. The models were used to simulate the influence of sour gas flow rates and solvent (MDEA) concentration in solution on the performance (absorption rates of CO2) of the absorber.The results show that the absorption rate of CO2 increases with increasing gas flow rate and solvent concentration.

Recommended
Recommended
More Related Content
What's hot
What's hot (20)
Viewers also liked
Viewers also liked (19)
Similar to Absorber Models for absorption of Carbon dioxide from sour natural gas byMethyl-diethanol Amine (MDEA)
Similar to Absorber Models for absorption of Carbon dioxide from sour natural gas byMethyl-diethanol Amine (MDEA) (20)
Recently uploaded
Recently uploaded (20)
Absorber Models for absorption of Carbon dioxide from sour natural gas byMethyl-diethanol Amine (MDEA)
- 1. Akpa, Jackson Gunorubon Int. Journal of Engineering Research and Applications www.ijera.com ISSN : 2248-9622, Vol. 4, Issue 12( Part 2), December 2014, pp.07-17 www.ijera.com 7|P a g e Absorber Models for absorption of Carbon dioxide from sour natural gas byMethyl-diethanol Amine (MDEA) 1 Akpa, Jackson Gunorubon and Okoroma, Justice U2 Department of Chemical/Petrochemical Engineering Rivers State University of Science and Technology, Port-Harcourt, Rivers State, Nigeria ABSTRACT Mathematical models of the absorber for the absorption of carbon dioxide (CO2)from sour natural gas in Methyl-diethanol Amine (MDEA)solution were developed. The resulting ordinary differential model equations were solved numerically using theode45 solver of MATLAB 7.5. The accuracy of the models was ascertained using industrial plant data from the carbon dioxide absorber of the Obiafu/Obrikom Gas Treatment plant in Rivers State, Nigeria. The models predicted the CO2 concentration in the sweet gas, gas and solvent (MDEA) temperature progressions along the packed absorber. The results obtained from solutions to the models compared favorably with the plant outputs with a maximum deviation between models predictions and industrial plant outputs of 0.44%. The models were used to simulate the influence of sour gas flow rates and solvent (MDEA) concentration in solution on the performance (absorption rates of CO2) of the absorber.The results show that the absorption rate of CO2 increases with increasing gas flow rate and solvent concentration. Keywords:Natural gas absorption, models, Methyl Diethanol Amine (MDEA), carbon dioxide I. INTRODUCTION Carbon dioxide occurs in diverse forms: it occurs naturally in oil and gas reservoirs, it is produced during the combustion of fossil fuels (coal, natural gas, gasoline and diesel) for transportation and generation of electricity;it is also released during industrial processes such as the production of cement, metal, iron and steel. The increase of the carbon dioxide concentration in the atmosphere has been identified as a major cause of global warming (McCann, 2009). Carbon dioxide reacts with hydrogen sulphide and water to form compounds corrosive to steel pipelines and gas processing equipment, its presence in natural gas decrease the heating value of the gas, it causes icing in natural gas liquids (NGL), at cryogenic conditions,carbon dioxidefreezes;thus plugsnatural gas processing and transportation pipelines.These show the necessity to completely eliminate carbon dioxide in natural gas as this will increase the heating value of natural gas, ensure smooth pipeline transport and efficient operations and ultimately reduce its concentration in the atmosphere. Natural gas is a hydrocarbongas mixture consisting of methane, varying amounts of other higher alkanes, carbon dioxide, nitrogen, and hydrogen sulfide. Natural gashas been described as the cleanest of the fossil fuels;emitting much lower amounts of soot and smog forming pollutants and no appreciable levels of mercury and other toxic substances, it is also usedas a chemical feedstock in the manufacture of plastics and other commercially important organic chemicals. The removal of carbon dioxide ensures that the natural gas meet required specification that would guarantee efficient operation of these processes. The major processes used for carbon dioxide removal can be grouped (Maddox, 1982) as follows:Absorption Processes (Chemical and Physical absorption), adsorption Process (Solid Surface),physical separation (Membrane, Cryogenic Separation)(Karl, 2003), hybrid solution (Mixed Physical and Chemical Solvent)(David, et al., 2003). Extensive studies on the solubility of carbon dioxide in aqueous solutions particularly amine solutions (Li and Mather, 1997; Bottoms, 1980, Desmukh and Mather, 1981; Versteeg and Van Swaaij, 1988); mixtures of amines (Kaewsichan, et al., 2001) have been performed; thus ascertain the suitability of amine solutions for absorption of carbon dioxide.Hence over the years,chemical or physical solvent absorption or a combination of both (Kohl and Nielsen, 1997) has become the preferred method for carbon dioxide removal from natural gas. Numerous experimental studies abound on absorption of carbon dioxide by solvents:(Weilandet al., 1982; Yeh and Bai, 1999), mixture of solvents:DEA and MDEA (Rinker, et al., 2000); NaOH, monoethanolamine (MEA) and 2-amino-2methy-1- propanol (AMP) (Tontiwachuthikul, et al., 1992); MEA and AMP (Won-Joonet al., 2009). Models for carbon dioxide and sour gas absorption in aqueous RESEARCH ARTICLE OPEN ACCESS
- 2. Akpa, Jackson Gunorubon Int. Journal of Engineering Research and Applications www.ijera.com ISSN : 2248-9622, Vol. 4, Issue 12( Part 2), December 2014, pp.07-17 www.ijera.com 8|P a g e amine solutions have also been developed by Freguia and Gray, (2003) and Kucka et al., (2003) respectively. Most of these works have focused on experiments to determine solvent effectiveness in the absorption process and the use of various blends of solvents to achieve desired absorption. Hence this work would develop appropriate models that could predict the performance of the absorber of a typical sour natural gas treatment facilityused for the removal of carbon dioxide from natural gas. The models would also be used for simulation of the absorber; thus provide a wide range of possible operating conditions for the absorption process. II. PROCESS DESCRIPTION In a typical carbon dioxide absorber for sour gas treatment, the sour gas stream and liquid amine solution are contacted by countercurrent flow in an absorption tower. The sour gas to be scrubbed enters the absorber at the bottom, flows up, and leaves at the top, whereas the solvent (MDEA) enters at the top of the absorber, flows down (contacting the gas), and emerges at the bottom. The liquid amine solution containing the absorbed gas is then flowed to a regeneration unit (operated at low pressure) where it is heated and the acid gases liberated. The hot lean amine solution then flows through a heat exchanger,is contacted with rich amine solution from the contact tower and returned to the gas contact tower. A typical amine absorber is shown in Figure 1. Sweet gas Lean MDEA Absorber Rich MDEA Sour gas Figure 1:Schematic of the Absorber 2.1 Model Development Mathematical models that could predict the performance of the absorber were developed using the principle of conservation of mass and energy. The models would predict the amount (concentration) of carbon dioxide removed from the sourgas stream and the temperature progression along the packing height of the absorber for the gas and liquid (MDEA) phases. 2.1.1 Model Assumptions The following assumptions were made in the modeling of the MDEA gas absorber. There are only two components to be transferred across the interface: CO2 and MDEA, concentration at the interface is considered as the equilibrium concentration, liquid resistance is not considered in the heat transfer process hence the temperature of the interface is the same as that of the bulk of the liquid (TL), the surface of heat transfer is the same as that of mass transfer, axial dispersions are insignificant and steady state condition applies. Figure 2shows an elemental or differential section of the packed height of an absorber with its associated inflow and outflow streams.
- 3. Akpa, Jackson Gunorubon Int. Journal of Engineering Research and Applications www.ijera.com ISSN : 2248-9622, Vol. 4, Issue 12( Part 2), December 2014, pp.07-17 www.ijera.com 9|P a g e Figure 2: Mass and heat transfer in differential section of the Absorber With these assumptions, the gas and liquid phase mass and energy balance for a differential packing of the absorber as shown in Figure 2 results in the following equations: Mass Balance 1. Gas: CO2: 𝑑𝑌 𝐶𝑂2 𝑑𝑧 = − 𝐾 𝐺 𝑌 𝐶𝑂2− 𝑌 𝐶𝑂2,𝑒 𝑎 𝐺 (1) 2. Liquid: MDEA: 𝑑𝑋 𝑀𝐷𝐸𝐴 𝑑𝑧 = − 𝐾 𝑀𝐷𝐸𝐴 𝑋 𝑀𝐷𝐸𝐴 − 𝑋 𝑀𝐷𝐸𝐴 ,𝑒 𝑎 𝐺 (2) Energy (Enthalpy) Balance 1. Gas Phase 𝑑𝑇 𝐺 𝑑𝑧 = − 𝐺 𝑎 𝑇 𝐺 − 𝑇 𝐿 𝐺 𝐶 𝑃 𝐵 + 𝑌 𝐶𝑂2 𝐶 𝑃 𝐶𝑂2 + 𝑋 𝑀𝐷𝐸𝐴 𝐶 𝑃 𝑀𝐷𝐸𝐴 (3) 2. Li quid Phase 𝑑𝑇 𝐿 𝑑𝑧 = − 𝐺𝐶 𝑃 𝐶𝑂2 𝑇𝐺 − 𝑇𝑂 + 𝐺𝐻 𝑂𝑆 𝐾 𝐺 𝑌 𝐶𝑂2− 𝑌 𝐶𝑂2,𝑒 𝑎 𝐺𝐿𝐶 𝑃 𝐿 − 𝐺𝐶 𝑃 𝑀𝐷𝐸𝐴 𝑇𝐺 − 𝑇𝑂 − 𝐺𝐻 𝑉 𝐾 𝑀𝐷𝐸𝐴 𝑋 𝑀𝐷𝐸𝐴 − 𝑋 𝑀𝐷𝐸𝐴 ,𝑒 𝑎 𝐺𝐿𝐶 𝑃 𝐿 − 𝐺 𝑎 𝑇 𝐺 − 𝑇 𝐿 𝐿𝐶 𝑃 𝐿 (4) Where: a is specific interfacial surface area, G is molar gas flux, KG is gas film transfer coefficient, 𝑌𝐶𝑂2 is mole fraction of carbon dioxide in gas phase, 𝑌𝐶𝑂2,𝑒 is equilibrium mole fraction of CO2 in gas phase, 𝑋 𝑀𝐷𝐸𝐴 is mole fraction of MDEA in gas phase, 𝑋 𝑀𝐷𝐸𝐴 ,𝑒 is equilibrium mole fraction of MDEA in gas phase, L is Liquid molar flux, TG is gas phase temperature, TL is liquid phase temperature, 𝐶 𝑃 𝑖 is heat capacity of component i, HOS is heat of solution, HV is heat of vaporization of MDEA, hG is heat transfer coefficient of gas phase. Interface dz L +dL XMDEA +dXMDEA TMDEA +dTMDEA HL +dHL L +dL XMDEA TMDEA HL Liquid Ni qL Gas Ni qG G yCO2 TCO2 HG G + dG yCO2 + dyCO2 TCO2 + dTCO2 HG + dtCO2 z + dz z
- 4. Akpa, Jackson Gunorubon Int. Journal of Engineering Research and Applications www.ijera.com ISSN : 2248-9622, Vol. 4, Issue 12( Part 2), December 2014, pp.07-17 www.ijera.com 10|P a g e 2.2 Methodology The models were developed using the principles of conservation of mass and energy as presented in Appendix 1. The accuracy of the modelswas tested with industrial data from the carbon dioxide absorber of the Nigerian Agip Oil Company Obiafu/Obrikom Gas Treatment plant in Rivers State, Nigeria. The developed models were then used to study the effects of certain process parameters on the performance of the absorber. 2.2.1 Determination of Process parameters and operating conditions To solvethe model equations of the absorber (eqns. (1), (3) and (4)) requires the determination of certain constants, physical properties and compositions of natural gas, carbon dioxide and MDEA. These properties were determined as follows: Absorber properties, physical properties and compositions of natural gas, carbon dioxide and MDEA were obtained from the Nigerian Agip Oil Company (NAOC) Obiafu/Obrikom(OB/OB) gas treatment plantin Rivers state and are tabulated in Tables 1 and 2. Other parameters in the models equations were obtained from relevant literatures as listed in Table 3. Table 1: Properties of absorber feedstock and products (NAOC OB/OB Gas Plant data) Property Inlet Outlet Gas Temperature (K) 313.67 325.11 Liquid (MDEA) Temperature (K) 313.40 316.33 CO2 mole fraction (mol/mol%) 0.0167 0.00000 Table 2:Absorber operating conditions Parameter Symbol Value Unit Molar gas flux 𝐺 0.0148 kmol/m2 s Molar liquid flux 𝐿 0.0095 kmol/m2 s Equilibrium mole fraction of CO2 in gas phase 𝑦 𝐶𝑂2,𝑒 0.191 Unitless Equilibrium mole fraction of MDEA in gas phase 𝑋 𝑀𝐷𝐸𝐴,𝑒 0.325 Unitless Height of column 𝑧 20 M Specific interfacial surface area 𝑎 416 m2 /m3 Reference Temperature 𝑇𝑜 298 K Table 3:Properties of gas and liquid solvent Parameter Symbol Value Unit Reference Gas – film transfer coefficient 𝐾𝐺 0.000096 kmol/m2 s Karl, 2003 Liquid – film transfer coefficient 𝐾𝐿,𝑀𝐷𝐸𝐴 0.000051 kmol/m2 s Karl, 2003 Gas phase Heat transfer coefficient 𝐺 0.01 KJ/m2 sK Karl., 2003 Enthalpy of gas phase 𝐻 𝐺 19000 KJ/kmolK Karl, 2003 Enthalpy of liquid phase 𝐻𝐿 26000 KJ/kmolK Karl, 2003 Specific heat Capacity of CO2 𝐶𝑝 𝐶𝑂2 37.13 KJ/kmolK Karl, 2003 Specific heat Capacity of liquid 𝐶 𝑃 𝐿 49.982 KJ/kmolK Karl, 2003 Specific heat Capacity of MDEA 𝐶𝑝 𝑀𝐷𝐸𝐴 49.982 KJ/kmolK Tontiwachwuthikul, et al (1992) Specific heat Capacity of gas 𝐶𝑝 𝐵 37.13 KJ/kmolK Heat of solution for CO2 𝐻 𝑂𝑆 3.9 x 10⁵ KJ/kmolK Heat of vaporization of MDEA 𝐻 𝑉 2.6 x 10⁴ KJ/kmolK 2.2.2 Solution Technique of Model Equations The MatLab 7.5 ODE45 solver from Mathworksfor non-stiff ordinary differential equations which uses the 4th order RungeKutta algorithm was employed in solving the resulting ordinary differential model equations. III. RESULTS AND DISCUSSION The results obtained from the solution of the model equations are presented as follows: 3.1 Carbon dioxide concentration along absorption column height The model prediction of the concentration of carbon dioxide in the sweet natural gas stream as it flows up the absorber is shown in Figure 3.
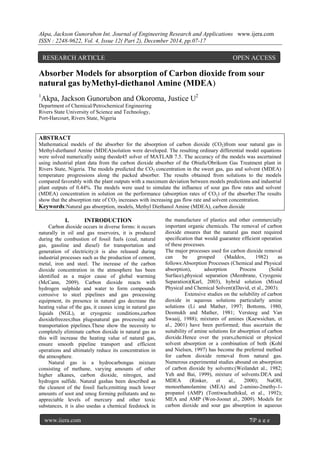
- 5. Akpa, Jackson Gunorubon Int. Journal of Engineering Research and Applications www.ijera.com ISSN : 2248-9622, Vol. 4, Issue 12( Part 2), December 2014, pp.07-17 www.ijera.com 11|P a g e Figure3: Variation of gas CO2 concentration(mole fraction) from bottom of column Figure 3 shows that the carbon dioxide concentrationin the natural gas stream reduces as the gas flows from the bottom of the column to the top. Model results show that about 93.6% of the carbon dioxide absorption occurred in the first 6meters of the column. Thereafter, the absorption rate increased very minimally and the concentration of carbon dioxide became virtually constant from a height of approximately 10meters and above. 3.2 Gas and Liquidstream temperatures across the absorption column height The temperature progressions of the gas and liquid streams as both streams flow up and down the absorption column respectively are depicted in Figure 4. Figure 4:Gas and Liquid stream temperatures along the absorption column height. Figure 4 shows that the temperature of the absorbing solvent, Methyl-diethanol Amine (MDEA) decreased sharply at the top 4meters then gradually and finally becomes constant as it flows from the top to the bottom of the column; while the temperature of the natural gas stream increased sharply at the first/bottom 4meters, then gradually and finally becomes constant as it flows from the bottom to the top of the column.The liquid 0 0.002 0.004 0.006 0.008 0.01 0.012 0.014 0.016 0.018 0 5 10 15 20 25 CO2Concentration,yCO2(mol/mol%) Absorption column height, Z (m) 310 312 314 316 318 320 322 324 326 0 5 10 15 20 25 Temperature(K) Absorption column height, Z (m) GAS TEMP (TG) LIQUID TEMP (TL)
- 6. Akpa, Jackson Gunorubon Int. Journal of Engineering Research and Applications www.ijera.com ISSN : 2248-9622, Vol. 4, Issue 12( Part 2), December 2014, pp.07-17 www.ijera.com 12|P a g e temperature decreased due to the heat of solution released between carbon dioxide and MDEA while the gas temperature increased due to heat transfer between the gas and liquid phases.The increase in gas temperature could decrease the viscosity of the solution and decrease the solubility of carbon dioxide in MDEA liquid. The former phenomenon has been reported by Daneshvar, et al., (2005) to dominateover the later resulting in increased rate of absorption as can be seen in Figure 3. Similar finding was reported by Saha et al., (1993) for the absorption of carbon dioxide in 2-amino-2-methyl-1-propanol (AMP). Also, the slope in the gas temperature curve is the same as that of the the corbon dioxide concentration. 3.3 Model Validation A comparison of the model predictions and the outputs of the absorber from the NAOC OB/OB Gas Plant of the carbon dioxide concentration in sweet natural gas, natural gas and MDEA liquid temperatures are presented in Table 3. Table 3: Comparison of model predictions and absorberoutputs Process Parameter Model Prediction Plant Data % Deviation CO2 concentration 0.00000 0.00000 0.00 Gas Outlet Temperature (K) 324.32 325.11 0.24 MDEA OutletTemperature (K) 312.00 313.40 0.44 Table 3 shows the accuracy of the models in predicting these parameters for the absorber in the Nigerian AgipOil CompanyObiafu/Obrikom gas plant as the maximum deviation between model predictions and industrial plant outputs is 0.44%. Therefore the model equations developed can be used effectively to simulate the absorber of the NAOC OB/OB gas plant. 3.4 Process Simulation The effects of sour natural gas flow rate and concentration of the solvent (DMEA weight %) on the performance of the absorber using the models developed were investigated. 3.4.1 Effect of Gas flow rate Figure 5 shows the effects of varying the sour gas flow rate on the performance of the absorber. Figure5:Carbon dioxide concentration along column height for differentgas flow rates. When the gas flow rate is increased, the gas flows faster, spends less time in the column and the contact time with the DMEA solvent is reduced; hence less carbon dioxide gas is adsorbed and the rate of absorption decreased. These tends the model predicts accurately as shown in Figure 5 where the outlet concentration of carbon dioxide in the sweet natural gas increase with increase in sour gas flow rate, indicating a decrease in absorption rate along the column with increase in gas flow rate.A three dimensional surface plot of these trends is further demonstrated in Figure 6. 0 0.002 0.004 0.006 0.008 0.01 0.012 0.014 0.016 0.018 0 5 10 15 20 25 CO2Concentration,yCO2(mol/mol%) Absorption column height, Z (m) G = 80,000 std.m3/hr G = 120,000 std.m3/hr G = 160,000 std.m3/hr G = 200,000 std.m3/hr
- 7. Akpa, Jackson Gunorubon Int. Journal of Engineering Research and Applications www.ijera.com ISSN : 2248-9622, Vol. 4, Issue 12( Part 2), December 2014, pp.07-17 www.ijera.com 13|P a g e Figure6: Surface plot of CO2 concentration through column height at differentgas flow rates 3.4.2 Effect of MDEA concentration (weight %) The effects of methyl di-ethanol amine concentration (MDEA) on the performance of the absorber (treatment of feed sour gas with different amine concentrations and the observed % mole concentration of carbon dioxide in the sweet gas)are shown in Figure 7.Figure 7 shows a general decrease in concentration of carbon dioxide in the sweet gas as the concentration of amine increases.This decrease has been attributed by Daneshver, et al., (2005)to be due to the increase in amine solvent capacity with increase in concentration of amine in the solution. Figure 7: Effect of concentration of MDEA on carbon dioxide concentration Figure 7 also shows an initial sharp increase in the rate of absorption (decrease in carbon dioxide concentration in sweet gas) with increase in MDEA concentration (38.22 - 45wt% MDEA). The increase in absorption rate reduced with further increase in concentration of MDEA (45 -55wt% MDEA).These trends are similar to those reported by Won-Joon et al., (2009) where increase in absorbent concentration of 10 - 40wt% inmonoethanolamine (MEA) and 2-amino-2-methyl-1-propanol (AMP) increased carbon dioxide removal efficiency. Removal efficiency then decreased at higher concentrations (> 40wt %) of the absorbents. Similar trends in absorption rates were also reported by Yeh and Bai (1999). The trends in Figure 7 showing the high increase in absorption rates with initial increase in MDEA concentration (sharp drop in outlet concentrations of carbon dioxide in the sweet gas stream) which gradually decrease with subsequent increase in MDEA concentrations are shown vividly in Figure 8 and in a three dimensional surface plot in Figure 9. The surface plot shows a steep transient in the carbon dioxide concentration at the lower part of the columnwhich progressed gradually and become virtually constant at the top of the column. G = 80,000 std.m3/hr G = 120,000 std.m3/hr G = 160,000 std.m3/hr G = 200,000 std.m3/hr 0 0.005 0.01 0.015 0.02 0 2 4 6 8 10 12 14 16 18 20 CO2Concentration,yCO2 (mol/mol%) Absorption column height, Z (m) 0 0.002 0.004 0.006 0.008 0.01 0.012 0.014 0.016 0.018 0 5 10 15 20 25 CO2Concentration,yCO2 (mol/mol%) Absorption column height, Z (m) MDEA = 55% MDEA = 50% MDEA = 45% MDEA = 38.22%
- 8. Akpa, Jackson Gunorubon Int. Journal of Engineering Research and Applications www.ijera.com ISSN : 2248-9622, Vol. 4, Issue 12( Part 2), December 2014, pp.07-17 www.ijera.com 14|P a g e Figure 8: Plot showing the effect of MDEA concentration on the outlet CO2 concentration Figure 9: Surface plot of CO2 concentration along column height at varying concentrations of MDEA IV. CONCLUSION Detailed models of the absorber for the absorption of carbon dioxide in sour natural gas using methyl di- ethanol amine (MDEA) have been developed. The modelspredicted accurately the concentration of carbon dioxide in the sweet gas and the temperature progression of the gas and liquid (solvent) streams along the absorber.Results from models developed using plant data from the Nigerian Agip Oil Company Obiafu/Obrikom gas treatment plant shows that the maximum deviation between model predictions and industrial plant outputs was 0.44%. The models were used to simulate the effects of sour gas flow rates and solvent (MDEA) concentration in solution on the performance of the absorber. V. NOMENCLATURE 𝑎 Specific interfacial surface area (m2 /m3 ) 𝐶𝐿 Specific heat of liquid (KJ/kmolK) 𝐶𝑝 𝐵 Specific heat of gas (KJ/kmolK) 𝐶𝑝 𝐶𝑂2 Specific heat of CO2 (KJ/kmolK) 𝐶𝑝 𝑀𝐷𝐸𝐴 Specific heat of MDEA (KJ/kmolK) 𝐺 Molar gas flux or gas phase molar velocity (kmol/m2 s) 𝐺 Heat transfer coefficient of gas phase (KJ/m2 sK) 𝐻 𝐺 Enthalpy of gas phase (KJ/kmolK) 𝐻𝐿 Enthalpy of liquid phase (KJ/kmolK) 𝐻 𝑂𝑆 Heat of reaction – include heat of solution for CO2 (KJ/kmolK) 𝐻 𝑉 Heat of vapourization of MDEA (KJ/kmolK) 𝐾𝐺 Gas – film transfer coefficient in terms of mole fraction (/m2 s) 𝐾𝐿,𝑀𝐷𝐸𝐴 Liquid – film transfer coefficient in terms of mole (kmol/m2 s) 𝐿 Molar liquid flux (kmol/m2 s) 𝑇 𝐺 Temperature of gas phase (K) 𝑇𝐿 Temperature of liquid phase (K) 0 0.0005 0.001 0.0015 0.002 0.0025 35 40 45 50 55 60 OutletCO2 concentration,yA (mol/mol%) MDEA Concentration (wt %) MDEA = 55% MDEA = 50% MDEA = 45% MDEA = 38.22% 0 0.005 0.01 0.015 0.02 0 2 4 6 8 10 12 14 16 18 20 CO2Concentration,yCO2 (mol/mol%) Absorption column height, Z (m)
- 9. Akpa, Jackson Gunorubon Int. Journal of Engineering Research and Applications www.ijera.com ISSN : 2248-9622, Vol. 4, Issue 12( Part 2), December 2014, pp.07-17 www.ijera.com 15|P a g e 𝑇 𝑜 Reference temperature (K) 𝑋 𝑀𝐷𝐸𝐴 Mole fraction of MDEA in the gas phase 𝑋 𝑀𝐷𝐸𝐴 ,𝑒 Equilibrium (interface) mole fraction of MDEA in gas phase 𝑦 𝐶𝑂2 Mole fraction of CO2 in the gas phase 𝑦 𝐶𝑂2,𝑒 Equilibrium (interface) mole fraction of CO2 in gas phase 𝑧 Height of column (m) REFERENCES [1.] Bottoms, W.B., 1980. Correlation and prediction of the solubility of carbon dioxide inaqueous alkanoamine and mixed alkanoamine solutions, Industrial and EngineeringChemistry Research, 41: 1658–1665. [2.] Daneshvar, N., D. Salari, M.Z. Zamzami and S. Aber, 2005. Absorption of carbon dioxide into aqueous solutions of N, N-dimethylethanolamine and aqueous blends of mono and dirthanolamine, Chem. Biochem, Eng. Q., 19 (13): 297-302. [3.] David, C., B. Kellogg, and S. Pankaj, 2003.“LNG A Proven Stranded Gas Monetization Option” SPE Paper (84252): pp: 3. [4.] Desmukh, R.D. and A.E. Mather, 1981. A mathematical Model For Equilibrium Solubility ofHydrogen Sulfide and Carbon Dioxide in Aqueous Alkanolamine Solutions, Chem. Eng. Sci., 36:355-362. [5.] Freguia, U.O. and T.R. Gary, 2003.Modeling of CO2 Capture by AqueousMonoethanolamine, AIChE Journal, (49),7: 1676-1686. [6.] Kaewsichan, L., O. Al-Bofersen, V.F. Yesavage andM. Sami Selim, 2001. Predictions of the solubility of acid gases in monoethanolamine (MEA) and methyldiethanolamine (MDEA) solutions using the electrolyte-Uniquac model, Fluid Phase Equilibria, 183: 159-171. [7.] Karl, A.H. 2003.Modelling and experimental study of CO2 absorption in a membrane contactor, Thesis – NUST, pp: 102. [8.] Kohl, A. and R, Nielsen,1997.Gas Purification, 5th edition, Gulf Publishing Company. [9.] Kucka, L., I. Muller, E. Kenig andA. Gorak, 2003,On the modelling and simulation of sour gas absorption by aqueous amine solutions. Chem. Eng. Sci., 58: 3571-3578. [10.] Li, Y. G., and A. E. Mather, 1997. Correlation and prediction of the solubility of CO2and H2S in aqueous solutions of methyldiethanolamine, Industrial and Engineering Chemistry Research, 36: 2760-2765. [11.] Maddox, R. N., 1982.Gas Conditioning and Processing – Advanced Techniques and Applications, Ed.: Campbell, J. M., Campbell Petroleum Series, Norman, Okla.pp: 370. [12.] McCann N., D. Phan,X. Wang, W. Conway and R. Burns, 2009. Kinetics and mechanism of carbamate formation from CO2 (aq), carbonate species, and monoethanolamine in aqueous solution, The Journal of Physical Chemistry A, 113: 5022-5029. [13.] NAOC OB/OB Gas Plant Data, 2006.Agip KCO Training Special Project, OJT Technical Workbook – Obiafu/Obrikom Gas Plant. [14.] Rinker, E.B.,S.S. Ashour, H.A. Al-Ghawas andO.C. Sandall, 2000. Absorption of CO2 into aqueous blends of DEA and MDEA. Ind. Eng. Chem. Res, 39: 4346-4356. [15.] Saha, A.K.,S.S. Bandyopodhyay, P. Saju andA.K. Biswas, 1993.Selective removal of hydrogen sulfide from gases containing hydrogen sulfide and carbon dioxide by absorption into aqueous solutions of 2- amino-2-methyl-1-propanol, Ind. Eng. Chem. Res. 32 (12): 3051–3055. [16.] Tontiwachwuthikul, P., A. Meisen andJ. Lim, 1992.CO2 absorption by NaOH,Monoethanolamine and 2-Amino-2-Methyl-1-Propanol solution in a packed column, Chemical Engineering science, 47 (2): 381-390. [17.] Versteeg, G.F. andW.P.M Van Swaaij, 1988. Solubility and Diffusivity of Acid Gases (CO2, N20) in Aqueous Alkanolamine Solutions Journal of Chemical Engineering, volume 33: 29-34. [18.] Weiland, R.H., M. Rawal and R.G. Rice, 1982. Stripping of Carbon Dioxide from Monoethanolamine Solutions in a Packed Column, AIChEJ, 28:963-973. [19.] Won-Joon, C., S. Jong-Beom,J. Sang-Yong,J. Jong-HyeonandO. Kwang-Joong,2009.Removal characteristics of CO2 using aqueous MEA/AMP solutions in the absorption and regeneration process, Journal of Environmental Sciences, 21: 907–913 [20.] Yeh, A.C. andH. Bai, 1999. Comparison of ammonia and mo- noethanolamine solvents to reduce CO2 greenhouse gas emissions. Science of the Total Environment, 228: 121– 133. [21.] Yih,S.M. and C.C. Sun,1987. Simultaneous Absorption of hydrogen Sulfide and Carbon dioxide into Di-isopropanolamine solution, The Canadian Journal of Chemical Engineering, 65:581 - 585.
- 10. Akpa, Jackson Gunorubon Int. Journal of Engineering Research and Applications www.ijera.com ISSN : 2248-9622, Vol. 4, Issue 12( Part 2), December 2014, pp.07-17 www.ijera.com 16|P a g e APPENDIX I The steady state mass balance on a differential element (packing) as shown in Figure 2 of the absorber is: 𝑅𝑎𝑡𝑒 𝑜𝑓 𝑚𝑎𝑠𝑠 𝑓𝑙𝑜𝑤 𝑜𝑓 𝑐𝑜𝑚𝑝𝑜𝑛𝑒𝑛𝑡 𝑖 𝑖𝑛𝑡𝑜 𝑑𝑖𝑓𝑓𝑒𝑟𝑒𝑛𝑡𝑖𝑎𝑙 𝑒𝑙𝑒𝑚𝑒𝑛𝑡 = 𝑅𝑎𝑡𝑒 𝑜𝑓 𝑚𝑎𝑠𝑠 𝑓𝑙𝑜𝑤 𝑜𝑓 𝑐𝑜𝑚𝑝𝑜𝑛𝑒𝑛𝑡 𝑖 𝑜𝑢𝑡 𝑜𝑓 𝑑𝑖𝑓𝑓𝑒𝑟𝑒𝑛𝑡𝑖𝑎𝑙 𝑒𝑙𝑒𝑚𝑒𝑛𝑡 + 𝑅𝑎𝑡𝑒 𝑜𝑓 𝑚𝑎𝑠𝑠 𝑜𝑓 𝑐𝑜𝑚𝑝𝑜𝑛𝑒𝑛𝑡 𝑖 𝑡𝑟𝑎𝑛𝑠𝑓𝑒𝑟𝑒𝑑 𝑡𝑜 𝑐𝑜𝑚𝑝𝑜𝑛𝑒𝑛𝑡 𝑖 + 1 𝑤𝑖𝑡𝑖𝑛 𝑑𝑖𝑓𝑓𝑒𝑟𝑒𝑛𝑡𝑖𝑎𝑙 𝑒𝑙𝑒𝑚𝑒𝑛𝑡 (5) The various terms in equation (5) were obtained as follows: 𝑅𝑎𝑡𝑒 𝑜𝑓 𝑚𝑎𝑠𝑠 𝑓𝑙𝑜𝑤 𝑜𝑓 𝑐𝑜𝑚𝑝𝑜𝑛𝑒𝑛𝑡 𝑖 𝑖𝑛𝑡𝑜 𝑑𝑖𝑓𝑓𝑒𝑟𝑒𝑛𝑡𝑖𝑎𝑙 𝑒𝑙𝑒𝑚𝑒𝑛𝑡 = 𝐺𝐴𝑌𝐶𝑂2 𝑅𝑎𝑡𝑒 𝑜𝑓 𝑚𝑎𝑠𝑠 𝑓𝑙𝑜𝑤 𝑜𝑓 𝑐𝑜𝑚𝑝𝑜𝑛𝑒𝑛𝑡 𝑖 𝑜𝑢𝑡 𝑜𝑓 𝑑𝑖𝑓𝑓𝑒𝑟𝑒𝑛𝑡𝑖𝑎𝑙 𝑒𝑙𝑒𝑚𝑒𝑛𝑡 = 𝐺𝐴𝑌𝐶𝑂2 + 𝐺𝐴𝑑𝑌𝐶𝑂2 𝑅𝑎𝑡𝑒 𝑜𝑓 𝑚𝑎𝑠𝑠 𝑜𝑓 𝑐𝑜𝑚𝑝𝑜𝑛𝑒𝑛𝑡 𝑖 𝑡𝑟𝑎𝑛𝑠𝑓𝑒𝑟𝑒𝑑 𝑡𝑜 𝑐𝑜𝑚𝑝𝑜𝑛𝑒𝑛𝑡 𝑖 + 1 𝑤𝑖𝑡𝑖𝑛 𝑑𝑖𝑓𝑓𝑒𝑟𝑒𝑛𝑡𝑖𝑎𝑙 𝑒𝑙𝑒𝑚𝑒𝑛𝑡 = 𝐾𝐺 𝑌𝐶𝑂2 − 𝑌𝐶𝑂2,𝑒 𝑎𝑑𝑧𝐴 Substituting these expressions into mass balance equation yields: 𝐺𝐴𝑌𝐶𝑂2 = 𝐺𝐴𝑌𝐶𝑂2 + 𝐺𝐴𝑑𝑌𝐶𝑂2 + 𝐾𝐺 𝑌𝐶𝑂2 − 𝑌𝐶𝑂2,𝑒 𝑎𝑑𝑧𝐴 (6) Simplifying yields: 𝑑𝑌 𝐶𝑂2 𝑑𝑧 = − 𝐾 𝐺 𝑌 𝐶𝑂2− 𝑌 𝐶𝑂2,𝑒 𝑎 𝐺 (7) The same procedure can be followed to obtain the model equation for the solvent as: 𝑑𝑋 𝑀𝐷𝐸𝐴 𝑑𝑧 = − 𝐾 𝐺 𝑋 𝑀𝐷𝐸𝐴 − 𝑋 𝑀𝐷𝐸𝐴 ,𝑒 𝑎 𝐺 (8) B. ENERGY BALANCE The steady state energy balance on a differential element (packing) as shown in Figure 2 of the absorber is: 𝑅𝑎𝑡𝑒 𝑜𝑓 𝑒𝑎𝑡 𝑓𝑙𝑜𝑤 𝑖𝑛𝑡𝑜 𝑑𝑖𝑓𝑓𝑒𝑟𝑒𝑛𝑡𝑖𝑎𝑙 𝑒𝑙𝑒𝑚𝑒𝑛𝑡 = 𝑅𝑎𝑡𝑒 𝑜𝑓 𝑒𝑎𝑡 𝑓𝑙𝑜𝑤 𝑜𝑢𝑡 𝑜𝑓 𝑑𝑖𝑓𝑓𝑒𝑟𝑒𝑛𝑡𝑖𝑎𝑙 𝑒𝑙𝑒𝑚𝑒𝑛𝑡 ± 𝑅𝑎𝑡𝑒 𝑜𝑓 𝑒𝑎𝑡 𝑓𝑙𝑜𝑤 𝑑𝑢𝑒 𝑡𝑜 𝑚𝑎𝑠𝑠 𝑡𝑟𝑎𝑛𝑠𝑓𝑒𝑟 𝑓𝑟𝑜𝑚/𝑖𝑛𝑡𝑜 𝑑𝑖𝑓𝑓𝑒𝑟𝑒𝑛𝑡𝑖𝑎𝑙 𝑒𝑙𝑒𝑚𝑒𝑛𝑡 + 𝑅𝑎𝑡𝑒 𝑜𝑓 𝑒𝑎𝑡 𝑡𝑟𝑎𝑛𝑠𝑓𝑒𝑟𝑒𝑑 𝑓𝑟𝑜𝑚 𝑔𝑎𝑠/𝑙𝑖𝑞𝑢𝑖𝑑 𝑡𝑜 𝑙𝑖𝑞𝑢𝑖𝑑/𝑔𝑎𝑠 𝑝𝑎𝑠𝑒 𝑖𝑛 𝑑𝑖𝑓𝑓𝑒𝑟𝑒𝑛𝑡𝑖𝑎𝑙 𝑒𝑙𝑒𝑚𝑒𝑛𝑡 (9) I. GAS PHASE The various terms in equation (9) were obtained for the gas phase as follows: 𝑅𝑎𝑡𝑒 𝑜𝑓 𝑒𝑎𝑡 𝑓𝑙𝑜𝑤 𝑖𝑛𝑡𝑜 𝑑𝑖𝑓𝑓𝑒𝑟𝑒𝑛𝑡𝑖𝑎𝑙 𝑒𝑙𝑒𝑚𝑒𝑛𝑡 = 𝐴𝐺𝐻 𝐺 𝑅𝑎𝑡𝑒 𝑜𝑓 𝑒𝑎𝑡 𝑓𝑙𝑜𝑤 𝑜𝑢𝑡 𝑜𝑓 𝑑𝑖𝑓𝑓𝑒𝑟𝑒𝑛𝑡𝑖𝑎𝑙 𝑒𝑙𝑒𝑚𝑒𝑛𝑡 = 𝐴𝐺𝐻 𝐺 + 𝐴𝐺𝑑𝐻 𝐺 𝑅𝑎𝑡𝑒 𝑜𝑓 𝑒𝑎𝑡 𝑓𝑙𝑜𝑤 𝑑𝑢𝑒 𝑡𝑜 𝑚𝑎𝑠𝑠 𝑡𝑟𝑎𝑛𝑠𝑓𝑒𝑟 𝑜𝑢𝑡 𝑜𝑓 𝑑𝑖𝑓𝑓𝑒𝑟𝑒𝑛𝑡𝑖𝑎𝑙 𝑒𝑙𝑒𝑚𝑒𝑛𝑡 = 𝐺𝑑𝑌𝐶𝑂2 𝐶 𝑃 𝐶𝑂2 𝑇𝐺 − 𝑇𝑂 + 𝐺𝑑𝑌𝐶𝑂2 𝐻 𝑂𝑆 𝐴 𝐺𝑑𝑋 𝑀𝐷𝐸𝐴 𝐶 𝑃 𝑀𝐷𝐸𝐴 𝑇𝐺 − 𝑇𝑂 + 𝐺𝑑𝑋 𝑀𝐷𝐸𝐴 𝐻 𝑉 𝐴 𝑅𝑎𝑡𝑒 𝑜𝑓 𝑒𝑎𝑡 𝑡𝑟𝑎𝑛𝑠𝑓𝑒𝑟𝑒𝑑 𝑓𝑟𝑜𝑚 𝑔𝑎𝑠 𝑡𝑜 𝑙𝑖𝑞𝑢𝑖𝑑 𝑝𝑎𝑠𝑒 𝑖𝑛 𝑑𝑖𝑓𝑓𝑒𝑟𝑒𝑛𝑡𝑖𝑎𝑙 𝑒𝑙𝑒𝑚𝑒𝑛𝑡 = 𝑞 𝐺 𝑎𝑑𝑧 = 𝐺 𝑎 𝑇𝐺 − 𝑇𝐿 𝐴𝑑𝑧 Substituting these expressions in equation (9) gives: 𝐴𝐺𝐻 𝐺 = 𝐴𝐺𝐻 𝐺 + 𝐴𝐺𝑑𝐻 𝐺 + 𝐺𝑑𝑌𝐶𝑂2 𝐶 𝑃 𝐶𝑂2 𝑇𝐺 − 𝑇𝑂 + 𝐺𝑑𝑌𝐶𝑂2 𝐻 𝑂𝑆 𝐴 + 𝐺𝑑𝑋 𝑀𝐷𝐸𝐴 𝐶 𝑃 𝑀𝐷𝐸𝐴 𝑇𝐺 − 𝑇𝑂+ 𝐺𝑑𝑋𝑀𝐷𝐸𝐴𝐻𝑉𝐴+ 𝐺𝑎𝑇𝐺− 𝑇𝐿𝐴𝑑𝑧(10) Simplifying equation (10) gives: −𝐴𝐺𝑑𝐻 𝐺 = 𝐺𝑑𝑌𝐶𝑂2 𝐶 𝑃 𝐶𝑂2 𝑇𝐺 − 𝑇𝑂 + 𝐺𝑑𝑌𝐶𝑂2 𝐻 𝑂𝑆 𝐴 + 𝐺𝑑𝑋 𝑀𝐷𝐸𝐴 𝐶 𝑃 𝑀𝐷𝐸𝐴 𝑇𝐺 − 𝑇𝑂 + 𝐺𝑑𝑋 𝑀𝐷𝐸𝐴 𝐻 𝑉 𝐴 + 𝐺 𝑎 𝑇𝐺 − 𝑇𝐿 𝐴𝑑𝑧 (11)
- 11. Akpa, Jackson Gunorubon Int. Journal of Engineering Research and Applications www.ijera.com ISSN : 2248-9622, Vol. 4, Issue 12( Part 2), December 2014, pp.07-17 www.ijera.com 17|P a g e But: 𝐻 𝐺 = 𝐶 𝑃 𝐵 𝑇𝐺 − 𝑇𝑂 + 𝑌𝐶𝑂2 𝐶 𝑃 𝐶𝑂2 𝑇𝐺 − 𝑇𝑂 + 𝑌𝐶𝑂2 𝐻 𝑂𝑆 + 𝑋 𝑀𝐷𝐸𝐴 𝐶 𝑃 𝑀𝐷𝐸𝐴 𝑇𝐺 − 𝑇𝑂 + 𝑋 𝑀𝐷𝐸𝐴 𝐻 𝑉 (12) 𝑑𝐻 𝐺 = 𝐶 𝑃 𝐵 𝑑𝑇𝐺 + 𝑌𝐶𝑂2 𝐶 𝑃 𝐶𝑂2 𝑑𝑇𝐺 + 𝐶 𝑃 𝐶𝑂2 𝑇𝐺 − 𝑇𝑂 + 𝐻 𝑂𝑆 𝑑𝑌𝐶𝑂2 + 𝑋 𝑀𝐷𝐸𝐴 𝐶 𝑃 𝑀𝐷𝐸𝐴 𝑑𝑇𝐺 + 𝐶 𝑃 𝑀𝐷𝐸𝐴 𝑇𝐺 − 𝑇𝑂 + 𝐻 𝑉 𝑑𝑋 𝑀𝐷𝐸𝐴 (13) Substituting equation (13) into equation (11) gives: −𝐴𝐺 𝐶 𝑃 𝐵 𝑑𝑇𝐺 + 𝑌𝐶𝑂2 𝐶 𝑃 𝐶𝑂2 𝑑𝑇𝐺 + 𝐶 𝑃 𝐶𝑂2 𝑇𝐺 − 𝑇𝑂 + 𝐻 𝑂𝑆 𝑑𝑌𝐶𝑂2 + 𝑋 𝑀𝐷𝐸𝐴 𝐶 𝑃 𝑀𝐷𝐸𝐴 𝑑𝑇𝐺 + 𝐶 𝑃 𝑀𝐷𝐸𝐴 𝑇𝐺 − 𝑇𝑂 + 𝐻 𝑉 𝑑𝑋 𝑀𝐷𝐸𝐴 = 𝐺𝑑𝑌𝐶𝑂2 𝐶 𝑃 𝐶𝑂2 𝑇𝐺 − 𝑇𝑂 + 𝐺𝑑𝑌𝐶𝑂2 𝐻 𝑂𝑆 𝐴 + 𝐺𝑑𝑋 𝑀𝐷𝐸𝐴 𝐶 𝑃 𝑀𝐷𝐸𝐴 𝑇𝐺 − 𝑇𝑂 + 𝐺𝑑𝑋 𝑀𝐷𝐸𝐴 𝐻 𝑉 𝐴 + 𝐺 𝑎 𝑇𝐺 − 𝑇𝐿 𝐴𝑑𝑧 (14) Expanding and rearranging equation (14) yields: −𝐴𝐺 𝐶 𝑃 𝐵 + 𝑌𝐶𝑂2 𝐶 𝑃 𝐶𝑂2 +𝑋 𝑀𝐷𝐸𝐴 𝐶 𝑃 𝑀𝐷𝐸𝐴 𝑑𝑇𝐺 = 𝐺 𝑎 𝑇𝐺 − 𝑇𝐿 𝐴𝑑𝑧 (15) Equation (15) can be rearranged to give: 𝑑𝑇 𝐺 𝑑𝑧 = − 𝐺 𝑎 𝑇 𝐺 − 𝑇 𝐿 𝐺 𝐶 𝑃 𝐵 +𝑌 𝐶𝑂2 𝐶 𝑃 𝐶𝑂2 +𝑋 𝑀𝐷𝐸𝐴 𝐶 𝑃 𝑀𝐷𝐸𝐴 (16) II. LIQUID PHASE The various terms in equation (9) were obtained for the liquid phase as follows: 𝑅𝑎𝑡𝑒 𝑜𝑓 𝑒𝑎𝑡 𝑓𝑙𝑜𝑤 𝑖𝑛𝑡𝑜 𝑑𝑖𝑓𝑓𝑒𝑟𝑒𝑛𝑡𝑖𝑎𝑙 𝑒𝑙𝑒𝑚𝑒𝑛𝑡 = 𝐿 + 𝑑𝐿 𝐻𝐿 + 𝑑𝐻𝐿 𝐴 𝑅𝑎𝑡𝑒 𝑜𝑓 𝑒𝑎𝑡 𝑓𝑙𝑜𝑤 𝑜𝑢𝑡 𝑜𝑓 𝑑𝑖𝑓𝑓𝑒𝑟𝑒𝑛𝑡𝑖𝑎𝑙 𝑒𝑙𝑒𝑚𝑒𝑛𝑡 = 𝐴𝐿𝐻𝐿 𝑅𝑎𝑡𝑒 𝑜𝑓 𝑒𝑎𝑡 𝑓𝑙𝑜𝑤 𝑑𝑢𝑒 𝑡𝑜 𝑚𝑎𝑠𝑠 𝑡𝑟𝑎𝑛𝑠𝑓𝑒𝑟 𝑖𝑛𝑡𝑜 𝑑𝑖𝑓𝑓𝑒𝑟𝑒𝑛𝑡𝑖𝑎𝑙 𝑒𝑙𝑒𝑚𝑒𝑛𝑡 = − 𝐺𝑑𝑌𝐶𝑂2 𝐶 𝑃 𝐶𝑂2 𝑇𝐺 − 𝑇𝑂 + 𝐺𝑑𝑌𝐶𝑂2 𝐻 𝑂𝑆 𝐴 − 𝐺𝑑𝑋 𝑀𝐷𝐸𝐴 𝐶 𝑃 𝑀𝐷𝐸𝐴 𝑇𝐺 − 𝑇𝑂 + 𝐺𝑑𝑋 𝑀𝐷𝐸𝐴 𝐻 𝑉 𝐴 𝑅𝑎𝑡𝑒 𝑜𝑓 𝑒𝑎𝑡 𝑡𝑟𝑎𝑛𝑠𝑓𝑒𝑟𝑒𝑑 𝑓𝑟𝑜𝑚 𝑙𝑖𝑞𝑢𝑖𝑑 𝑡𝑜 𝑔𝑎𝑠 𝑝𝑎𝑠𝑒 𝑖𝑛 𝑑𝑖𝑓𝑓𝑒𝑟𝑒𝑛𝑡𝑖𝑎𝑙 𝑒𝑙𝑒𝑚𝑒𝑛𝑡 = −𝑞 𝐺 𝑎𝑑𝑧 = − 𝐺 𝑎 𝑇𝐺 − 𝑇𝐿 𝐴𝑑𝑧 Substituting these expressions into equation (9) gives: 𝐿 + 𝑑𝐿 𝐻𝐿 + 𝑑𝐻𝐿 𝐴 − 𝐺𝑑𝑌𝐶𝑂2 𝐶 𝑃 𝐶𝑂2 𝑇𝐺 − 𝑇𝑂 + 𝐺𝑑𝑌𝐶𝑂2 𝐻 𝑂𝑆 𝐴 − 𝐺𝑑𝑋 𝑀𝐷𝐸𝐴 𝐶 𝑃 𝑀𝐷𝐸𝐴 𝑇𝐺 − 𝑇𝑂 + 𝐺𝑑𝑋𝑀𝐷𝐸𝐴𝐻𝑉𝐴=𝐴𝐿𝐻𝐿− 𝐺𝑎𝑇𝐺− 𝑇𝐿𝐴𝑑𝑧(17) Simplifying equation (17) yields: 𝐿𝑑𝐻𝐿 = 𝐺𝐶 𝑃 𝐶𝑂2 𝑇𝐺 − 𝑇𝑂 + 𝐺𝐻 𝑂𝑆 𝑑𝑌𝐶𝑂2 + 𝐺𝐶 𝑃 𝑀𝐷𝐸𝐴 𝑇𝐺 − 𝑇𝑂 + 𝐺𝐻 𝑉 𝑑𝑋 𝑀𝐷𝐸𝐴 − 𝐺 𝑎 𝑇𝐺 − 𝑇𝐿 𝑑𝑧 (18) Let 𝐻𝐿 = 𝐶 𝑃 𝐿 𝑇𝐿 and 𝑑𝐻𝐿 = 𝐶 𝑃 𝐿 𝑑𝑇𝐿 (19) Substituting equation (19) into (18) and rearranging yields: 𝐿𝐶 𝑃 𝐿 𝑑𝑇 𝐿 𝑑𝑧 = 𝐺𝐶 𝑃 𝐶𝑂2 𝑇𝐺 − 𝑇𝑂 + 𝐺𝐻 𝑂𝑆 𝑑𝑌 𝐶𝑂2 𝑑𝑧 + 𝐺𝐶 𝑃 𝑀𝐷𝐸𝐴 𝑇𝐺 − 𝑇𝑂 − 𝐺𝐻 𝑉 𝑑𝑋 𝑀𝐷𝐸𝐴 𝑑𝑧 − 𝐺 𝑎 𝑇𝐺 − 𝑇𝐿 (20) Substituting equations (7) and (8) into equation (20) and rearranging gives: 𝑑𝑇 𝐿 𝑑𝑧 = − 𝐺𝐶 𝑃 𝐶𝑂2 𝑇𝐺 − 𝑇𝑂 + 𝐺𝐻 𝑂𝑆 𝐾 𝐺 𝑌 𝐶𝑂2− 𝑌 𝐶𝑂2,𝑒 𝑎 𝐺𝐿𝐶 𝑃 𝐿 − 𝐺𝐶 𝑃 𝑀𝐷𝐸𝐴 𝑇𝐺 − 𝑇𝑂 − 𝐺𝐻 𝑉 𝐾 𝑀𝐷𝐸𝐴 𝑋 𝑀𝐷𝐸𝐴 − 𝑋 𝑀𝐷𝐸𝐴 ,𝑒 𝑎 𝐺𝐿𝐶 𝑃 𝐿 − 𝐺 𝑎 𝑇 𝐺− 𝑇 𝐿 𝐿𝐶 𝑃 𝐿 (21)