Analysis of Emission from Petrol Vehicles in the Koforidua Municipality, Ghana

Koforidua has seen its fair share in the increase in the number of cars on its roads over the past decade. This has resulted in progressive increase in traffic congestion on the roads and could lead to deterioration in the air quality. Exhaust gas emissions from a total of 104 vehicles were tested with an exhaust gas analyzer. Hydrocarbons (HC), Carbon dioxide (CO2) and Carbon monoxide (CO) were measured and compared with EU standards for gasoline vehicles and Auto Data Technical information. A series of algorithms developed using Microsoft Excel Spread Sheet were used to analyze the data collected. Out of the total number of cars tested, 74 and 80 cars passed the HC and CO tests respectively. 10 cars out of the total were rated as good under CO2 test. In total, 69.5% of the cars tested passed the various tests conducted and about 73 cars representing 70.2% of the cars tested were over 10 years and the emission standards for those years were flexible.

Recommended
Recommended
More Related Content
Viewers also liked
Viewers also liked (20)
Similar to Analysis of Emission from Petrol Vehicles in the Koforidua Municipality, Ghana
Similar to Analysis of Emission from Petrol Vehicles in the Koforidua Municipality, Ghana (20)
Recently uploaded
Recently uploaded (20)
Analysis of Emission from Petrol Vehicles in the Koforidua Municipality, Ghana
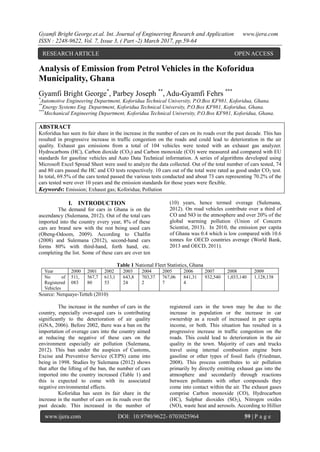
- 1. Gyamfi Bright George.et.al. Int. Journal of Engineering Research and Application www.ijera.com ISSN : 2248-9622, Vol. 7, Issue 3, ( Part -2) March 2017, pp.59-64 www.ijera.com DOI: 10.9790/9622- 0703025964 59 | P a g e Analysis of Emission from Petrol Vehicles in the Koforidua Municipality, Ghana Gyamfi Bright George* , Parbey Joseph ** , Adu-Gyamfi Fehrs *** * Automotive Engineering Department, Koforidua Technical University, P.O.Box KF981, Koforidua, Ghana. ** Energy Systems Eng. Department, Koforidua Technical University, P.O.Box KF981, Koforidua, Ghana. *** Mechanical Engineering Department, Koforidua Technical University, P.O.Box KF981, Koforidua, Ghana. ABSTRACT Koforidua has seen its fair share in the increase in the number of cars on its roads over the past decade. This has resulted in progressive increase in traffic congestion on the roads and could lead to deterioration in the air quality. Exhaust gas emissions from a total of 104 vehicles were tested with an exhaust gas analyzer. Hydrocarbons (HC), Carbon dioxide (CO2) and Carbon monoxide (CO) were measured and compared with EU standards for gasoline vehicles and Auto Data Technical information. A series of algorithms developed using Microsoft Excel Spread Sheet were used to analyze the data collected. Out of the total number of cars tested, 74 and 80 cars passed the HC and CO tests respectively. 10 cars out of the total were rated as good under CO2 test. In total, 69.5% of the cars tested passed the various tests conducted and about 73 cars representing 70.2% of the cars tested were over 10 years and the emission standards for those years were flexible. Keywords: Emission; Exhaust gas; Koforidua; Pollution I. INTRODUCTION The demand for cars in Ghana is on the ascendancy (Sulemana, 2012). Out of the total cars imported into the country every year, 8% of these cars are brand new with the rest being used cars (Obeng-Odoom, 2009). According to Chalfin (2008) and Sulemana (2012), second-hand cars forms 80% with third-hand, forth hand, etc. completing the list. Some of these cars are over ten (10) years, hence termed overage (Sulemana, 2012). On road vehicles contribute over a third of CO and NO in the atmosphere and over 20% of the global warming pollution (Union of Concern Scientist, 2013). In 2010, the emission per capita of Ghana was 0.4 which is low compared with 10.6 tonnes for OECD countries average (World Bank, 2013 and OECD, 2011). Table 1 National Fleet Statistics, Ghana Year 2000 2001 2002 2003 2004 2005 2006 2007 2008 2009 No of Registered Vehicles 511, 083 567,7 80 613,1 53 643,8 24 703,37 2 767,06 7 841,31 4 932,540 1,033,140 1,128,138 Source: Nerquaye-Tetteh (2010) The increase in the number of cars in the country, especially over-aged cars is contributing significantly to the deterioration of air quality (GNA, 2006). Before 2002, there was a ban on the importation of overage cars into the country aimed at reducing the negative of these cars on the environment especially air pollution (Sulemana, 2012). This ban under the auspices of Customs, Excise and Preventive Service (CEPS) came into being in 1998. Studies by Sulemana (2012) shows that after the lifting of the ban, the number of cars imported into the country increased (Table 1) and this is expected to come with its associated negative environmental effects. Koforidua has seen its fair share in the increase in the number of cars on its roads over the past decade. This increased in the number of registered cars in the town may be due to the increase in population or the increase in car ownership as a result of increased in per capita income, or both. This situation has resulted in a progressive increase in traffic congestion on the roads. This could lead to deterioration in the air quality in the town. Majority of cars and trucks travel using internal combustion engine burn gasoline or other types of fossil fuels (Friedman, 2008). This process contributes to air pollution primarily by directly emitting exhaust gas into the atmosphere and secondarily through reactions between pollutants with other compounds they come into contact within the air. The exhaust gases comprise Carbon monoxide (CO), Hydrocarbon (HC), Sulphur dioxides (SO2), Nitrogen oxides (NO), waste heat and aerosols. According to Hillier RESEARCH ARTICLE OPEN ACCESS
- 2. Gyamfi Bright George.et.al. Int. Journal of Engineering Research and Application www.ijera.com ISSN : 2248-9622, Vol. 7, Issue 3, ( Part -2) March 2017, pp.59-64 www.ijera.com DOI: 10.9790/9622- 0703025964 60 | P a g e et. al. (2006), these exhaust gases result in serious health implications such as respiratory problems and may cause death upon exposure to large concentrations. As a result of health implications of the release of these pollutants into the environment, various emission control legislations has been introduced since 1960 with define limits for gasoline and diesel engines, as well as test procedures employed to confirm compliance to curb or to minimize their emissions (Dietsche, Klingebiel and Bosch, 2007). A complete combustion process in internal combustion engines results in combustion of all the carbon present if the theoretical quantity of air is supplied, resulting in the production of CO2 and water only. However, the combustion process in internal combustion engines does not result in complete combustion of all the carbon present if the theoretical quantity of air is supplied (Zammit, 1987). This is due to insufficient mixing of the carbon-air mixture in the cylinder before combustion. Instead, a mixture of CO and CO2, hydrocarbons (HC) and oxides of nitrogen (NOx) are produced in addition to other harmful gases (Hillier, Coombes and Rogers, 2006). Complete combustion can only be achieved when excess air is supplied. Efforts have been made over the years to control emissions from engines to curb pollution and its effect thereof. There have been various legislations and regulations to control emissions levels (Hillier, Coombes and Rogers (2006), Denton (2006), Rosen and Erwin (1975) and Hughes, Martz and Denton (1990)). These include the provision of catalytic converters, positive crankcase ventilation (PCV) systems, provision of secondary air injection systems, elimination of the use of leaded fuels, etc., these measures lead to the reduction and some cases total elimination of harmful gases emitted into the environment. The use of hybrid vehicles are also been encouraged due to their low emissions, low fuel consumption and the elimination of idle-at-rest. Pollutions are due to vehicular emissions that contribute to air quality problems, smog and global warming (Gyamfi, 2011). These can be overcome by using pollution control technologies that eliminate emissions of dangerous gases on vehicles, fuel efficient vehicles that burn less fuel, zero-emission vehicles and switching to cleaner fuels i.e. using sulphur free fuels, LPG, hydrogen and other renewable energies (Friedman, 2008). II. MATERIALS AND METHODS Exhaust gases of a total of one hundred and four (104) petrol engine vehicles were sampled over a period of ten (10) days. These vehicles include seventy-four (74) petrol engine vehicles sampled at the Driver and Vehicle Licensing Authority (DVLA), Ghana, undergoing road worthiness test and certification, and thirty (30) petrol engine vehicles at the Koforidua Polytechnic Automotive Engineering Workshop, Ghana, undergoing routine maintenance and servicing. The vehicles brand names include Opel, Hyundai, VW, Toyota, KIA, Nissan, Renault, Mitsubishi, Land Rover, Daewoo, Volvo, Mazda, Geo Prism, Mercedes Benz and Ford. The exhaust gases from these vehicles were analyzed using Tecalmit Garage 4000 (TG4000) exhaust gas analyzer. Autodata, computer software, was used to obtain the technical details of the vehicles tested. The TG4000 is designed to measure CO, CO2, unburned HC, the air fuel ratio indicated by Lambda and oxygen (O2) simultaneously in the exhaust gases of petrol engines. A series of algorithms developed using Microsoft Excel Spread Sheet were used to analyze the data collected. 2.1 Experimental Procedure The TG4000 analyzer was switched on for about five (5) minutes for the instrument to go through preheating and calibration stages. A leak test (which is part of the process in carrying out the emission test) followed by a hydrocarbon residual test was performed. A cable from the analyzer was then attached to one spark plug lead and then earth. This is done for the analyzer to read the idling speed of the engine. A probe from the TG4000 is inserted to the dip stick hole to record the temperature of the engine and another probe is inserted into the exhaust tail pipe as the engine runs on idling speed. No measurement was performed until the temperature was above 80°C. The manufacturer’s manual for the use of the testing equipment requires that the testing be done at temperatures above 80°C. The constituents of the exhaust gas are displayed on the screen of the analyzer. III. RESULTS 3.1 Emission Standards The European Union (EU) has emission standards (Table 2) that manufacturers of vehicles must adhere to. According to the Environmental Protection Agency, Ghana, Ghana does not have motor vehicle emission standards but are in the process of developing emission standards and regulations for the country (Zammit, 1987).
- 3. Gyamfi Bright George.et.al. Int. Journal of Engineering Research and Application www.ijera.com ISSN : 2248-9622, Vol. 7, Issue 3, ( Part -2) March 2017, pp.59-64 www.ijera.com DOI: 10.9790/9622- 0703025964 61 | P a g e Table 2 European Union Emission Standards GASOLINE AS FROM CO HC NOx Euro 1 1/7/1992 4.05 0.66 0.49 Euro 2 1/1/1996 3.28 0.34 0.25 Euro 3 1/1/2000 2.30 0.20 0.15 Euro 4 1/1/2005 1.00 0.10 0.08 Source: (http://www.adb.org/documents/guidelines/vehicle_emissions/im_ch07.pdf) EU emission standards for gasoline were adopted for this study. This standard was compared with the measurement data taken using the Autodata. 3.2 Vehicle Classifications From the TG4000 and the Autodata, out of the one hundred and four (104) vehicles sampled from Koforidua Municipality and used in the study, thirty eight (38) of the vehicles tested fell under Euro 1 (1990-1995) emission standard, thirty five (35) under Euro 2 emission standard (1996-1999), twenty-five (25) under Euro 3 (2000-2004) emission standard and six (6) under Euro 4 (2005) standards as shown in Figure 1 below. Figure 1: Number of vehicles tested and classification 3.3 Hydrocarbon Emission The test and analysis showed that out of the total number of cars sampled and tested, seventy-four (74) representing 71.2% passed the emission limit test and thirty (30) representing 28.9% failed. Out of forty (40) vehicles tested and analyzed, 32 representing 80% were found to have HC emission level within the acceptable and eight (8) vehicles representing 20% were found to emit HC which are not acceptable under Euro 1 standards. Under Euro 2 standards, a total of twenty-two (22) cars tested and analyzed, fourteen (14) representing 63.6% passed and eight (8) representing 36.4% failed. Also under the Euro 3 standards, thirty-four (cars) were sampled and tested with twenty-two (22) cars (i.e. 64.7%) passed and the remaining twelve (12) cars (i.e. 35.3%) failed. Finally, for eight (8) cars sampled and tested, six (6) presenting 75% passed and two (2) failed under the Euro 4 emission limit standards. The detailed results from the unburned HC analysis are presented in Figure 2 below.
- 4. Gyamfi Bright George.et.al. Int. Journal of Engineering Research and Application www.ijera.com ISSN : 2248-9622, Vol. 7, Issue 3, ( Part -2) March 2017, pp.59-64 www.ijera.com DOI: 10.9790/9622- 0703025964 62 | P a g e Figure 2: Test results for HC emissions by cars analyzed under Euro standards 3.4 Carbon monoxide (CO) Emission CO emission test conducted indicated that eighty (80) representing 76.9% of cars sampled passed the limit test and the remaining twenty-four (24) representing 23.1% failed. Figure 3 below shows a graphical analysis of the study conducted on carbon monoxide emission. The figure indicates the number of vehicles tested the number that passed and the number of vehicles that failed the test. In all, Euro1 tested forty (40) cars making 62.5% passed leaving 37.5% failing. Under Ero2, 22 cars making 68.18% passed with 31.82%failing. Euro3 cars had 91.1% passing with 0.9% failing. With Euro4 cars, 87.5% passed and 12.5% failed. Figure 2 Test results for CO emissions by cars analyzed under Euro standards 3.5 Carbon dioxide (CO2) Emissions Carbon dioxide is presently not classified as a pollutant, but it is a greenhouse gas which plays a role in global warming. For complete combustion, the carbon dioxide released into the atmosphere must be between 14 – 16% per volume at idling speed as indicated in the Table 3 below. Table 4 shows the number of cars which were tested and their ratings. Table 3: Auto Data Technical information for Carbon dioxide and idling speed Idle Speed Carbon dioxide emission at Idling speed per volume 600 – 1000 rpm 14.5 – 16% Table 4: Test results for CO2 emissions by cars analyzed under Euro standards Emission Standards Number of Cars Good Rating 14% vol. and above Fair Rating 10% vol. and above Poor Rating Below 10% vol. Euro 1 41 0 13 28
- 5. Gyamfi Bright George.et.al. Int. Journal of Engineering Research and Application www.ijera.com ISSN : 2248-9622, Vol. 7, Issue 3, ( Part -2) March 2017, pp.59-64 www.ijera.com DOI: 10.9790/9622- 0703025964 63 | P a g e Euro 2 24 2 19 3 Euro 3 27 2 23 2 Euro 4 12 6 6 0 TOTAL 104 10 61 33 Percentage 100% 9.6% 58.7% 31.7% IV. DISCUSSIONS 4.1 Hydrocarbons Circumstances that may lead to a high hydrocarbons emission were: Incomplete combustion due to fouled spark plugs, Vacuum leaks and Ineffective or faulty air management systems. A total number of one hundred and four (104) cars were tested out of which 74 representing 71.17% passed hydrocarbon emission test and 30 cars representing 28.85% failed the test. Although majority of the cars tested passed the test, there is still a danger as the number which failed is large enough to cause hydrocarbon emission related health problems. 4.2 Carbon Monoxide Carbon monoxide is poisonous to human beings when inhaled. Carbon monoxide adheres to hemoglobin in the blood and prevents oxygen from being carried to the body cells [10]. Out of the one hundred and four (104) cars tested, 80 representing 76.9% passed and twenty four (24) representing 23.1% failed the test. The newer cars fitted with modern emission devices such as catalytic converters, positive crankcase ventilation and evaporative emission control systems, which reduces emission had the greater number percentage passed. 4.3 Carbon dioxide Carbon dioxide is a product of complete or efficient combustion representing approximately 13.7% of the exhaust gas is not regarded as a harmful pollutant but is now of great concern. Carbon dioxide has an influence on global warming. The more complete the combustion of fuel, the greater the level of carbon dioxide. The only effective way of reducing the production of carbon dioxide is to reduce the consumption of fuel (Hillier, et al 2006). Out of the one hundred and four (104) tested cars, 9.6% were rated as good, 58.7% were rated as fairly good and 31.7% were also rated as poor. This indicates that major of the cars tested have their CO2 emission level being fairly good. V. CONCLUSION The research revealed that 69.5% of the cars tested passed the various test conducted due to the fact that the majority of the cars sampled were found to be in the Euro 1 and Euro 2 categories, that is to 70.2% of the cars tested were over ten (10) years of age and the emission standards requirements for cars manufactured during that period is quite flexible (Gyamfi, 2011). Information from the Driver and Vehicle Licensing Authority indicates that there are more of the older cars on the roads in Ghana and this is dangerous to the health and the economy since the emission standards that is been used today is Euro 4 (Chalin (2008), Obeng-Odoom (2009), Gyamfi (2011) and Suleman (2012)). This implies that there is increased pollution of our environment and hence increased exposure of the general populace to the negative effects of these pollutants leading to health issues with associated long term effects on the economy. The study also revealed that Ghana as a country has no emission standards at the moment and that the environmental Protection Agency (EPA), Ghana is in the process of coming out with a national emission standards. Although the emission per capita of Ghana is far less than the minimum allowed emission per capita, the EPA, Ghana has to come out with emission standards as quickly as possible to help curb the growing levels of pollutants in the air. REFERENCES [1]. Chalfin, B. (2008). Cars, the Customs Service, and Sumptuary Rule in Neoliberal Ghana, Comparative Studies in Society and History, 50(2), 424-453. [2]. Denton, T. (2006). Advance Automotive Fault Diagnosis 2nd Edition P. 61 – 64. Elsivier Blutterworth-Heinemann Publishers. Compact Disk (CD) Edition. [3]. Dietsche, K., Klingebiel, M. and Bosch, R. (2007). Automotive handbook 7th ed., Wiley Publishers. Plochingen:Bosch, p566 – 594. [4]. Friedman, D (2008) Vehicular Pollution, http://www.pollutionissues.com/Ve- Z/Vehicular-Pollution.html. Accessed on 20th December, 2014. [5]. GNA, (2006). .Air quality in Accra deteriorates, Ghana News Agency (GNA), 24th June, 2006, A news article carried on http://www.modernghana.com/news/1007 26/1/air-quality-in-accra-deteriorates.html, Assessed on 20th December, 2014. [6]. Gyamfi, G. B. (2011). Analysis of Emission from Petrol Vehicles in the Koforidua Municipality, Ghana, An
- 6. Gyamfi Bright George.et.al. Int. Journal of Engineering Research and Application www.ijera.com ISSN : 2248-9622, Vol. 7, Issue 3, ( Part -2) March 2017, pp.59-64 www.ijera.com DOI: 10.9790/9622- 0703025964 64 | P a g e MTech thesis, University College of Education (UCE), Mechanical Engineering Department, Kumasi, Ghana; 2011. [7]. Hillier, V.A.W, Coombes, P and Rogers, D.R. (2006) Fundamentals of Motor Vehicle Technology (Powertrain Electronics) 5th edition, London, Nelson Thornes, p.38 – 127. [8]. Hughes, K. Martz, L., & Denton. (1990). The Air Resources Board's Risk, Engineering Symposium, California USA, December 1990. pp.8 [9]. Nerquaye-Tetteh, E., (2010). Vehicular Emissions Reduction Programme in Ghana, A PowerPoint presentation, www.unep.org/transport/pcfv/PDF/Abidja n_9GHANA.pdf. Assessed on 24th December, 2014. [10]. Obeng-Odoom, Franklin. (2009). Drive left, look right: the political economy of urban transport in Ghana, International Journal of Urban Sustainable Development, Volume 1, Nos. 1-2, May- November 2009, pp 33-48. [11]. OECD Environmental Outlook to 2050 (2011). Climate Change, Chapter 3, Pre- release version, November, 2011, Organization for Economic Co-operation and Development (OECD). www.oecd.org/env/cc/49082173.pdf, assessed on 23rd December, 2014 [12]. Rosen, E and Erwin, M., (1975). The Peterson automotive trouble shooting & repairs manual. Grosset & Dunlap, Inc. [13]. Sulemana, I. (2012): Assessing Over-aged Car Legislation as an Environmental Policy Law in Ghana, International Journal of Business and Social Science, Vol. 3 No. 20 (Special Issue – October 2012) [14]. The World Bank (2013). CO2 Emissions. http://data.worldbank.org/indicator/EN.A TM.CO2E.PC, Assessed on 23rd December, 2014. [15]. Union of Concern Scientist (2013). Clean Vehicles, http://www.ucsusa.org/clean_vehicles/wh y-clean-cars/air-pollution-and-health/cars- trucks-air-pollution.html. [16]. Zammit, S.J (1987). Motor vehicle engineering science for technicians, Addison Wesley Longman, Essex, England, Low-Priced Edition, Reprinted in 1997, ISBN 0 582 30571 3.