SlideShare a Scribd company logo
1 of 13
Download to read offline
International Journal of Database Management Systems ( IJDMS ) Vol.9, No.3, June 2017
DOI : 10.5121/ijdms.2017.9304 57
SIMPLIFYING DATABASE NORMALIZATION WITHIN
A VISUAL INTERACTIVE SIMULATION MODEL
Dr. Belsam Attallah
Senior Fellow, Higher Education Academy (HEA), UK
Member, British Computer Society (BCS), UK
Assistant Professor, Department of Computer Information Science, Higher Colleges of
Technology (HCT), United Arabs Emirates
ABSTRACT
Although many researchers focused on investigating the challenges of database normalization, and
suggested recommendations on easing these challenges, this process remained an area of concern to
database designers, developers, and learners. This paper investigated these challenges and involved
Higher Education in Computer Science students learning database normalization, as they could well
represent beginning database designers/developers, who would struggle in effectively normalize their
database design due to the complexity of this theoretical process, which has no similar real-life
representation. The paper focused on the advantages of interactive visualization techniques to simplify
database normalization, and recommended virtual world technologies, such as ‘Second Life’, as an
effective platform to achieve this visualization via a simulated model of a relational database system. The
simulation technique presented in this paper is novel, and is supported by extensive evidence on its
advantages to achieve an illustration of the ‘Normal Forms’ and the need for them.
KEYWORDS
Database Normalization; Database Normalisation; Normal Forms; Visualization; Visualisation; Visual;
Virtual Worlds; Second Life; Virtualization; Virtualisation.
GOALS AND METHODS
The goals of this research are to assemble literature related to the difficulties faced in the
understanding and implementation of database normalization by beginning designers and
developers, to investigate the advantages of visualization and interactivity to this process and to
recommend an effective simulation technique to achieve this visualization. For this, Higher
Education in Computer Science students have been selected for this research activities.
Both quantitative and qualitative research methods were applied to achieve the outcomes of this
research (questionnaires, observations and students’ feedback). An intensive literature review has
been carried out to document the problem formulation, and to support the research outcomes and
recommendations.
1. INTRODUCTION
There is significant research acknowledging the level of complexity in the database normalization
process, and how this issue forms a cause of concern not only for beginning database designers
and developers, but also for Higher Education (HE) students studying this process in their
university studies. To this regard, Folorunso et al. (2010, p. 25) confirmed that “relational data
model theory (normalization) tends to be complex for the average designers”. Research also
International Journal of Database Management Systems ( IJDMS ) Vol.9, No.3, June 2017
58
revealed that the difficulty involved in the understanding and implementation of this process
caused students’ poor achievement in their HE Computer Science database modules. Gaikwad et
al. (2017) highlighted that database normalization is a complex theoretical process that is hard to
understand by learners, which does not facilitate encouraging people to lean it.
This paper focuses on identifying the challenges faced in the analysis, understanding and learning
of database normalization process and its ‘Normal Forms’, and provides recommendations on the
techniques and platforms needed to overcome these challenges. Visualization, simulation and
interactivity were the aspects explored and recommended by this paper to facilitate and enhance
the comprehension and interpretation of this process in order to support novice database designers
and learners.
2. DIFFICULTIES OF DATABASE NORMALIZATION
2.1 WHAT IS ‘DATABASE NORMALIZATION’
According to Caplice et al. (2017) database normalization is a fundamental component of
database management related to organizing data elements into relational tables in order to
improve data integrity and reduce data redundancy. Database normalization prevents data
inconsistencies, wasted storage, incorrect and outdated data.
Tutorialspoint (2017) clarified that the database normalization process ensures an efficient
organization of data in database tables, which results in guaranteeing that data dependencies make
sense, and also reducing the space occupied by the database via eliminating redundant data. The
source added that this process is divided into three ‘Normal Forms’, each of which represent the
guidelines of how the database structure is designed/organized at that particular level. It is
possible, however, to go beyond the 3rd
Normal Form to the 4th
, 5th
… etc. in large and
complicated databases, yet, research showed that normalizing a database to the 3rd
Normal Form
is sufficient.
Demba (2013) defined database normalization as the process needed in a relational database,
which organizes data and minimizes its redundancy. The source clarified that the normalization
process involves classifying the data into two or more tables, where relationships are defined to
connect the tables so that any modifications to the data (additions, deletions, alterations) in one
table will then disseminate to the rest of the tables within the database via the defined
relationship(s). Demba (2013, p. 39) added that the database normalization concept and its
‘Normal Forms’ were originally invented by Edgar Codd, the inventor of the relational model,
and that the ‘Normal Forms’ provide “the criteria for determining a table's degree of
vulnerability to logical inconsistencies and anomalies. The higher the normal form applicable to
a table, the less vulnerable it is”.
Looking more into the background of database normalization, Malaika et al. (2012, p. 3) clarified
that database normalization was first introduced in 1970s. They defined database normalization as
“a methodology that minimizes data duplication to safeguard databases against logical and
structural problems, such as data anomalies”. They added that the normalization process ensures
that any data element, such as name, age, address, product information…etc. appears only one
time on the disk in order to save storage space and avoid data inconsistencies.
International Journal of Database Management Systems ( IJDMS ) Vol.9, No.3, June 2017
59
2.2 RESEARCHERS ACKNOWLEDGING THE DIFFICULTIES FACED BY DATABASE
DESIGNERS AND LEARNERS IN UNDERSTANDING AND IMPLEMENTING DATABASE
NORMALIZATION
Research revealed that a number of tools were designed to support the understanding, learning
and implentation of database normalization, regardless of which, the subject remained an issue of
concern when aiming to achieve an effectively normalized database system. Wingenious (2005)
confirmed that besides being a complex subject to learn, database normalization is a critical part
of an effective database design, which is vital in guaranteeing data integrity and eliminating data
redundancy in a database system. Alappanavar et al. (2013) supported this by explaining how
difficult it is to motivate students to learn database normalization because they consider this
subject to be dry and purely theory-based. They clarified that the more the database grows, the
more difficult it becomes to manually handle the normalization process.
Tutani (2015, p. 218) highlighted that it is challenging to teach conceptual database design to
novice learners, in addition to being challenging for educators as well. The author added that
“normalization of relations, from first to higher normal forms is often a problematic concept for
students to understand”. Due to the strong mathematical jargons in the normalization process, the
author added, even HE learners at higher levels of databases’ programmes still find it challenging
to conceptualize the process, as the difficulty persists at all levels.
In the same regard, Folorunso et al. (2010, p. 26) confirmed that students in tertiary academic
institutions find it difficult to learn the subject of database design theory, and in particular, the
database normalization process, as “the normalization algorithms often require extensive
relational algebraic backgrounds that most computer science students lack”. They also clarified
that researchers and educators in the databases field emphasized the complexity of this process
throughout the years since the introduction of Codd’s (1970) seminal work on ‘Database Normal
Forms’. They highlighted that the database normalization process is not only a cause of poor
designer performance, but it is also a challenging subject to teach.
In a study carried out on the engineering students of SzentIstván University, Hungary, Czenky
(2014) defined the process of database normalization as being a principal database design
method. However, she added, the students found the understanding and application of this method
problematic and challenging. She explained the outcomes of the survey carried out for this in the
university in 2008, where 54 students participated. The survey revealed that 69.6% of students
found database normalization as the most difficult subject. She also compared the outcomes of
this survey to a similar one carried out at the University of Ulster, Northern Ireland, where the
students were given the opportunity to select from (very difficult, difficult, easy and very easy)
options. The summation of ‘very difficult’ and ‘difficult’ choices for the database normalization
subject was 84.6% of the students.
The difficulty of the theory concepts in the database normalization process was also explained by
Kung et al. (2006), who suggested designing a web-based tool to provide the learners with an
interactive hands-on experience to improve the understanding and implementation of this process.
They clarified the difficulty they faced in motivating their students, who considered it such a dry
and theoretical subject, to learn the process. They added that the results of the survey carried out,
in a junior level ‘Systems Analysis and Design’ course, to record students’ feedback, confirmed
that the learners generally viewed the web-based tool more positively than the database
normalization techniques in the textbook.
Demba (2013, p. 39) highlighted that designers find the database normalization process difficult
and cumbersome, as violating any of the three ‘Normal Forms’ criteria of normalization exposes
International Journal of Database Management Systems ( IJDMS ) Vol.9, No.3, June 2017
60
the database system to problems, such as redundant data and inconsistent dependencies. The
source added that designers must also be aware of “partial and transitive dependencies on all
candidate keys and not just the primary key. This can make the process of normalization more
complex”.
2.3 RESEARCHERS REALIZING THE NEED FOR VISUALIZATION TO AID IN SIMPLIFYING
THE PROCESS OF DATABASE NORMALIZATION
A number of researchers acknowledged the need for visualization in this field. Gaikwad et al.
(2017, p. 1324) stated that “Some toolsets such as NORMIT, Web based Normalization Tool, etc.,
are specifically designed for learning/ teaching/ understanding the process of normalization,
since the process is difficult to understand and theoretical”. However, Patwardhan et al. (2010)
clarified that web-based normalization tools, such as NORMIT, do not provide visual aid for the
normalization process. Gaikwad et al. (2017) added that other available automatic normalization
tools, such as Formalizer, JMathNorm…etc., perform database normalization on the relational
level only, not on the conceptual level, which does not facilitate the full understanding and
learning of the normalization process.
Folorunso et al. (2010) highlighted the need for visualization to support the understanding and
implementation of database normalization process. They explained their adopted visualization
method, which was designed through a computer program built using C# programming language,
in which learners enter the database field titles and their properties in textboxes and press the
buttons available in the user-interface to produce the normalization form associated with each
stage. However, using this program did not enable the students to immerse in the process and
generate the normalization forms themselves. Although this technique demonstrated simple/basic
visualization, Folorunso et al. (2010) still confirmed that this visualization idea caused the
students to view this experience more positively than the textbook technique.
Ochs (2010) explained a more advanced visualization attempt in this field in USA, which was
carried out in virtual worlds. However, this attempt was to use the 3D virtual world environment
to teach an introductory database course to Master of Science in Database Technology students in
order to reduce the time needed to learn database concepts. The 3D model built for this purpose
handled preliminary database aspects to enable students to create a Microsoft Access inventory
database. It did not particularly focus on visualizing the challenging theory concepts of database
normalization. The virtual model was a purposely furnished house in the virtual world of ‘Second
Life’, with descriptions and notecards attached to different furniture objects to provide the
students with information on the fields required per database table. The inventory database for
this house was rather simple and did not require a major normalization process. Ochs (2010)
clarified that students’ feedback showed that 75% of them agreed that this model reduced the
time needed to learn these concepts.
According to Taofiki et al. (2011, p. 4), a web-based learning environment was designed by
Nikolay Georgiev in 2007 called LDBN (Learn Database Normalization) by using javascript and
Ajax. In this platform, students are able to test their information on the relational database
normalization subject online via choosing an assignment submitted by the lecturer and try to
solve it. However, “LDBN cannot handle multi-valued dependencies (MVD) and thus cannot
handle higher normal forms such as 4NF and above”. Taofiki et al. (2011) highlighted another
attempt to visualize database normalization in 2009, which was carried out by Murray
&Guimaraes. This attempt was in the form of ‘Animated Courseware Support for Teaching
Database Design’, which provided supporting material for teaching database design concepts;
however, it did not actually aim at visualizing the process itself to facilitate its understanding and
International Journal of Database Management Systems ( IJDMS ) Vol.9, No.3, June 2017
61
learning. Taofiki et al. (2011) explained their own developed visualization tool, from 2008-2010,
which was also used as an assessment instrument to support the teaching of database
decomposition techniques. This was a software tool, with a user interface that includes a number
of textboxes for students to fill-in with field names/types of a database, which again did not focus
on the visualization of the actual normalization process.
In the above explained literature review, there was no real visualization-focused tool that adopted
simulation and fostered interactivity to simplify the process of database normalization and
facilitate its understanding and implementation. This paper focuses on the employment of an
emerging computing technology to achieve an effective visualization of the database
normalization process, which presents a visual, user-friendly, interactive, collaborative,
experimental and engaging interface, in order to facilitate grasping the complex theoretical
concepts of database normalization.
3. THE APPLICATION OF VIRTUAL WORLD TECHNOLOGIES TO VISUALIZE
THE DATABASE NORMALIZATION PROCESS
This research focused on a different visualization technique to the ones mentioned in the earlier
sections. It involved the application of virtual world technologies to visualize complex theory
concepts of database normalization in order to support novice database designers and learners.
The research activities involved HE in Computer Science students in England, UK.
Purposely-built visualization scenarios were designed in the virtual world of ‘Second Life’ to
support the analysis and interpretation of challenging database normalization concepts as part of
the databases modules of HE in Computer Science, Year-1. These visualization scenarios were
programmed by the researcher using the programming language embedded within Second Life,
called ‘Linden Labs Scripting Language (LSL)’. The visualization and simulation of database
‘Normal Forms’, and the interactivity achieved within the virtual platform, facilitated the
understanding and effective implementation of the database normalization process to a high level.
In order to get an accurate comparison between the outcomes of understanding this process using
the visualized technique (in virtual worlds) and the non-visualized technique (in the physical
world), the researcher decided to divided the students into two groups, one to learn database
normalization in the physical world and the other in the virtual world. These groups were then
swapped to enable them to compare the advantages and limitations of learning the normalization
process within each environment.
As students’ grades could be used as a strong/valid indication of their learning and achievement,
the following approaches were followed in order to enable an accurate judgement of students’
benefits from visualizing the normalization process in virtual worlds, and also to avoid including
irrelevant data:
1. Where one (or more) of the course assessments, included in the calculation of
grades, does not involve the application of database normalization in virtual worlds,
their grades were not considered.
2. Where one (or more) of the assessments, included in the calculation of grades, was
carried out before using virtual worlds, their grades were also excluded.
The visualization of database normalization in virtual worlds was applied in a number of
database-related modules in the selected HE programme (as explained below), and a comparison
of outcomes was also carried out in order to provide further evidence on the advantages and
limitations of this technique and the suggested recommendations.
International Journal of Database Management Systems ( IJDMS ) Vol.9, No.3, June 2017
62
In order to visualize the complex theory concepts of the database normalization process, a clear
real-life example, which requires a large database system, was chosen for the virtual scenario.
This was a hospital that requires a database system to store and manage patients’ diagnosis and
treatment records.
Although the type of stored information on patients in a real-life hospital is obviously intuitive,
the aim, when the researcher designed the virtual scenario, was to put the students, virtually, in
the atmosphere of a real hospital situation. This was intended to inspire the students to investigate
the certain departments (within the hospital) that need to be referred to for information on the
database system in hand, and the correct approach to data exploration and gathering.
A sample hospital of two storeys was designed in Second Life. The first floor included the
reception area, the pharmacy department and a couple of consultant rooms, while the second floor
contained two patient wards of two different departments. There was a number of sign boards
distributed within the scenario displaying information on each department, and also some
metaphors of information givers, e.g. a telephone figure titled ‘Call for help’, which gives a
notecard when clicked explaining how the patient’s data is linked to that of the ward, and also a
drug bottle titled ‘Click for information’ which provides a notecard explaining the information
recorded for drugs in the pharmacy department. These explanations represented the fields
required in the patient, ward and drug tables within the hospital database system. In addition, a
number of ‘clues’ were distributed randomly within the scenario, e.g. signs and title of objects, to
encourage the students to explore all the areas of the virtual hospital investigating and seeking
data in order to get all the information they need to design the relational database system. Another
type of information was embedded in a bookshelf titled ‘Hospital Files’, the books of which had
individual URL links to published webpages that were purposely designed and scripted to provide
further information on the relationships between the data of different tables within the database
system. See Figures 3.1 and 3.2 below.
Figure 3.1: The Database Normalization virtual scenario (Weston Hospital)
International Journal of Database Management Systems ( IJDMS ) Vol.9, No.3, June 2017
63
Figure 3.2: The Database Normalization virtual scenario (Pharmacy Department)
This virtual scenario was designed to mirror the actual procedure that the database designer need
to follow when visiting a real hospital, i.e. exploring all the departments involved, investigating
sources of information, e.g. hospital records and staff members, and writing comments based on
their own observation of the hospital procedures and how patients’ data is processed.
Following collecting all the information needed for the hospital database example, the students
were provided with virtual sculptures of the database components so that they use them to design
a 3D visual representation of the database system. These sculptures represented the fields of
tables within the database, which students were required to use in order to normalize the
individual tables starting from the ‘1st
Normal Form’ and proceeding to the ‘3rd
Normal Form’.
See Figures 3.3 and 3.4 below.
Figure 3.3: The Database Normalization virtual scenario (sculptures representing table fields)
International Journal of Database Management Systems ( IJDMS ) Vol.9, No.3, June 2017
64
Figure 3.4: The Database Normalization virtual scenario (students normalizing database tables visually)
The students were required to move the sculptures (the data fields within the database) and re-
arrange them in rows (patients’ records) and columns (table fields) and keep adding, removing,
restructuring and separating sculptures throughout the Normal Forms. The observations by the
researcher confirmed that the students found the scenario extremely useful in visualizing why the
‘Three Normal Forms’ are necessary to improve data integrity within the tables and to eliminate
unnecessary duplication(s) and repetition within the data. This visualization enabled the
understanding of why the normalization process is vital for the success of a relational database
system and the critical need to an effective and logical design of its data tables. As students were
seeing the immediate outcomes of their structuring process of the database tables and fields, they
were able to see the impacts of certain aspects, e.g. data duplication and repetition, and
consequently were able to do the correct changes to the design of their tables to eliminate the
problems and successfully achieve a fully normalized database.
These observations by the researcher were then approved by the outcomes of the questionnaire
completed by the students following the virtual exercise regarding the enhancement to their
understanding, learning and implementation of this complex theory process.
As indicated earlier within this section, the HE students were divided into two groups, where both
groups received a basic introduction to the normalization process via talks by the lecturer and
some explanations on the whiteboard. This was then followed by delivering the whole
normalization exercise to the first group using the traditional method (in the physical world), and
the whole exercise to the second group using the visualized scenario (in the virtual world). The
two groups were then swapped to have the same exercise (in the following session) using the
other method, to enable them to have an effective comparison between their achievement within
each platform, and also to reflect more on the advantages and limitations of each environment,
e.g. engagement, collaboration, interactivity and affective quality.
The outcomes of the questionnaire distributed to Year-1 (Section-1) students to capture and
record their feedback are explained below. The results of the questionnaire showed that 53% of
the students considered database normalization as a difficult subject, however, only 49% of them
agreed that exercising the process in the virtual world environment enhanced their learning and
understanding of its complex theory concepts, while 57% of them agreed to enhanced affective
quality and 57% found this learning process more engaging (see Figure 3.5 below).
International Journal of Database Management Systems ( IJDMS ) Vol.9, No.3, June 2017
65
Figure 3.5: Statistics of Database Normalization, Year-1 (Section-1)
It is worth mentioning here that the researcher carried out some vital improvements to the
database virtual scenario following the first virtual exercise based on students’ feedback and
discussions following the exercise. This included providing more information on the types of
tables needed for the database and the fields within each of them. This facilitated the
understanding of the ‘Relational Database’ concept, which is fundamental in the database
normalization process. This resulted in more positive outcomes for the normalization exercises of
the subsequent Year-1 sections.
Moving to Year-1 (Section-2), and following the improvements made on the virtual scenario, a
different approach to recording students’ feedback was adopted compared to that in Year-1
(Section-1). Students’ feedback was captured and recorded before and after the application of
virtual world technologies to visualize the database normalization process.
The questionnaire produced the following outcomes (see Figure 3.6 below):
• Slightly more than half of the students who originally agreed that this subject is deemed
difficult changed their minds following practicing in the virtual world scenario.
• Twenty-two percent more students agreed that effective understanding and implementation of
the normalization process took place in virtual worlds, which facilitated their learning of its
complex theory concepts.
• Sixteen percent more students agreed that affective quality was enhanced.
• Twenty-three percent more students found virtual worlds more engaging when working on
the normalization process.
Figure 3.6: Statistics of Database Normalization, Year-1 (Section-2)
International Journal of Database Management Systems ( IJDMS ) Vol.9, No.3, June 2017
66
For a more in-depth comparison, and by looking again into the analysis achieved above for Year-
1 (Section-1), the researcher carried out further investigation to answer the questions in Table 3.1
below:
Table 3.1: Data correlation of the Database Normalization exercises, Year-1 (Section-1)
Moving to Year-1 (Section-2), the five questions were rephrased in order to reflect the additional
element of before and after the application of virtual world technologies that was added to the
questionnaire following the improvements on the original virtual scenario. The outcomes were as
in Table 3.2 below:
International Journal of Database Management Systems ( IJDMS ) Vol.9, No.3, June 2017
67
Table 3.2: Data correlation of the Database Normalization exercises, Year-1 (Section-2)
The above strong percentages were confirmed by the high module grades for Section-2, as shown
below (see table 3.3):
Note: Grade = (Average mark of the module / Average mark of all Computing modules * 100)
Table 3.3: Grades of the Databases module, Year-1
The Web Technologies module in Year-1 was another strong evidence on the advantages of
visualizing the database normalization process in virtual worlds. Within this module, students are
expected to program their website and also apply their understanding of database normalization in
their design of the online MySQL database required for their website. The database normalization
skills needed in this module were applied towards the end of the academic year in the web
practical project, which is the final assessment in this module. The grades of this practical
assessment clearly showed the development in students’ understanding and learning of the
database normalization complex theory concepts, which were re-applied as part of the web
project. The grades were as in Table 3.4 below:
Note: Grade = (Average mark of the module / Average mark of all Computing modules * 100)
Table 3.4: Grades of the Web Technologies module, Year-1
In addition to the above, the feedback received by the other HE lecturer delivering the theory of
database normalization using the traditional way, reinforced the fact that students’ understanding
and learning of the complex theory concepts of this process were noticeably, if not greatly,
enhanced following the visualization achieved in virtual worlds. This lecturer managed to observe
students’ performance and attitude before and after the application of virtual worlds. She said:
“…The virtual scenarios had a positive impact on areas of particular difficulty… The
visualization reinforced some of the more challenging concepts… Scenario ideas are a useful
addition to learning aids… The virtual world is a powerful tool that can be used to make the
constructs more memorable… Initial suspicion and some reluctance were gradually replaced by
interest and then acknowledgement of the value of this addition to their curriculum”. In
reinforcing the advantages of visualization, she added that as many people are visual learners,
“the virtual scenario helped them to understand the rules more fully and see the outcome of the
reduction of duplication that normalization brings… Students felt more able to attempt the
normalization process… It made a positive impact, and students were interested to see the change
International Journal of Database Management Systems ( IJDMS ) Vol.9, No.3, June 2017
68
in the objects following each stage of the normalization process... Objects and situations are
always much more interesting than raw data”.
4. CONCLUSION
Understanding the complex theory concepts of database normalization forms a cause of concern
to a large number of database designers and developers, in addition to people studying this field
at the HE level. Research revealed that these concerns are within the main reasons behind
achieving poorly or failing the modules that include database normalization concepts.
Research also showed a number of software and online tools, which aimed at illustrating the
process of database normalization for novice designers and learners; however, the majority of
them focused on automating the process rather than visualizing and simplifying it to facilitate its
understanding and effective implementation, which did not generate the degree of support needed
for this complex theory process.
This research demonstrated that there are strong indications of the advantages of visualizing
database normalization in virtual worlds, as this platform offers great benefits such as
interactivity, collaboration and experimentation, which are ideal for understanding and learning
the normalization process. This did not only cover enhancements to people’s understanding, but
also increased their engagement in the process, enhanced affective quality and improved their
achievement of effectively normalized database systems.
REFERENCES
[1] Alappanavar, P.B., Grover, R., Hunjan, S., Patil, D. and Girnar, Y. (2013) Automating the
normalization process for relational database model. International Journal of Engineering Research
and Applications (IJERA). ISSN: 2248-9622, January -February 2013. 3 (1), pp.1826-1831.
[2] Caplice, C., Ponce, E. (2017) MicroMasters in Supply Chain Management. V1 Spring 2017.
CTL.SC4x – Technology and Systems. MIT Center for Transportation & Logistics. Cambridge, MA
02142 USA.
[3] Czenky, M. (2014) The Efficiency Examination of Teaching of Different Normalization Methods.
Department of Informatics, SzentIstván University, Gödöllő, Hungary. International Journal of
Database Management Systems (IJDMS). 6(2), pp. 1-18.
[4] Demba, M. (2013) Algorithm for Relational Database Normalization up to 3nf. International Journal
of Database Management Systems (IJDMS). 5(3), pp. 39-51.
[5] Folorunso, O., Akinwale, A.T. (2010) Developing visualization support system for teaching/learning
database normalization. Emeraldinsight, Campus-Wide Information Systems Journal, 27 (1), pp.25-
39. Emerald Group Publishing Limited, UK.
[6] Gaikwad, A.S., Kadri, F.A., Khandagle, S.S., Tava, N.I. (2017) Review on Automation Tool for ERD
Normalization. International Research Journal of Engineering and Technology (IRJET) [Online]. 4
(2), pp. 1323-1325. [Accessed 07 May 2017]. Available from:
https://www.irjet.net/archives/V4/i2/IRJET-V4I2259.pdf
[7] Kung, H. J., Tung, H. L. (2006) A web-based tool to enhance teaching/learning database
normalization. Proceedings of the 2006 Southern Association for Information Systems Conference,
pages 251-258. Georgia Southern University & Troy University, USA.
[8] Malaika, S., Nicola, M. (2012) Data Normalization Reconsidered. Part 1. DeveloperWorks, IBM
[Online]. [Accessed 20 May 2017]. Available from:
https://www.ibm.com/developerworks/data/library/techarticle/dm-1112normalization/
International Journal of Database Management Systems ( IJDMS ) Vol.9, No.3, June 2017
69
[9] Ochs, J. L. (2010) Database concepts in a virtual world. Thesis, Department of Information Systems,
School of Computer & Information Sciences, Regis University, USA. In partial fulfillment of the
requirements of Master of Science in Database Technology.
[10] Patwardhan, M.S., Dhabe, P.S., Deshpande, A.A., Londhe, S.G., Dhore, M. L. and Abhyankar, H. K.
(2010) Diagrammatic approach for complete automation of relational database normalization at
conceptual level. International Journal of Database Management Systems (IJDMS). 2 (4), pp. 132-
151.
[11] Taofiki, A.A., Tale, A.O. (2011) A Visualization Tool for Teaching and Learning Database
Decomposition System. Department of Computer Science, University of Agriculture, Abeokuta,
Nigeria. Journal of Information and Computing Science. 7(1), pp. 03-10.
[12] Tutani, D. (2015) Teaching Database Normalization at first year University Level: A Simplified
Approach. Department of Business Information Systems, University of Venda, South Africa. The
2015 International Academic Research Conference, 3-6 August, University of London, UK. ICBTS
Copyright.
[13] Tutorialspoint (2017) SQL Structured Query Language. Simply Easy Learning [Online]. [Accessed
07 May 2017]. Available from: http://www.tutorialspoint.com/sql/sql_tutorial.pdf
[14] Wingenious (2005) Database Architecture. 4th edition. Library3.org [Online]. [Accessed 15
December 2016]. Available from: http://www.wingenious.com/database.pdf

More Related Content

What's hot

Ijdms050304A SURVEY ON EDUCATIONAL DATA MINING AND RESEARCH TRENDS
Ijdms050304A SURVEY ON EDUCATIONAL DATA MINING AND RESEARCH TRENDSIjdms050304A SURVEY ON EDUCATIONAL DATA MINING AND RESEARCH TRENDS
Ijdms050304A SURVEY ON EDUCATIONAL DATA MINING AND RESEARCH TRENDSijdms
 
Influence User Involvement On The Quality Of Accounting Information System
Influence User Involvement On The Quality Of Accounting Information SystemInfluence User Involvement On The Quality Of Accounting Information System
Influence User Involvement On The Quality Of Accounting Information SystemArnol Awal
 
Advances in Learning Analytics and Educational Data Mining
Advances in Learning Analytics and Educational Data Mining Advances in Learning Analytics and Educational Data Mining
Advances in Learning Analytics and Educational Data Mining MehrnooshV
 
Understanding User’s Acceptance of Personal Cloud Computing: Using the Techno...
Understanding User’s Acceptance of Personal Cloud Computing: Using the Techno...Understanding User’s Acceptance of Personal Cloud Computing: Using the Techno...
Understanding User’s Acceptance of Personal Cloud Computing: Using the Techno...Maurice Dawson
 
A metadata scheme of the software-data relationship: A proposal
A metadata scheme of the software-data relationship: A proposalA metadata scheme of the software-data relationship: A proposal
A metadata scheme of the software-data relationship: A proposalKai Li
 
A Nobel Approach On Educational Data Mining
A Nobel Approach On Educational Data MiningA Nobel Approach On Educational Data Mining
A Nobel Approach On Educational Data Miningijircee
 
An insight into Educational Data Mining at Muğla Sıtkı Koçman University, Turkey
An insight into Educational Data Mining at Muğla Sıtkı Koçman University, TurkeyAn insight into Educational Data Mining at Muğla Sıtkı Koçman University, Turkey
An insight into Educational Data Mining at Muğla Sıtkı Koçman University, Turkeystrehlst
 
Data Mining Application in Advertisement Management of Higher Educational Ins...
Data Mining Application in Advertisement Management of Higher Educational Ins...Data Mining Application in Advertisement Management of Higher Educational Ins...
Data Mining Application in Advertisement Management of Higher Educational Ins...ijcax
 
Big Data Analytics and E Learning in Higher Education. Tulasi.B & Suchithra.R
Big Data Analytics and E Learning in Higher Education. Tulasi.B & Suchithra.RBig Data Analytics and E Learning in Higher Education. Tulasi.B & Suchithra.R
Big Data Analytics and E Learning in Higher Education. Tulasi.B & Suchithra.Reraser Juan José Calderón
 
Data Education project briefing for Royal Society
Data Education project briefing for Royal SocietyData Education project briefing for Royal Society
Data Education project briefing for Royal SocietyKate Farrell
 
An exploration of the cisco online courses a basis for the development of a l...
An exploration of the cisco online courses a basis for the development of a l...An exploration of the cisco online courses a basis for the development of a l...
An exploration of the cisco online courses a basis for the development of a l...Alexander Decker
 
Chapter123final
Chapter123finalChapter123final
Chapter123finalDelapisa18
 
E-Consult: Designing of Development for Thesis Advisory Model Based on Manage...
E-Consult: Designing of Development for Thesis Advisory Model Based on Manage...E-Consult: Designing of Development for Thesis Advisory Model Based on Manage...
E-Consult: Designing of Development for Thesis Advisory Model Based on Manage...Supriadi Fadel
 

What's hot (15)

Ijdms050304A SURVEY ON EDUCATIONAL DATA MINING AND RESEARCH TRENDS
Ijdms050304A SURVEY ON EDUCATIONAL DATA MINING AND RESEARCH TRENDSIjdms050304A SURVEY ON EDUCATIONAL DATA MINING AND RESEARCH TRENDS
Ijdms050304A SURVEY ON EDUCATIONAL DATA MINING AND RESEARCH TRENDS
 
Influence User Involvement On The Quality Of Accounting Information System
Influence User Involvement On The Quality Of Accounting Information SystemInfluence User Involvement On The Quality Of Accounting Information System
Influence User Involvement On The Quality Of Accounting Information System
 
Advances in Learning Analytics and Educational Data Mining
Advances in Learning Analytics and Educational Data Mining Advances in Learning Analytics and Educational Data Mining
Advances in Learning Analytics and Educational Data Mining
 
Understanding User’s Acceptance of Personal Cloud Computing: Using the Techno...
Understanding User’s Acceptance of Personal Cloud Computing: Using the Techno...Understanding User’s Acceptance of Personal Cloud Computing: Using the Techno...
Understanding User’s Acceptance of Personal Cloud Computing: Using the Techno...
 
A metadata scheme of the software-data relationship: A proposal
A metadata scheme of the software-data relationship: A proposalA metadata scheme of the software-data relationship: A proposal
A metadata scheme of the software-data relationship: A proposal
 
A Nobel Approach On Educational Data Mining
A Nobel Approach On Educational Data MiningA Nobel Approach On Educational Data Mining
A Nobel Approach On Educational Data Mining
 
MARAT ANALYSIS
MARAT ANALYSISMARAT ANALYSIS
MARAT ANALYSIS
 
An insight into Educational Data Mining at Muğla Sıtkı Koçman University, Turkey
An insight into Educational Data Mining at Muğla Sıtkı Koçman University, TurkeyAn insight into Educational Data Mining at Muğla Sıtkı Koçman University, Turkey
An insight into Educational Data Mining at Muğla Sıtkı Koçman University, Turkey
 
Data Mining Application in Advertisement Management of Higher Educational Ins...
Data Mining Application in Advertisement Management of Higher Educational Ins...Data Mining Application in Advertisement Management of Higher Educational Ins...
Data Mining Application in Advertisement Management of Higher Educational Ins...
 
Big Data Analytics and E Learning in Higher Education. Tulasi.B & Suchithra.R
Big Data Analytics and E Learning in Higher Education. Tulasi.B & Suchithra.RBig Data Analytics and E Learning in Higher Education. Tulasi.B & Suchithra.R
Big Data Analytics and E Learning in Higher Education. Tulasi.B & Suchithra.R
 
Data Education project briefing for Royal Society
Data Education project briefing for Royal SocietyData Education project briefing for Royal Society
Data Education project briefing for Royal Society
 
An exploration of the cisco online courses a basis for the development of a l...
An exploration of the cisco online courses a basis for the development of a l...An exploration of the cisco online courses a basis for the development of a l...
An exploration of the cisco online courses a basis for the development of a l...
 
Venkatesh2003
Venkatesh2003Venkatesh2003
Venkatesh2003
 
Chapter123final
Chapter123finalChapter123final
Chapter123final
 
E-Consult: Designing of Development for Thesis Advisory Model Based on Manage...
E-Consult: Designing of Development for Thesis Advisory Model Based on Manage...E-Consult: Designing of Development for Thesis Advisory Model Based on Manage...
E-Consult: Designing of Development for Thesis Advisory Model Based on Manage...
 

Similar to Simplifying Database Normalization within a Visual Interactive Simulation Model

Matching data detection for the integration system
Matching data detection for the integration systemMatching data detection for the integration system
Matching data detection for the integration systemIJECEIAES
 
An Empirical Study of the Applications of Classification Techniques in Studen...
An Empirical Study of the Applications of Classification Techniques in Studen...An Empirical Study of the Applications of Classification Techniques in Studen...
An Empirical Study of the Applications of Classification Techniques in Studen...IJERA Editor
 
BIG DATA ANALYTICS AND E LEARNING IN HIGHER EDUCATION
BIG DATA ANALYTICS AND E LEARNING IN HIGHER EDUCATIONBIG DATA ANALYTICS AND E LEARNING IN HIGHER EDUCATION
BIG DATA ANALYTICS AND E LEARNING IN HIGHER EDUCATIONIJCI JOURNAL
 
STUDENTS’ PERFORMANCE PREDICTION SYSTEM USING MULTI AGENT DATA MINING TECHNIQUE
STUDENTS’ PERFORMANCE PREDICTION SYSTEM USING MULTI AGENT DATA MINING TECHNIQUESTUDENTS’ PERFORMANCE PREDICTION SYSTEM USING MULTI AGENT DATA MINING TECHNIQUE
STUDENTS’ PERFORMANCE PREDICTION SYSTEM USING MULTI AGENT DATA MINING TECHNIQUEIJDKP
 
A rule based higher institution of learning admission decision support system
A rule based higher institution of learning admission decision support systemA rule based higher institution of learning admission decision support system
A rule based higher institution of learning admission decision support systemAlexander Decker
 
Indexing based Genetic Programming Approach to Record Deduplication
Indexing based Genetic Programming Approach to Record DeduplicationIndexing based Genetic Programming Approach to Record Deduplication
Indexing based Genetic Programming Approach to Record Deduplicationidescitation
 
Evaluating the effectiveness of data quality framework in software engineering
Evaluating the effectiveness of data quality framework in  software engineeringEvaluating the effectiveness of data quality framework in  software engineering
Evaluating the effectiveness of data quality framework in software engineeringIJECEIAES
 
76201910
7620191076201910
76201910IJRAT
 
An Expert System For Improving Web-Based Problem-Solving Ability Of Students
An Expert System For Improving Web-Based Problem-Solving Ability Of StudentsAn Expert System For Improving Web-Based Problem-Solving Ability Of Students
An Expert System For Improving Web-Based Problem-Solving Ability Of StudentsJennifer Roman
 
MSF Paper Final Draft_MIrvin_Oct14
MSF Paper Final Draft_MIrvin_Oct14MSF Paper Final Draft_MIrvin_Oct14
MSF Paper Final Draft_MIrvin_Oct14Melissa Irvin, Ed.D.
 
Data Processing in Fundamentals of IT
Data Processing in Fundamentals of ITData Processing in Fundamentals of IT
Data Processing in Fundamentals of ITSanthiNivas
 
The effect of computer literacy on university of maiduguri students’ attitude...
The effect of computer literacy on university of maiduguri students’ attitude...The effect of computer literacy on university of maiduguri students’ attitude...
The effect of computer literacy on university of maiduguri students’ attitude...Alexander Decker
 
Literature review of attribute level and
Literature review of attribute level andLiterature review of attribute level and
Literature review of attribute level andIJDKP
 
A SURVEY OF METHODS FOR HANDLING DISK DATA IMBALANCE
A SURVEY OF METHODS FOR HANDLING DISK DATA IMBALANCEA SURVEY OF METHODS FOR HANDLING DISK DATA IMBALANCE
A SURVEY OF METHODS FOR HANDLING DISK DATA IMBALANCEIJCI JOURNAL
 
Multi Label Spatial Semi Supervised Classification using Spatial Associative ...
Multi Label Spatial Semi Supervised Classification using Spatial Associative ...Multi Label Spatial Semi Supervised Classification using Spatial Associative ...
Multi Label Spatial Semi Supervised Classification using Spatial Associative ...cscpconf
 
Challenging Issues and Similarity Measures for Web Document Clustering
Challenging Issues and Similarity Measures for Web Document ClusteringChallenging Issues and Similarity Measures for Web Document Clustering
Challenging Issues and Similarity Measures for Web Document ClusteringIOSR Journals
 
Write a scholarly post on the following topic and reply given 4 po.docx
Write a scholarly post on the following topic and reply given 4 po.docxWrite a scholarly post on the following topic and reply given 4 po.docx
Write a scholarly post on the following topic and reply given 4 po.docxarnoldmeredith47041
 
Analyzing undergraduate students’ performance in various perspectives using d...
Analyzing undergraduate students’ performance in various perspectives using d...Analyzing undergraduate students’ performance in various perspectives using d...
Analyzing undergraduate students’ performance in various perspectives using d...Alexander Decker
 
An approach for transforming of relational databases to owl ontology
An approach for transforming of relational databases to owl ontologyAn approach for transforming of relational databases to owl ontology
An approach for transforming of relational databases to owl ontologyIJwest
 

Similar to Simplifying Database Normalization within a Visual Interactive Simulation Model (20)

Matching data detection for the integration system
Matching data detection for the integration systemMatching data detection for the integration system
Matching data detection for the integration system
 
An Empirical Study of the Applications of Classification Techniques in Studen...
An Empirical Study of the Applications of Classification Techniques in Studen...An Empirical Study of the Applications of Classification Techniques in Studen...
An Empirical Study of the Applications of Classification Techniques in Studen...
 
BIG DATA ANALYTICS AND E LEARNING IN HIGHER EDUCATION
BIG DATA ANALYTICS AND E LEARNING IN HIGHER EDUCATIONBIG DATA ANALYTICS AND E LEARNING IN HIGHER EDUCATION
BIG DATA ANALYTICS AND E LEARNING IN HIGHER EDUCATION
 
STUDENTS’ PERFORMANCE PREDICTION SYSTEM USING MULTI AGENT DATA MINING TECHNIQUE
STUDENTS’ PERFORMANCE PREDICTION SYSTEM USING MULTI AGENT DATA MINING TECHNIQUESTUDENTS’ PERFORMANCE PREDICTION SYSTEM USING MULTI AGENT DATA MINING TECHNIQUE
STUDENTS’ PERFORMANCE PREDICTION SYSTEM USING MULTI AGENT DATA MINING TECHNIQUE
 
A rule based higher institution of learning admission decision support system
A rule based higher institution of learning admission decision support systemA rule based higher institution of learning admission decision support system
A rule based higher institution of learning admission decision support system
 
Indexing based Genetic Programming Approach to Record Deduplication
Indexing based Genetic Programming Approach to Record DeduplicationIndexing based Genetic Programming Approach to Record Deduplication
Indexing based Genetic Programming Approach to Record Deduplication
 
Evaluating the effectiveness of data quality framework in software engineering
Evaluating the effectiveness of data quality framework in  software engineeringEvaluating the effectiveness of data quality framework in  software engineering
Evaluating the effectiveness of data quality framework in software engineering
 
76201910
7620191076201910
76201910
 
An Expert System For Improving Web-Based Problem-Solving Ability Of Students
An Expert System For Improving Web-Based Problem-Solving Ability Of StudentsAn Expert System For Improving Web-Based Problem-Solving Ability Of Students
An Expert System For Improving Web-Based Problem-Solving Ability Of Students
 
MSF Paper Final Draft_MIrvin_Oct14
MSF Paper Final Draft_MIrvin_Oct14MSF Paper Final Draft_MIrvin_Oct14
MSF Paper Final Draft_MIrvin_Oct14
 
Data Processing in Fundamentals of IT
Data Processing in Fundamentals of ITData Processing in Fundamentals of IT
Data Processing in Fundamentals of IT
 
The effect of computer literacy on university of maiduguri students’ attitude...
The effect of computer literacy on university of maiduguri students’ attitude...The effect of computer literacy on university of maiduguri students’ attitude...
The effect of computer literacy on university of maiduguri students’ attitude...
 
Literature review of attribute level and
Literature review of attribute level andLiterature review of attribute level and
Literature review of attribute level and
 
A SURVEY OF METHODS FOR HANDLING DISK DATA IMBALANCE
A SURVEY OF METHODS FOR HANDLING DISK DATA IMBALANCEA SURVEY OF METHODS FOR HANDLING DISK DATA IMBALANCE
A SURVEY OF METHODS FOR HANDLING DISK DATA IMBALANCE
 
Multi Label Spatial Semi Supervised Classification using Spatial Associative ...
Multi Label Spatial Semi Supervised Classification using Spatial Associative ...Multi Label Spatial Semi Supervised Classification using Spatial Associative ...
Multi Label Spatial Semi Supervised Classification using Spatial Associative ...
 
J017145559
J017145559J017145559
J017145559
 
Challenging Issues and Similarity Measures for Web Document Clustering
Challenging Issues and Similarity Measures for Web Document ClusteringChallenging Issues and Similarity Measures for Web Document Clustering
Challenging Issues and Similarity Measures for Web Document Clustering
 
Write a scholarly post on the following topic and reply given 4 po.docx
Write a scholarly post on the following topic and reply given 4 po.docxWrite a scholarly post on the following topic and reply given 4 po.docx
Write a scholarly post on the following topic and reply given 4 po.docx
 
Analyzing undergraduate students’ performance in various perspectives using d...
Analyzing undergraduate students’ performance in various perspectives using d...Analyzing undergraduate students’ performance in various perspectives using d...
Analyzing undergraduate students’ performance in various perspectives using d...
 
An approach for transforming of relational databases to owl ontology
An approach for transforming of relational databases to owl ontologyAn approach for transforming of relational databases to owl ontology
An approach for transforming of relational databases to owl ontology
 

Recently uploaded

Hazard Identification (HAZID) vs. Hazard and Operability (HAZOP): A Comparati...
Hazard Identification (HAZID) vs. Hazard and Operability (HAZOP): A Comparati...Hazard Identification (HAZID) vs. Hazard and Operability (HAZOP): A Comparati...
Hazard Identification (HAZID) vs. Hazard and Operability (HAZOP): A Comparati...soginsider
 
data_management_and _data_science_cheat_sheet.pdf
data_management_and _data_science_cheat_sheet.pdfdata_management_and _data_science_cheat_sheet.pdf
data_management_and _data_science_cheat_sheet.pdfJiananWang21
 
Kuwait City MTP kit ((+919101817206)) Buy Abortion Pills Kuwait
Kuwait City MTP kit ((+919101817206)) Buy Abortion Pills KuwaitKuwait City MTP kit ((+919101817206)) Buy Abortion Pills Kuwait
Kuwait City MTP kit ((+919101817206)) Buy Abortion Pills Kuwaitjaanualu31
 
A Study of Urban Area Plan for Pabna Municipality
A Study of Urban Area Plan for Pabna MunicipalityA Study of Urban Area Plan for Pabna Municipality
A Study of Urban Area Plan for Pabna MunicipalityMorshed Ahmed Rahath
 
"Lesotho Leaps Forward: A Chronicle of Transformative Developments"
"Lesotho Leaps Forward: A Chronicle of Transformative Developments""Lesotho Leaps Forward: A Chronicle of Transformative Developments"
"Lesotho Leaps Forward: A Chronicle of Transformative Developments"mphochane1998
 
Thermal Engineering -unit - III & IV.ppt
Thermal Engineering -unit - III & IV.pptThermal Engineering -unit - III & IV.ppt
Thermal Engineering -unit - III & IV.pptDineshKumar4165
 
scipt v1.pptxcxxxxxxxxxxxxxxxxxxxxxxxxxxxxxxxxxxxxxxxxxxxxxxxxxxxxxxxxxxxxxxx...
scipt v1.pptxcxxxxxxxxxxxxxxxxxxxxxxxxxxxxxxxxxxxxxxxxxxxxxxxxxxxxxxxxxxxxxxx...scipt v1.pptxcxxxxxxxxxxxxxxxxxxxxxxxxxxxxxxxxxxxxxxxxxxxxxxxxxxxxxxxxxxxxxxx...
scipt v1.pptxcxxxxxxxxxxxxxxxxxxxxxxxxxxxxxxxxxxxxxxxxxxxxxxxxxxxxxxxxxxxxxxx...HenryBriggs2
 
DeepFakes presentation : brief idea of DeepFakes
DeepFakes presentation : brief idea of DeepFakesDeepFakes presentation : brief idea of DeepFakes
DeepFakes presentation : brief idea of DeepFakesMayuraD1
 
Navigating Complexity: The Role of Trusted Partners and VIAS3D in Dassault Sy...
Navigating Complexity: The Role of Trusted Partners and VIAS3D in Dassault Sy...Navigating Complexity: The Role of Trusted Partners and VIAS3D in Dassault Sy...
Navigating Complexity: The Role of Trusted Partners and VIAS3D in Dassault Sy...Arindam Chakraborty, Ph.D., P.E. (CA, TX)
 
Double Revolving field theory-how the rotor develops torque
Double Revolving field theory-how the rotor develops torqueDouble Revolving field theory-how the rotor develops torque
Double Revolving field theory-how the rotor develops torqueBhangaleSonal
 
Work-Permit-Receiver-in-Saudi-Aramco.pptx
Work-Permit-Receiver-in-Saudi-Aramco.pptxWork-Permit-Receiver-in-Saudi-Aramco.pptx
Work-Permit-Receiver-in-Saudi-Aramco.pptxJuliansyahHarahap1
 
Rums floating Omkareshwar FSPV IM_16112021.pdf
Rums floating Omkareshwar FSPV IM_16112021.pdfRums floating Omkareshwar FSPV IM_16112021.pdf
Rums floating Omkareshwar FSPV IM_16112021.pdfsmsksolar
 
2016EF22_0 solar project report rooftop projects
2016EF22_0 solar project report rooftop projects2016EF22_0 solar project report rooftop projects
2016EF22_0 solar project report rooftop projectssmsksolar
 
Bhubaneswar🌹Call Girls Bhubaneswar ❤Komal 9777949614 💟 Full Trusted CALL GIRL...
Bhubaneswar🌹Call Girls Bhubaneswar ❤Komal 9777949614 💟 Full Trusted CALL GIRL...Bhubaneswar🌹Call Girls Bhubaneswar ❤Komal 9777949614 💟 Full Trusted CALL GIRL...
Bhubaneswar🌹Call Girls Bhubaneswar ❤Komal 9777949614 💟 Full Trusted CALL GIRL...Call Girls Mumbai
 
Introduction to Serverless with AWS Lambda
Introduction to Serverless with AWS LambdaIntroduction to Serverless with AWS Lambda
Introduction to Serverless with AWS LambdaOmar Fathy
 
COST-EFFETIVE and Energy Efficient BUILDINGS ptx
COST-EFFETIVE  and Energy Efficient BUILDINGS ptxCOST-EFFETIVE  and Energy Efficient BUILDINGS ptx
COST-EFFETIVE and Energy Efficient BUILDINGS ptxJIT KUMAR GUPTA
 
+97470301568>> buy weed in qatar,buy thc oil qatar,buy weed and vape oil in d...
+97470301568>> buy weed in qatar,buy thc oil qatar,buy weed and vape oil in d...+97470301568>> buy weed in qatar,buy thc oil qatar,buy weed and vape oil in d...
+97470301568>> buy weed in qatar,buy thc oil qatar,buy weed and vape oil in d...Health
 
Standard vs Custom Battery Packs - Decoding the Power Play
Standard vs Custom Battery Packs - Decoding the Power PlayStandard vs Custom Battery Packs - Decoding the Power Play
Standard vs Custom Battery Packs - Decoding the Power PlayEpec Engineered Technologies
 

Recently uploaded (20)

Hazard Identification (HAZID) vs. Hazard and Operability (HAZOP): A Comparati...
Hazard Identification (HAZID) vs. Hazard and Operability (HAZOP): A Comparati...Hazard Identification (HAZID) vs. Hazard and Operability (HAZOP): A Comparati...
Hazard Identification (HAZID) vs. Hazard and Operability (HAZOP): A Comparati...
 
data_management_and _data_science_cheat_sheet.pdf
data_management_and _data_science_cheat_sheet.pdfdata_management_and _data_science_cheat_sheet.pdf
data_management_and _data_science_cheat_sheet.pdf
 
Kuwait City MTP kit ((+919101817206)) Buy Abortion Pills Kuwait
Kuwait City MTP kit ((+919101817206)) Buy Abortion Pills KuwaitKuwait City MTP kit ((+919101817206)) Buy Abortion Pills Kuwait
Kuwait City MTP kit ((+919101817206)) Buy Abortion Pills Kuwait
 
A Study of Urban Area Plan for Pabna Municipality
A Study of Urban Area Plan for Pabna MunicipalityA Study of Urban Area Plan for Pabna Municipality
A Study of Urban Area Plan for Pabna Municipality
 
"Lesotho Leaps Forward: A Chronicle of Transformative Developments"
"Lesotho Leaps Forward: A Chronicle of Transformative Developments""Lesotho Leaps Forward: A Chronicle of Transformative Developments"
"Lesotho Leaps Forward: A Chronicle of Transformative Developments"
 
Thermal Engineering -unit - III & IV.ppt
Thermal Engineering -unit - III & IV.pptThermal Engineering -unit - III & IV.ppt
Thermal Engineering -unit - III & IV.ppt
 
scipt v1.pptxcxxxxxxxxxxxxxxxxxxxxxxxxxxxxxxxxxxxxxxxxxxxxxxxxxxxxxxxxxxxxxxx...
scipt v1.pptxcxxxxxxxxxxxxxxxxxxxxxxxxxxxxxxxxxxxxxxxxxxxxxxxxxxxxxxxxxxxxxxx...scipt v1.pptxcxxxxxxxxxxxxxxxxxxxxxxxxxxxxxxxxxxxxxxxxxxxxxxxxxxxxxxxxxxxxxxx...
scipt v1.pptxcxxxxxxxxxxxxxxxxxxxxxxxxxxxxxxxxxxxxxxxxxxxxxxxxxxxxxxxxxxxxxxx...
 
DeepFakes presentation : brief idea of DeepFakes
DeepFakes presentation : brief idea of DeepFakesDeepFakes presentation : brief idea of DeepFakes
DeepFakes presentation : brief idea of DeepFakes
 
Navigating Complexity: The Role of Trusted Partners and VIAS3D in Dassault Sy...
Navigating Complexity: The Role of Trusted Partners and VIAS3D in Dassault Sy...Navigating Complexity: The Role of Trusted Partners and VIAS3D in Dassault Sy...
Navigating Complexity: The Role of Trusted Partners and VIAS3D in Dassault Sy...
 
Double Revolving field theory-how the rotor develops torque
Double Revolving field theory-how the rotor develops torqueDouble Revolving field theory-how the rotor develops torque
Double Revolving field theory-how the rotor develops torque
 
Work-Permit-Receiver-in-Saudi-Aramco.pptx
Work-Permit-Receiver-in-Saudi-Aramco.pptxWork-Permit-Receiver-in-Saudi-Aramco.pptx
Work-Permit-Receiver-in-Saudi-Aramco.pptx
 
Rums floating Omkareshwar FSPV IM_16112021.pdf
Rums floating Omkareshwar FSPV IM_16112021.pdfRums floating Omkareshwar FSPV IM_16112021.pdf
Rums floating Omkareshwar FSPV IM_16112021.pdf
 
2016EF22_0 solar project report rooftop projects
2016EF22_0 solar project report rooftop projects2016EF22_0 solar project report rooftop projects
2016EF22_0 solar project report rooftop projects
 
Integrated Test Rig For HTFE-25 - Neometrix
Integrated Test Rig For HTFE-25 - NeometrixIntegrated Test Rig For HTFE-25 - Neometrix
Integrated Test Rig For HTFE-25 - Neometrix
 
Cara Menggugurkan Sperma Yang Masuk Rahim Biyar Tidak Hamil
Cara Menggugurkan Sperma Yang Masuk Rahim Biyar Tidak HamilCara Menggugurkan Sperma Yang Masuk Rahim Biyar Tidak Hamil
Cara Menggugurkan Sperma Yang Masuk Rahim Biyar Tidak Hamil
 
Bhubaneswar🌹Call Girls Bhubaneswar ❤Komal 9777949614 💟 Full Trusted CALL GIRL...
Bhubaneswar🌹Call Girls Bhubaneswar ❤Komal 9777949614 💟 Full Trusted CALL GIRL...Bhubaneswar🌹Call Girls Bhubaneswar ❤Komal 9777949614 💟 Full Trusted CALL GIRL...
Bhubaneswar🌹Call Girls Bhubaneswar ❤Komal 9777949614 💟 Full Trusted CALL GIRL...
 
Introduction to Serverless with AWS Lambda
Introduction to Serverless with AWS LambdaIntroduction to Serverless with AWS Lambda
Introduction to Serverless with AWS Lambda
 
COST-EFFETIVE and Energy Efficient BUILDINGS ptx
COST-EFFETIVE  and Energy Efficient BUILDINGS ptxCOST-EFFETIVE  and Energy Efficient BUILDINGS ptx
COST-EFFETIVE and Energy Efficient BUILDINGS ptx
 
+97470301568>> buy weed in qatar,buy thc oil qatar,buy weed and vape oil in d...
+97470301568>> buy weed in qatar,buy thc oil qatar,buy weed and vape oil in d...+97470301568>> buy weed in qatar,buy thc oil qatar,buy weed and vape oil in d...
+97470301568>> buy weed in qatar,buy thc oil qatar,buy weed and vape oil in d...
 
Standard vs Custom Battery Packs - Decoding the Power Play
Standard vs Custom Battery Packs - Decoding the Power PlayStandard vs Custom Battery Packs - Decoding the Power Play
Standard vs Custom Battery Packs - Decoding the Power Play
 

Simplifying Database Normalization within a Visual Interactive Simulation Model

  • 1. International Journal of Database Management Systems ( IJDMS ) Vol.9, No.3, June 2017 DOI : 10.5121/ijdms.2017.9304 57 SIMPLIFYING DATABASE NORMALIZATION WITHIN A VISUAL INTERACTIVE SIMULATION MODEL Dr. Belsam Attallah Senior Fellow, Higher Education Academy (HEA), UK Member, British Computer Society (BCS), UK Assistant Professor, Department of Computer Information Science, Higher Colleges of Technology (HCT), United Arabs Emirates ABSTRACT Although many researchers focused on investigating the challenges of database normalization, and suggested recommendations on easing these challenges, this process remained an area of concern to database designers, developers, and learners. This paper investigated these challenges and involved Higher Education in Computer Science students learning database normalization, as they could well represent beginning database designers/developers, who would struggle in effectively normalize their database design due to the complexity of this theoretical process, which has no similar real-life representation. The paper focused on the advantages of interactive visualization techniques to simplify database normalization, and recommended virtual world technologies, such as ‘Second Life’, as an effective platform to achieve this visualization via a simulated model of a relational database system. The simulation technique presented in this paper is novel, and is supported by extensive evidence on its advantages to achieve an illustration of the ‘Normal Forms’ and the need for them. KEYWORDS Database Normalization; Database Normalisation; Normal Forms; Visualization; Visualisation; Visual; Virtual Worlds; Second Life; Virtualization; Virtualisation. GOALS AND METHODS The goals of this research are to assemble literature related to the difficulties faced in the understanding and implementation of database normalization by beginning designers and developers, to investigate the advantages of visualization and interactivity to this process and to recommend an effective simulation technique to achieve this visualization. For this, Higher Education in Computer Science students have been selected for this research activities. Both quantitative and qualitative research methods were applied to achieve the outcomes of this research (questionnaires, observations and students’ feedback). An intensive literature review has been carried out to document the problem formulation, and to support the research outcomes and recommendations. 1. INTRODUCTION There is significant research acknowledging the level of complexity in the database normalization process, and how this issue forms a cause of concern not only for beginning database designers and developers, but also for Higher Education (HE) students studying this process in their university studies. To this regard, Folorunso et al. (2010, p. 25) confirmed that “relational data model theory (normalization) tends to be complex for the average designers”. Research also
  • 2. International Journal of Database Management Systems ( IJDMS ) Vol.9, No.3, June 2017 58 revealed that the difficulty involved in the understanding and implementation of this process caused students’ poor achievement in their HE Computer Science database modules. Gaikwad et al. (2017) highlighted that database normalization is a complex theoretical process that is hard to understand by learners, which does not facilitate encouraging people to lean it. This paper focuses on identifying the challenges faced in the analysis, understanding and learning of database normalization process and its ‘Normal Forms’, and provides recommendations on the techniques and platforms needed to overcome these challenges. Visualization, simulation and interactivity were the aspects explored and recommended by this paper to facilitate and enhance the comprehension and interpretation of this process in order to support novice database designers and learners. 2. DIFFICULTIES OF DATABASE NORMALIZATION 2.1 WHAT IS ‘DATABASE NORMALIZATION’ According to Caplice et al. (2017) database normalization is a fundamental component of database management related to organizing data elements into relational tables in order to improve data integrity and reduce data redundancy. Database normalization prevents data inconsistencies, wasted storage, incorrect and outdated data. Tutorialspoint (2017) clarified that the database normalization process ensures an efficient organization of data in database tables, which results in guaranteeing that data dependencies make sense, and also reducing the space occupied by the database via eliminating redundant data. The source added that this process is divided into three ‘Normal Forms’, each of which represent the guidelines of how the database structure is designed/organized at that particular level. It is possible, however, to go beyond the 3rd Normal Form to the 4th , 5th … etc. in large and complicated databases, yet, research showed that normalizing a database to the 3rd Normal Form is sufficient. Demba (2013) defined database normalization as the process needed in a relational database, which organizes data and minimizes its redundancy. The source clarified that the normalization process involves classifying the data into two or more tables, where relationships are defined to connect the tables so that any modifications to the data (additions, deletions, alterations) in one table will then disseminate to the rest of the tables within the database via the defined relationship(s). Demba (2013, p. 39) added that the database normalization concept and its ‘Normal Forms’ were originally invented by Edgar Codd, the inventor of the relational model, and that the ‘Normal Forms’ provide “the criteria for determining a table's degree of vulnerability to logical inconsistencies and anomalies. The higher the normal form applicable to a table, the less vulnerable it is”. Looking more into the background of database normalization, Malaika et al. (2012, p. 3) clarified that database normalization was first introduced in 1970s. They defined database normalization as “a methodology that minimizes data duplication to safeguard databases against logical and structural problems, such as data anomalies”. They added that the normalization process ensures that any data element, such as name, age, address, product information…etc. appears only one time on the disk in order to save storage space and avoid data inconsistencies.
  • 3. International Journal of Database Management Systems ( IJDMS ) Vol.9, No.3, June 2017 59 2.2 RESEARCHERS ACKNOWLEDGING THE DIFFICULTIES FACED BY DATABASE DESIGNERS AND LEARNERS IN UNDERSTANDING AND IMPLEMENTING DATABASE NORMALIZATION Research revealed that a number of tools were designed to support the understanding, learning and implentation of database normalization, regardless of which, the subject remained an issue of concern when aiming to achieve an effectively normalized database system. Wingenious (2005) confirmed that besides being a complex subject to learn, database normalization is a critical part of an effective database design, which is vital in guaranteeing data integrity and eliminating data redundancy in a database system. Alappanavar et al. (2013) supported this by explaining how difficult it is to motivate students to learn database normalization because they consider this subject to be dry and purely theory-based. They clarified that the more the database grows, the more difficult it becomes to manually handle the normalization process. Tutani (2015, p. 218) highlighted that it is challenging to teach conceptual database design to novice learners, in addition to being challenging for educators as well. The author added that “normalization of relations, from first to higher normal forms is often a problematic concept for students to understand”. Due to the strong mathematical jargons in the normalization process, the author added, even HE learners at higher levels of databases’ programmes still find it challenging to conceptualize the process, as the difficulty persists at all levels. In the same regard, Folorunso et al. (2010, p. 26) confirmed that students in tertiary academic institutions find it difficult to learn the subject of database design theory, and in particular, the database normalization process, as “the normalization algorithms often require extensive relational algebraic backgrounds that most computer science students lack”. They also clarified that researchers and educators in the databases field emphasized the complexity of this process throughout the years since the introduction of Codd’s (1970) seminal work on ‘Database Normal Forms’. They highlighted that the database normalization process is not only a cause of poor designer performance, but it is also a challenging subject to teach. In a study carried out on the engineering students of SzentIstván University, Hungary, Czenky (2014) defined the process of database normalization as being a principal database design method. However, she added, the students found the understanding and application of this method problematic and challenging. She explained the outcomes of the survey carried out for this in the university in 2008, where 54 students participated. The survey revealed that 69.6% of students found database normalization as the most difficult subject. She also compared the outcomes of this survey to a similar one carried out at the University of Ulster, Northern Ireland, where the students were given the opportunity to select from (very difficult, difficult, easy and very easy) options. The summation of ‘very difficult’ and ‘difficult’ choices for the database normalization subject was 84.6% of the students. The difficulty of the theory concepts in the database normalization process was also explained by Kung et al. (2006), who suggested designing a web-based tool to provide the learners with an interactive hands-on experience to improve the understanding and implementation of this process. They clarified the difficulty they faced in motivating their students, who considered it such a dry and theoretical subject, to learn the process. They added that the results of the survey carried out, in a junior level ‘Systems Analysis and Design’ course, to record students’ feedback, confirmed that the learners generally viewed the web-based tool more positively than the database normalization techniques in the textbook. Demba (2013, p. 39) highlighted that designers find the database normalization process difficult and cumbersome, as violating any of the three ‘Normal Forms’ criteria of normalization exposes
  • 4. International Journal of Database Management Systems ( IJDMS ) Vol.9, No.3, June 2017 60 the database system to problems, such as redundant data and inconsistent dependencies. The source added that designers must also be aware of “partial and transitive dependencies on all candidate keys and not just the primary key. This can make the process of normalization more complex”. 2.3 RESEARCHERS REALIZING THE NEED FOR VISUALIZATION TO AID IN SIMPLIFYING THE PROCESS OF DATABASE NORMALIZATION A number of researchers acknowledged the need for visualization in this field. Gaikwad et al. (2017, p. 1324) stated that “Some toolsets such as NORMIT, Web based Normalization Tool, etc., are specifically designed for learning/ teaching/ understanding the process of normalization, since the process is difficult to understand and theoretical”. However, Patwardhan et al. (2010) clarified that web-based normalization tools, such as NORMIT, do not provide visual aid for the normalization process. Gaikwad et al. (2017) added that other available automatic normalization tools, such as Formalizer, JMathNorm…etc., perform database normalization on the relational level only, not on the conceptual level, which does not facilitate the full understanding and learning of the normalization process. Folorunso et al. (2010) highlighted the need for visualization to support the understanding and implementation of database normalization process. They explained their adopted visualization method, which was designed through a computer program built using C# programming language, in which learners enter the database field titles and their properties in textboxes and press the buttons available in the user-interface to produce the normalization form associated with each stage. However, using this program did not enable the students to immerse in the process and generate the normalization forms themselves. Although this technique demonstrated simple/basic visualization, Folorunso et al. (2010) still confirmed that this visualization idea caused the students to view this experience more positively than the textbook technique. Ochs (2010) explained a more advanced visualization attempt in this field in USA, which was carried out in virtual worlds. However, this attempt was to use the 3D virtual world environment to teach an introductory database course to Master of Science in Database Technology students in order to reduce the time needed to learn database concepts. The 3D model built for this purpose handled preliminary database aspects to enable students to create a Microsoft Access inventory database. It did not particularly focus on visualizing the challenging theory concepts of database normalization. The virtual model was a purposely furnished house in the virtual world of ‘Second Life’, with descriptions and notecards attached to different furniture objects to provide the students with information on the fields required per database table. The inventory database for this house was rather simple and did not require a major normalization process. Ochs (2010) clarified that students’ feedback showed that 75% of them agreed that this model reduced the time needed to learn these concepts. According to Taofiki et al. (2011, p. 4), a web-based learning environment was designed by Nikolay Georgiev in 2007 called LDBN (Learn Database Normalization) by using javascript and Ajax. In this platform, students are able to test their information on the relational database normalization subject online via choosing an assignment submitted by the lecturer and try to solve it. However, “LDBN cannot handle multi-valued dependencies (MVD) and thus cannot handle higher normal forms such as 4NF and above”. Taofiki et al. (2011) highlighted another attempt to visualize database normalization in 2009, which was carried out by Murray &Guimaraes. This attempt was in the form of ‘Animated Courseware Support for Teaching Database Design’, which provided supporting material for teaching database design concepts; however, it did not actually aim at visualizing the process itself to facilitate its understanding and
  • 5. International Journal of Database Management Systems ( IJDMS ) Vol.9, No.3, June 2017 61 learning. Taofiki et al. (2011) explained their own developed visualization tool, from 2008-2010, which was also used as an assessment instrument to support the teaching of database decomposition techniques. This was a software tool, with a user interface that includes a number of textboxes for students to fill-in with field names/types of a database, which again did not focus on the visualization of the actual normalization process. In the above explained literature review, there was no real visualization-focused tool that adopted simulation and fostered interactivity to simplify the process of database normalization and facilitate its understanding and implementation. This paper focuses on the employment of an emerging computing technology to achieve an effective visualization of the database normalization process, which presents a visual, user-friendly, interactive, collaborative, experimental and engaging interface, in order to facilitate grasping the complex theoretical concepts of database normalization. 3. THE APPLICATION OF VIRTUAL WORLD TECHNOLOGIES TO VISUALIZE THE DATABASE NORMALIZATION PROCESS This research focused on a different visualization technique to the ones mentioned in the earlier sections. It involved the application of virtual world technologies to visualize complex theory concepts of database normalization in order to support novice database designers and learners. The research activities involved HE in Computer Science students in England, UK. Purposely-built visualization scenarios were designed in the virtual world of ‘Second Life’ to support the analysis and interpretation of challenging database normalization concepts as part of the databases modules of HE in Computer Science, Year-1. These visualization scenarios were programmed by the researcher using the programming language embedded within Second Life, called ‘Linden Labs Scripting Language (LSL)’. The visualization and simulation of database ‘Normal Forms’, and the interactivity achieved within the virtual platform, facilitated the understanding and effective implementation of the database normalization process to a high level. In order to get an accurate comparison between the outcomes of understanding this process using the visualized technique (in virtual worlds) and the non-visualized technique (in the physical world), the researcher decided to divided the students into two groups, one to learn database normalization in the physical world and the other in the virtual world. These groups were then swapped to enable them to compare the advantages and limitations of learning the normalization process within each environment. As students’ grades could be used as a strong/valid indication of their learning and achievement, the following approaches were followed in order to enable an accurate judgement of students’ benefits from visualizing the normalization process in virtual worlds, and also to avoid including irrelevant data: 1. Where one (or more) of the course assessments, included in the calculation of grades, does not involve the application of database normalization in virtual worlds, their grades were not considered. 2. Where one (or more) of the assessments, included in the calculation of grades, was carried out before using virtual worlds, their grades were also excluded. The visualization of database normalization in virtual worlds was applied in a number of database-related modules in the selected HE programme (as explained below), and a comparison of outcomes was also carried out in order to provide further evidence on the advantages and limitations of this technique and the suggested recommendations.
  • 6. International Journal of Database Management Systems ( IJDMS ) Vol.9, No.3, June 2017 62 In order to visualize the complex theory concepts of the database normalization process, a clear real-life example, which requires a large database system, was chosen for the virtual scenario. This was a hospital that requires a database system to store and manage patients’ diagnosis and treatment records. Although the type of stored information on patients in a real-life hospital is obviously intuitive, the aim, when the researcher designed the virtual scenario, was to put the students, virtually, in the atmosphere of a real hospital situation. This was intended to inspire the students to investigate the certain departments (within the hospital) that need to be referred to for information on the database system in hand, and the correct approach to data exploration and gathering. A sample hospital of two storeys was designed in Second Life. The first floor included the reception area, the pharmacy department and a couple of consultant rooms, while the second floor contained two patient wards of two different departments. There was a number of sign boards distributed within the scenario displaying information on each department, and also some metaphors of information givers, e.g. a telephone figure titled ‘Call for help’, which gives a notecard when clicked explaining how the patient’s data is linked to that of the ward, and also a drug bottle titled ‘Click for information’ which provides a notecard explaining the information recorded for drugs in the pharmacy department. These explanations represented the fields required in the patient, ward and drug tables within the hospital database system. In addition, a number of ‘clues’ were distributed randomly within the scenario, e.g. signs and title of objects, to encourage the students to explore all the areas of the virtual hospital investigating and seeking data in order to get all the information they need to design the relational database system. Another type of information was embedded in a bookshelf titled ‘Hospital Files’, the books of which had individual URL links to published webpages that were purposely designed and scripted to provide further information on the relationships between the data of different tables within the database system. See Figures 3.1 and 3.2 below. Figure 3.1: The Database Normalization virtual scenario (Weston Hospital)
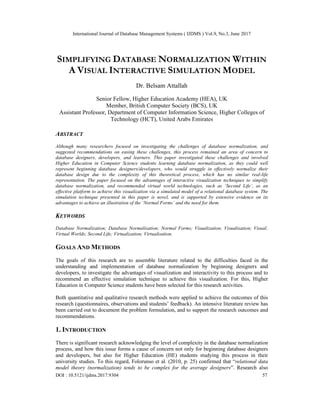
  • 7. International Journal of Database Management Systems ( IJDMS ) Vol.9, No.3, June 2017 63 Figure 3.2: The Database Normalization virtual scenario (Pharmacy Department) This virtual scenario was designed to mirror the actual procedure that the database designer need to follow when visiting a real hospital, i.e. exploring all the departments involved, investigating sources of information, e.g. hospital records and staff members, and writing comments based on their own observation of the hospital procedures and how patients’ data is processed. Following collecting all the information needed for the hospital database example, the students were provided with virtual sculptures of the database components so that they use them to design a 3D visual representation of the database system. These sculptures represented the fields of tables within the database, which students were required to use in order to normalize the individual tables starting from the ‘1st Normal Form’ and proceeding to the ‘3rd Normal Form’. See Figures 3.3 and 3.4 below. Figure 3.3: The Database Normalization virtual scenario (sculptures representing table fields)
  • 8. International Journal of Database Management Systems ( IJDMS ) Vol.9, No.3, June 2017 64 Figure 3.4: The Database Normalization virtual scenario (students normalizing database tables visually) The students were required to move the sculptures (the data fields within the database) and re- arrange them in rows (patients’ records) and columns (table fields) and keep adding, removing, restructuring and separating sculptures throughout the Normal Forms. The observations by the researcher confirmed that the students found the scenario extremely useful in visualizing why the ‘Three Normal Forms’ are necessary to improve data integrity within the tables and to eliminate unnecessary duplication(s) and repetition within the data. This visualization enabled the understanding of why the normalization process is vital for the success of a relational database system and the critical need to an effective and logical design of its data tables. As students were seeing the immediate outcomes of their structuring process of the database tables and fields, they were able to see the impacts of certain aspects, e.g. data duplication and repetition, and consequently were able to do the correct changes to the design of their tables to eliminate the problems and successfully achieve a fully normalized database. These observations by the researcher were then approved by the outcomes of the questionnaire completed by the students following the virtual exercise regarding the enhancement to their understanding, learning and implementation of this complex theory process. As indicated earlier within this section, the HE students were divided into two groups, where both groups received a basic introduction to the normalization process via talks by the lecturer and some explanations on the whiteboard. This was then followed by delivering the whole normalization exercise to the first group using the traditional method (in the physical world), and the whole exercise to the second group using the visualized scenario (in the virtual world). The two groups were then swapped to have the same exercise (in the following session) using the other method, to enable them to have an effective comparison between their achievement within each platform, and also to reflect more on the advantages and limitations of each environment, e.g. engagement, collaboration, interactivity and affective quality. The outcomes of the questionnaire distributed to Year-1 (Section-1) students to capture and record their feedback are explained below. The results of the questionnaire showed that 53% of the students considered database normalization as a difficult subject, however, only 49% of them agreed that exercising the process in the virtual world environment enhanced their learning and understanding of its complex theory concepts, while 57% of them agreed to enhanced affective quality and 57% found this learning process more engaging (see Figure 3.5 below).
  • 9. International Journal of Database Management Systems ( IJDMS ) Vol.9, No.3, June 2017 65 Figure 3.5: Statistics of Database Normalization, Year-1 (Section-1) It is worth mentioning here that the researcher carried out some vital improvements to the database virtual scenario following the first virtual exercise based on students’ feedback and discussions following the exercise. This included providing more information on the types of tables needed for the database and the fields within each of them. This facilitated the understanding of the ‘Relational Database’ concept, which is fundamental in the database normalization process. This resulted in more positive outcomes for the normalization exercises of the subsequent Year-1 sections. Moving to Year-1 (Section-2), and following the improvements made on the virtual scenario, a different approach to recording students’ feedback was adopted compared to that in Year-1 (Section-1). Students’ feedback was captured and recorded before and after the application of virtual world technologies to visualize the database normalization process. The questionnaire produced the following outcomes (see Figure 3.6 below): • Slightly more than half of the students who originally agreed that this subject is deemed difficult changed their minds following practicing in the virtual world scenario. • Twenty-two percent more students agreed that effective understanding and implementation of the normalization process took place in virtual worlds, which facilitated their learning of its complex theory concepts. • Sixteen percent more students agreed that affective quality was enhanced. • Twenty-three percent more students found virtual worlds more engaging when working on the normalization process. Figure 3.6: Statistics of Database Normalization, Year-1 (Section-2)
  • 10. International Journal of Database Management Systems ( IJDMS ) Vol.9, No.3, June 2017 66 For a more in-depth comparison, and by looking again into the analysis achieved above for Year- 1 (Section-1), the researcher carried out further investigation to answer the questions in Table 3.1 below: Table 3.1: Data correlation of the Database Normalization exercises, Year-1 (Section-1) Moving to Year-1 (Section-2), the five questions were rephrased in order to reflect the additional element of before and after the application of virtual world technologies that was added to the questionnaire following the improvements on the original virtual scenario. The outcomes were as in Table 3.2 below:
  • 11. International Journal of Database Management Systems ( IJDMS ) Vol.9, No.3, June 2017 67 Table 3.2: Data correlation of the Database Normalization exercises, Year-1 (Section-2) The above strong percentages were confirmed by the high module grades for Section-2, as shown below (see table 3.3): Note: Grade = (Average mark of the module / Average mark of all Computing modules * 100) Table 3.3: Grades of the Databases module, Year-1 The Web Technologies module in Year-1 was another strong evidence on the advantages of visualizing the database normalization process in virtual worlds. Within this module, students are expected to program their website and also apply their understanding of database normalization in their design of the online MySQL database required for their website. The database normalization skills needed in this module were applied towards the end of the academic year in the web practical project, which is the final assessment in this module. The grades of this practical assessment clearly showed the development in students’ understanding and learning of the database normalization complex theory concepts, which were re-applied as part of the web project. The grades were as in Table 3.4 below: Note: Grade = (Average mark of the module / Average mark of all Computing modules * 100) Table 3.4: Grades of the Web Technologies module, Year-1 In addition to the above, the feedback received by the other HE lecturer delivering the theory of database normalization using the traditional way, reinforced the fact that students’ understanding and learning of the complex theory concepts of this process were noticeably, if not greatly, enhanced following the visualization achieved in virtual worlds. This lecturer managed to observe students’ performance and attitude before and after the application of virtual worlds. She said: “…The virtual scenarios had a positive impact on areas of particular difficulty… The visualization reinforced some of the more challenging concepts… Scenario ideas are a useful addition to learning aids… The virtual world is a powerful tool that can be used to make the constructs more memorable… Initial suspicion and some reluctance were gradually replaced by interest and then acknowledgement of the value of this addition to their curriculum”. In reinforcing the advantages of visualization, she added that as many people are visual learners, “the virtual scenario helped them to understand the rules more fully and see the outcome of the reduction of duplication that normalization brings… Students felt more able to attempt the normalization process… It made a positive impact, and students were interested to see the change
  • 12. International Journal of Database Management Systems ( IJDMS ) Vol.9, No.3, June 2017 68 in the objects following each stage of the normalization process... Objects and situations are always much more interesting than raw data”. 4. CONCLUSION Understanding the complex theory concepts of database normalization forms a cause of concern to a large number of database designers and developers, in addition to people studying this field at the HE level. Research revealed that these concerns are within the main reasons behind achieving poorly or failing the modules that include database normalization concepts. Research also showed a number of software and online tools, which aimed at illustrating the process of database normalization for novice designers and learners; however, the majority of them focused on automating the process rather than visualizing and simplifying it to facilitate its understanding and effective implementation, which did not generate the degree of support needed for this complex theory process. This research demonstrated that there are strong indications of the advantages of visualizing database normalization in virtual worlds, as this platform offers great benefits such as interactivity, collaboration and experimentation, which are ideal for understanding and learning the normalization process. This did not only cover enhancements to people’s understanding, but also increased their engagement in the process, enhanced affective quality and improved their achievement of effectively normalized database systems. REFERENCES [1] Alappanavar, P.B., Grover, R., Hunjan, S., Patil, D. and Girnar, Y. (2013) Automating the normalization process for relational database model. International Journal of Engineering Research and Applications (IJERA). ISSN: 2248-9622, January -February 2013. 3 (1), pp.1826-1831. [2] Caplice, C., Ponce, E. (2017) MicroMasters in Supply Chain Management. V1 Spring 2017. CTL.SC4x – Technology and Systems. MIT Center for Transportation & Logistics. Cambridge, MA 02142 USA. [3] Czenky, M. (2014) The Efficiency Examination of Teaching of Different Normalization Methods. Department of Informatics, SzentIstván University, Gödöllő, Hungary. International Journal of Database Management Systems (IJDMS). 6(2), pp. 1-18. [4] Demba, M. (2013) Algorithm for Relational Database Normalization up to 3nf. International Journal of Database Management Systems (IJDMS). 5(3), pp. 39-51. [5] Folorunso, O., Akinwale, A.T. (2010) Developing visualization support system for teaching/learning database normalization. Emeraldinsight, Campus-Wide Information Systems Journal, 27 (1), pp.25- 39. Emerald Group Publishing Limited, UK. [6] Gaikwad, A.S., Kadri, F.A., Khandagle, S.S., Tava, N.I. (2017) Review on Automation Tool for ERD Normalization. International Research Journal of Engineering and Technology (IRJET) [Online]. 4 (2), pp. 1323-1325. [Accessed 07 May 2017]. Available from: https://www.irjet.net/archives/V4/i2/IRJET-V4I2259.pdf [7] Kung, H. J., Tung, H. L. (2006) A web-based tool to enhance teaching/learning database normalization. Proceedings of the 2006 Southern Association for Information Systems Conference, pages 251-258. Georgia Southern University & Troy University, USA. [8] Malaika, S., Nicola, M. (2012) Data Normalization Reconsidered. Part 1. DeveloperWorks, IBM [Online]. [Accessed 20 May 2017]. Available from: https://www.ibm.com/developerworks/data/library/techarticle/dm-1112normalization/
  • 13. International Journal of Database Management Systems ( IJDMS ) Vol.9, No.3, June 2017 69 [9] Ochs, J. L. (2010) Database concepts in a virtual world. Thesis, Department of Information Systems, School of Computer & Information Sciences, Regis University, USA. In partial fulfillment of the requirements of Master of Science in Database Technology. [10] Patwardhan, M.S., Dhabe, P.S., Deshpande, A.A., Londhe, S.G., Dhore, M. L. and Abhyankar, H. K. (2010) Diagrammatic approach for complete automation of relational database normalization at conceptual level. International Journal of Database Management Systems (IJDMS). 2 (4), pp. 132- 151. [11] Taofiki, A.A., Tale, A.O. (2011) A Visualization Tool for Teaching and Learning Database Decomposition System. Department of Computer Science, University of Agriculture, Abeokuta, Nigeria. Journal of Information and Computing Science. 7(1), pp. 03-10. [12] Tutani, D. (2015) Teaching Database Normalization at first year University Level: A Simplified Approach. Department of Business Information Systems, University of Venda, South Africa. The 2015 International Academic Research Conference, 3-6 August, University of London, UK. ICBTS Copyright. [13] Tutorialspoint (2017) SQL Structured Query Language. Simply Easy Learning [Online]. [Accessed 07 May 2017]. Available from: http://www.tutorialspoint.com/sql/sql_tutorial.pdf [14] Wingenious (2005) Database Architecture. 4th edition. Library3.org [Online]. [Accessed 15 December 2016]. Available from: http://www.wingenious.com/database.pdf