SlideShare a Scribd company logo
1 of 19
Download to read offline
International Journal of Computer Science, Engineering and Information Technology (IJCSEIT), Vol.3, No.1, February 2013
DOI : 10.5121/ijcseit.2013.3102 13
DESIGN AND DEVELOPMENT OF ARTIFICIAL
NEURAL NETWORKING (ANN) SYSTEM USING
SIGMOID ACTIVATION FUNCTION TO
PREDICT ANNUAL RICE PRODUCTION IN
TAMILNADU
S.Arun Balaji1
and K.Baskaran2
1
PhD scholar, Computer Science & Engineering, Karpagam University, Coimbatore,
India.
Email: arunbalaji1983@yahoo.co.in
2
PhD Research Director and Associate Professor, Dept. of Computer Science &
Engineering and Information Technology, Government College of Technology (GCT),
Coimbatore, India.
Email: baski_101@yahoo.com
ABSTRACT
Prediction of annual rice production in all the 31 districts of Tamilnadu is an important decision for the
Government of Tamilnadu. Rice production is a complex process and non linear problem involving soil,
crop, weather, pest, disease, capital, labour and management parameters. ANN software was designed and
developed with Feed Forward Back Propagation (FFBP) network to predict rice production. The input
layer has six independent variables like area of cultivation and rice production in three seasons like
Kuruvai, Samba and Kodai. The popular sigmoid activation function was adopted to convert input data
into sigmoid values. The hidden layer computes the summation of six sigmoid values with six sets of
weightages. The final output was converted into sigmoid values using a sigmoid transfer function. ANN
outputs are the predicted results. The error between original data and ANN output values were computed.
A threshold value of 10-9
was used to test whether the error is greater than the threshold level. If the error
is greater than threshold then updating of weights was done all summations were done by back
propagation. This process was repeated until error equal to zero. The predicted results were printed and it
was found to be exactly matching with the expected values. It shows that the ANN prediction was 100%
accurate.
KEYWORDS
Design, Development, Artificial Neural Network, Prediction of rice production
1. INTRODUCTION
Rice is the stable food for Tamil Nadu. Prediction of annual rice production in all the 31 districts
of Tamilnadu is an important decision for the Government of Tamilnadu so as to plan for
International Journal of Computer Science, Engineering and Information Technology (IJCSEIT), Vol.3, No.1, February 2013
14
importing rice from other state or exporting rice to other states to meet the food security. One of
the pillars of success of the Government depends on planning the availability of rice. Rice
production is based on the soil type, rainfall, atmospheric temperature, sunshine intensity,
duration of sunshine, manure applied, inorganic fertilizers applied, weed control, application of
timely and sufficient irrigation water, outbreak of pests and diseases etc. Hence, rice production is
a complex process and hence, it is difficult to predict with the available data using serial
computations and serial algorithms. Some scientists attempted the prediction systems using
different modeling and simulations packages as a serial processing approach and meet varied
levels of success. To the best of the knowledge of the authors, nobody has made an attempt in
predicting rice production in Tamilnadu by building an ANN technique. Literature review states
that ANN is used to solve more complex problems (non linear problems) based on parallel
processing approach rather than the serial processing.
An Artificial Neural Network (ANN) is an information processing paradigm that is inspired by
the way biological nervous systems, such as the brain process information. The key element of
this paradigm is the novel structure of the information processing system. It is composed of a
large number of highly interconnected processing elements (neurons) working in unison to solve
specific problems. ANNs, like people, learn by example. An ANN is configured for a specific
application, such as pattern recognition or data classification, through a learning process.
Learning in biological systems involves adjustments to the synaptic connections that exist
between the neurons. This is true of ANNs as well. Neural networks are clusters of neurons that
are interconnected to process information.
1.1 Benefits of ANN
Already ANN was used to predict the weather forecasting problems and stock market behaviors.
Hence, the present paper is unique in the sense ANN is used to predict rice production in
Tamilnadu. At the same time, this research is needed for the food planning for Tamilnadu state to
solve a complex process using parallel processing approach. Several benefits of using ANN for
predicting rice production in Tamilnadu are shown below:
 ANN is a powerful modeling technique capable of solving non linear and complex process of
rice production using parallel processing approach
 ANN learns itself from the structure of training dataset and predicts the future data.
 ANN uses dimensionless numbers in its input and output variables.
 User feed input and get output without thinking about the dimensionality in computation
inside the hidden layer.
The overall objective of the present research is to “Design and Development of Artificial Neural
Networking (ANN) system using sigmoid activation function to predict annual rice production in
Tamilnadu”.
International Journal of Computer Science, Engineering and Information Technology (IJCSEIT), Vol.3, No.1, February 2013
15
2. REVIEW OF LITERATURE
2.1 Biology of Human Intelligence
The brain and nervous system are enormously complex. The brain itself is composed of billions
of nerve cells. The orchestration of all of these cells to allow people to sing, dance, write, talk,
and think. Neuroscientist [1] calls the brain the great integrator. The brain does a wonderful job
of pulling information together. The brain integrates all functions of the world including sounds,
sights, touch, taste, genes and environment. Neurons are the nerve cells that actually handle the
information processing function. The human brain contains about 100 billion neurons. The
average neuron is as complex as a small computer and has as many as 10,000 physical
connections with other cells.
Figure 1. Connection between one neuron to other neuron.
(Source: John W. Santrock, University of Texas, Dallas, 2005)
To have even the merest thought requires millions of neurons acting simultaneously [1]. Nerve
cells, chemicals, and electrical impulses work together to transmit information at speeds of up to
330 miles per hour. As a result, information can travel from our brain to our hands (or vice versa)
in a matter of milliseconds.
Neurons are specialized to handle different information processing functions. All neurons do have
some common characteristics. Most neurons are created very early in life, but their shape, size,
and connections can change throughout the life span. They are not fixed and immutable but can
change. Every neuron has a cell body, dendrites, and axon (see figure 1).
International Journal of Computer Science, Engineering and Information Technology (IJCSEIT), Vol.3, No.1, February 2013
16
Figure 2: The neural impulse travels down the axon toward dendrites of the next neuron.
(Source: John W. Santrock, University of Texas, Dallas, 2005)
The cell body contains the nucleus, which directs the manufacture of substances that the neuron
needs for growth and maintenance.
Dendrites receive and orient information toward the cell body. One of the most distinctive
features of neurons is the tree-like branching of their dendrites. Most nerve cells have numerous
dendrites, which increase their surface area, allowing each neuron to receive input from many
other neurons.
The axon is the part of the neuron that carries information away from the cell body toward other
cells. Although very thin (1/10,000th of an inch), axons can be very long, with many branches. In
fact, some extend more than three feet—all the way from the top of the brain to the base of the
spinal cord.
Covering all surfaces of neurons, including the dendrites and axons, are very thin cellular
membranes that are much like the surface of a bubble. The neuronal membranes are
semipermeable, meaning that they contain tiny holes or channels that allow only certain
substances to pass into and out of the neurons.
International Journal of Computer Science, Engineering and Information Technology (IJCSEIT), Vol.3, No.1, February 2013
17
A myelin sheath, a layer of fat cells, encases and insulates most axons. By insulating axons,
myelin sheaths speed up transmission of nerve impulses. Figure 2 shows how neural impulse
travel from sending neuron to receiving neuron.
2.1.1The Neural Impulse
A neuron sends information through its axon in the form of brief impulses, or waves, of
electricity. To transmit information to other neurons, a neuron sends impulses (“clicks”) through
its axon to the next neuron. By changing the rate and timing of the signals or “clicks,” the neuron
can vary its message.
2.1.2 Working of Synapses and Neurotransmitters:
a) The axon of the sending neuron meets dendrites of the receiving neuron.
b) This is an enlargement of one synapse, showing the synaptic gap between the two neurons,
the terminal button, and the synaptic vesicles containing a neurotransmitter.
c) There is an enlargement of the receptor site.
It is to be noted that how the neurotransmitter opens the channel on the receptor site, triggering
the neuron to fire.
2.2 ANN architecture
It was stated by [2] that a neural network is a massively parallel distributed processor that has a
natural propensity for storing experiential knowledge and making it available for use. Artificial
neural networks are computers whose architecture is modeled after the brain. It resembles the
brain in two respects: knowledge is acquired by the network through a learning process and inter-
neuron connection strengths known as synaptic weights are used to store the knowledge. They
typically consist of many hundreds of simple processing units, which are wired, together in a
complex communication network. Each unit or node is a simplified model of a real neuron, which
fires (sends off a new signal) if it receives a sufficiently strong input signal from the other nodes
to which it is connected. The strength of these connections may be varied to enable the network to
perform different tasks corresponding to different patterns of node firing activity. The basic
element of a neural network is the perceptron as shown in figure 3 below.
Figure 3: A simple perceptron Neural Network
International Journal of Computer Science, Engineering and Information Technology (IJCSEIT), Vol.3, No.1, February 2013
18
2.2.1 Sigmoid Function
A sigmoid function is a mathematical function having an "S" shape (sigmoid curve). Sigmoid
function is given by the following formula:
Sigmoid functions are very similar to the input-output relationships of biological neurons,
although not exactly the same. Sigmoid function exhibits smoothness and has the desired
asymptotic properties. The sigmoid curve is shown in figure 4.
As t goes to minus infinity, S(t) goes to 0.
As t goes to infinity, S(t) goes to 1.
As t =0, S(t) =0.5
Figure 4: Sigmoid activation function varies from 0 to 1 as a S shaped curve
2.2.2 Error Correction Learning
Error-Correction Learning is used with supervised learning. It is the technique of comparing the
system’s ANN output to the desired output value. The error is used to train the system for better
performance. The error values can be used to directly adjust thee weights, using an algorithm
such as the back propagation algorithm. If the system output is ANN output and the desired
system output is known actual data supplied. As per [3], the error can be computed using the
formula given below:
International Journal of Computer Science, Engineering and Information Technology (IJCSEIT), Vol.3, No.1, February 2013
19
Compare the error with threshold value of 10-9
. If the error was greater than threshold value then
calculate the updated weights and compute the summation using back propagation. This process
is repeated until error is zero.
2.3 ANN based applications
According to [4], it was attempted to forecast groundwater level of a watershed using ANN and
Fuzzy Logic. A three-layer feed-forward ANN was developed using the sigmoid function and the
back propagation algorithm. It was observed that ANNs perform significantly better than Fuzzy
Logic.
According to [5], prediction of rainfall in Chennai using back propagation neural network model
was carried out, the mean monthly rainfall is predicted using ANN model. The model can
perform well both in training and independent periods.
According to [6] there was a comparison of Dynamic Vs Static neural network models for
rainfall forecasting. AI based forecasting architectures using Multi-Layer Perceptron Neural
Networks (MLPNN) and Adaptive Neuron-Fuzzy Inference Systems (ANFIS could be suitable
for modeling the temporal dimension of the rainfall pattern and provided better forecasting
accuracy.
On the basis of humidity, dew point and pressure in India [7] has used the back propagation
neural network model for predicting the rainfall. In the training it was obtained that the prediction
accuracy was 99.79% in training and 94.28% in testing. From these results, it was concluded that
rainfall can be predicted in future using the back propagation neural network.
Rainfall-runoff prediction based on Artificial Neural Network was studied by [8] and found that
Artificial Neural Network method is more appropriate and efficient to predict the river runoff
than classical regression model.
The ANN model for Long-Range Meteorological Parameters Pattern Recognition over the
Smaller Scale Geographical Region was developed by [9] and the performances of this model in
pattern recognition and prediction have been found to be extremely good.
ANN was used in a new experiment [10] of short term temperature forecasting (STTF) and found
that multi layer perceptron network has the minimum forecasting error and can be considered as a
good method to model the STTF systems
According to [11] work was carried out to find out best hidden layer size for three layered neural
net work in predicting monsoon rainfall in India, and it was found that eleven-hidden-nodes in
three-layered neural network had more efficacy than asymptotic regression in the present
forecasting.
International Journal of Computer Science, Engineering and Information Technology (IJCSEIT), Vol.3, No.1, February 2013
20
ANN has the working features like human brain [12] and it has many desirable characteristics.
ANN has the following features:
a. massive parallelism
b. distributed representation and computation
c. learning ability
d. generalization ability
e. Adaptivity to complex problems, without knowing dimensions of data
f. inherent contextual information processing
g. fault tolerance
h. low energy consumption
NNs are universal approximators that can map any non linear functions [13]. NNs are powerful
tools for solving classifications and forecasting. NNs are less sensitive to error term assumptions
and can tolerate noise and chaotic components better than other methods.
Bendiktsoon et al. [14] compared neural networks and statistical approaches, together, with a
multispectral data classification. They noted that conventional multivariate classification methods
cannot be used in processing multisource spatial data. This is due to different distribution
properties and measurement scales.
Heermann and Khazenie [15] compared neural networks with more classical statistical methods.
Heerman and Khazenie's study emphasized the analysis of larger data sets with back propagation
methods, in which error is distributed throughout the network. They concluded that the back
propagation network could be easily modified to accommodate more features or to include spatial
and temporal information.
Hepner et al. [16] compared the use of neural network back propagation with a supervised
maximum likelihood classification method, using a minimum training set. The results showed
that a single training site per class of neural network classification was comparable to a four
training site per class of conventional classification. The result demonstrated that the neural
network method offered a potentially more robust approach to land cover classification than
conventional image classification methods.
Amini, J. [17] used, a Multi Layer Perceptron (MLP) network with a Back Propagation (BP)
algorithm is used for the classification of IRS-1D satellite images. A network with an optimum
learning rate is proposed. The MLP consists of neurons that are arranged in multiple layers with
connections only between nodes in the adjacent layers by weights. The layer where the input
information is presented is known as the input layer and the layer where the processed
information is retrieved is called the output layer. All layers between the input and output layers
are known as hidden layers. For all neurons in the network, except the input layer neurons, the
total input of each neuron is the sum of the weighted outputs of the neurons in the previous layer.
Each neuron is activated with input to the neuron and by the activation function of the neuron
[18].
International Journal of Computer Science, Engineering and Information Technology (IJCSEIT), Vol.3, No.1, February 2013
21
3. METHODOLOGY
The methodologies adopted are given below:
3.1 Selection of Variable
In rice production, the most important variables like the different districts, the area of cultivation
in each district, the production of rice in each district for three different seasons like Samba,
Kuruvai and Kodai were selected. Each season contain 2 variable area and cultivation. There are
3 seasons. Hence the total variables selected were 2 variables viz: area and production multiplied
by 3 seasons gives 6 variables.
3.2 Data Collection
The published data by the Government of Tamil Nadu [19] was used. Training data was collected
from the area and rice production of 31 districts for the year 2009-10. The test data was collected
from the 5 years average of the area and rice production of 31 districts for the years 2005-06 to
2009-10.
3.3 Data Preprocessing
The training and test data collected had some missing data marked with 0 values. If the study uses
these 0 values in computation, this 0 may divide any real number leading to infinity condition.
Computer cannot compute such infinity conditions. There are many data cleaning techniques
available for data preprocessing. The present study adopted the use of a global constant 0.01 in
place of 0 in training and test data. This replacement avoids the computational problem of
avoiding infinity during computations.
3.4 Architecture of ANN
The multilayer ANN architecture designed and developed in this research consists of three layers.
They are:
 Input layer
 Hidden layer and
 Output layer
The architecture of ANN designed for the prediction of rice production in Tamilnadu is given in
Figure 5.
3.4.1 Input layer
The input layer takes the independent data pertaining to the area of cultivation and the rice
production for the three seasons. These independent data are converted into sigmoid data between
0 to 1 using an activation function and the corresponding sigmoid data are represented as x1(i),
x2(i)…….x6(i). The general format of the activation function is given below:
International Journal of Computer Science, Engineering and Information Technology (IJCSEIT), Vol.3, No.1, February 2013
22
Where
s(x) is the sigmoid value. It varies from 0 to 1.
x is the independent input values like Area in Hectare and Rice Production in tonnes.
Figure 5. Architecture of ANN designed for predicting the rice production in Tamilnadu
3.4.2 Hidden Layer
The neurons in the hidden layers process the summation of the information received from the
connections of the input layer. Then it processes the summations with its activation function and
distributes the result to the next layer. This process continues down through the layers to the
output layer. In the hidden layer, the sigmoid data represented as x1(i), x2(i)…….x6(i) are
multiplied with initially assumed weights represented as wi. The initially assumed weights were
from 0 to 1. Each node is multiplied with weights as follows:
Where
Yi is the summation of each node Xi with corresponding initially assumed weights Wi plus bias.
Bias used is +1. Bias is added to the summation to make the summation a number other than 0. It
is essential to avoid 0 so that subsequent computations may not face division by zero (infinity). It
is well discussed in data preprocessing.
International Journal of Computer Science, Engineering and Information Technology (IJCSEIT), Vol.3, No.1, February 2013
23
3.4.3 Output Layer
The layer where the processed output information are computed and presented is called the output
layer. Different computations performed in the output layer are given below:
Steps Computations performed to evaluate the performance of ANN
1 Zi is processed by multiplication of output Yi from the hidden layer with initially
assumed weight Wk. There are totally six values Z(1), Z(2)……….Z(6).
Zi = Yi * Wk
2 Calculation of total of all six Z values. ZT(i) = ∑Zi
3 Convert the ZT(i) into ZS(i), that is sigmoid value from 0 to 1 using the same activation
function as given below:
4 Compute the ANN output for the six independent data like area and rice production
using the formula given below:
5 Compute the Error between actual input data and the ANN output data using the
formula given below:
6 Compare the error with threshold value of 10-9
. If the error is greater than threshold
value then calculate the updated weights using the formula given below:
New updated weight = Old weight + Increment of 0.01
7 Back propagation technique was adopted by computing the summation in the hidden
layer using updated weights. It computes six sets of Yi and six sets of Zi. The total of
six sets Zi is called one set of ZTi. The conversion of ZTi using activation function
gave ZSi. The multiplication of ZSi and actual value of variables gave the ANN output.
Repeat the process of feed forward and back propagation techniques until error is 0.
When error is 0, print the original input and the corresponding ANN output.
8 If original independent input data and the corresponding ANN output are same, the
research has predicted correctly without any deviations. This happens only when error is
0.
9 If there is difference between the original input data and the corresponding ANN output,
there are some deviations. The errors were worked out to understand how far the ANN
output was away from the original data. Then update the weights and follow the back
propagation technique of computing summations.
3.5 Supervised Learning in ANN
Learning in ANN is nothing but updating network architecture and connection weights so that the
network can efficiently predict the output. Performance is improved over time by iteratively
updating the weights in the network. In supervised learning, the network is provided with a
correct answer (output) for every input pattern. Weights are updated to allow the network to
produce answers as close as possible to the known correct answers.
International Journal of Computer Science, Engineering and Information Technology (IJCSEIT), Vol.3, No.1, February 2013
24
Compare the error with threshold value of 10-9
. If the error was greater than threshold value then
calculate the updated weights using the formula given below:
New updated weight = Old weight + Increment of 0.01.
After finding the new weights, adopt back propagation technique to compute all summations from
the beginnings until error equal to zero. It will predict exact ANN output.
4. RESULTS AND DISCUSSIONS
The input sigmoid values sending into the ANN and the output sigmoid values coming out from
the output layers are very important aspects to predict the correct answer. Hence, they are
discussed below:
4.1 Input Sigmoid values of independent data
The preprocessed training data was converted into sigmoid data using the sigmoid activation
function and the input sigmoid values for 3 seasonal area and productions are given below:
Table 1: Frequency distribution of Sigmoid values of training data containing area of rice cultivation and
its production in 2009-10
Table 1 show that the sigmoid value of 1 and 0.5025 were present after transformation of independent data
like area and rice production using sigmoid activation function. It was found that there is a range of 1 to 4
for 0.5025 and the majority values are 1s. The total number of 0.5025 is 15 and the remaining 171 items are
1s.
4.2 Effect of initial weights and increments in supervised training
The initial weights assumed were within the range of 0 to 1. The weights are updated for 17 times
to reach the 18th
iteration where the mean error between the original data and the ANN output is
0. Supervised training was carried out by updating the weights in every iteration so as to reduce
the initial error in 1st
iteration to 0 errors in the final iteration.
The mean error between original training data and the ANN output created by the software from 1
to 18 iterations were recorded in a excel file and the graph is drawn by keeping the iteration in x
International Journal of Computer Science, Engineering and Information Technology (IJCSEIT), Vol.3, No.1, February 2013
25
axis and the mean error of Kurvai area, Kuruvai production, Samba area, Samba production and
the Kodai area and Kodai productions in y axis. The graph is shown in figure 6.
Figure 6 shows the fact that the initial error computed for the ANN output from the original input
data for all the variable like Kuruvai area and production, Samba area and production and the
Kodai area and its production starts at 0.0000548 at the first iteration and the error of all the
variables become 0 at 18th
iteration. The error reduction pattern seen from the figure 6 follows the
same curve linear path. This shows that the non linearity and complexity of input data was
reduced and smoothened after the transformation by the sigmoidal activation function multiplied
by initial assumed weights and subsequent updated weights.
Figure 6: Mean Error between original training data and the ANN output from 1 to 18 iterations
The work of Heermann and Khazenie [15] who compared neural networks with more classical
statistical methods and found that the error is distributed throughout the network which uses back
propagation methods. The conclusion of Heermann and Khazenie [15] is in agreement in the
present study because the error is reduced in a smooth curve linear path for all the independent
variable from 0.0000548 to 0.
4.3 Effect of output sigmoid value for the training data from 1 to 18 iterations
It is found that the program stops its execution at 18th
iteration. The output sigmoid value for the
training data starts in the order of 0.9999 for all the 31 districts in its first iterations. All districts
attain the output sigmoid value of 1 at the last 18th
iteration. The output sigmoid values for all the
31 districts for all the 18 iterations were recorded in a excel file and the graph was drawn by
keeping the districts in x axis and the output sigmoid value in y axis. The graph is shown in figure
7 below:
International Journal of Computer Science, Engineering and Information Technology (IJCSEIT), Vol.3, No.1, February 2013
26
Figure 7: Effect of output sigmoid value for the training data from 1 to 18 iterations
Figure 7 shows the fact that for 1st
iteration, Karur district show a lower sigmoid value followed
by Ramanathapuram and Sivagangai districts. Sivagangai has the lowest sigmoid value in the 1st
iteration. As the iterations increased from 1to 18, the sigmoid values of variable moved to 1
because the error was reduced to 0. If the sigmoid value becomes 1, which is the highest value,
the graph becomes a straight line. The reason is non linear and complex data are converted into
linear which is the specialty of ANN.
It is interesting to note the fact that at 13th
iteration, all the 25 districts other than districts Karur,
Ramanathapuram, Virudhunagar, Sivagangai, Nilgiris and Kanyakumari got the highest output
sigmoid value of 1 meaning the error was 0. To make the output sigmoid value of six districts
Karur, Ramanathapuram, Virudhunagar, Sivagangai, Nilgiris and Kanyakumari to become 1 and
to make the error 0, the iterations were continued further by updating the weights with increment
of 0.01. It means conversion of nonlinearity to linearity continued from13th
iterations for all the
districts. The following observations were noted:
Table 2: Number of iterations and the output sigmoid value of 1 with 0 errors
S.No Name of Districts No. of iterations Output
sigmoid
value
Error of ANN
from actual
data
1 All 25 districts excepting Karur,
Ramanathapuram, Virudhunagar,
Sivagangai, Nilgiris and
Kanyakumari districts
12th
1 0
2 Karur district 13th
1 0
3 Ramanathapuram and Virudhunagar, 14th
1 0
4 Kanyakumari district 16th
1 0
5 Sivagangai and Nilgiris 18th
1 0
International Journal of Computer Science, Engineering and Information Technology (IJCSEIT), Vol.3, No.1, February 2013
27
(Note: output sigmoid value = 1 means error = 0)
The above facts can be well understood by seeing the straight line graph at 18th
iterations with the
output sigmoid value 1 for all the 31 districts. The discussion can be summed up with the fact that
the updated weight causes the summation to yield the maximum sigmoid value of +1. It means
the complex and non linearity of the input data is made linear.
4.4 Comparison of preprocessed training and testing data with their corresponding
ANN output
Table 3 shows that the original set of data is exactly matching with the ANN output. Since there
are 0 errors after 18th
iterations, the ANN output is same as original input data given into the
software developed and trained.
It was noted that at 12th
iteration, all the 25 districts other than districts of Karur,
Ramanathapuram, Virudhunagar, Sivagangai, Nilgiris and Kanyakumari got the ANN output
same as original input data. Karur district attained the got the ANN output same as original input
data at 13th
iteration. Ramanathapuram and Virudhunagar districts attained the ANN output same
as original input data at 14th
iteration. Kanyakumari district got the ANN output same as original
input data at 16th
iteration. Finally Sivagangai and Nilgiris districts got the ANN output same as
original input data at 18th
iteration.
Attaining the ANN output same as original input data means the prediction value will be exactly
same as desired value. The training of ANN software is perfectly done. The software understood
the complexities, non linearity and structure of training data.
Table 4 shows that the original set of test data is exactly matching with the ANN output. Since
there are 0 errors after 18th
iterations during the training phase, the ANN output for test data is
same as original input test data given into the software developed. The testing of ANN software
is perfectly done. The software understood the complexities and structure of training data and
hence it predict very correctly for the testing phase.
Similar to the ANN based rainfall prediction in Chennai [5] using back propagation neural
network, which performed well both in training and testing periods, the rice prediction model
developed in the study performed very well with 100% accuracy. Also, the ANN based rainfall-
runoff prediction model [8] worked efficiently to predict the river runoff, the rice prediction
model developed in the study performed very well with 100% accuracy.
There is 100% accuracy in prediction both in training and testing phase of the software. The
software developed in the present research can be used for Tamilnadu Government’s rice
prediction studies.
International Journal of Computer Science, Engineering and Information Technology (IJCSEIT), Vol.3, No.1, February 2013
28
Table 3: Comparison of preprocessed training data and the ANN output
5. SUMMARY AND CONCLUSIONS
Prediction of annual rice production in all the 31 districts of Tamilnadu is an important decision
for the Government of Tamilnadu so as to plan for the food security. One of the pillars of success
of the Government depends on planning the availability of rice for the state. Hence, design and
development of ANN system to predict rice production was successfully carried out. The system
uses the popular sigmoid activation function for both converting independent data like area and
production of rice and transferring the output sigmoid value back to area and production of rice.
The training and testing data were collected from published report of the Government of
Tamilnadu [19]. The following conclusions are drawn from the research.
1. The sigmoid value of 1 and 0.5025 were present after transformation of independent data
like area and rice production using sigmoid activation function. It was found that there
International Journal of Computer Science, Engineering and Information Technology (IJCSEIT), Vol.3, No.1, February 2013
29
were few values of 0.5025 and the majority values were 1s. The total number of 0.5025
was 15 and the remaining 171 items were 1s.
2. The initial error computed for the ANN output from the original input data for the entire
variable like Kuruvai area and its production, Samba area and its production and the
Kodai area and its production started at 0.0000548 at the first iteration and the error of all
the variables became 0 at 18th
iteration. The error reduction pattern for the entire six
variables followed the same curve linear path. This showed that the non linearity and
complexity of input data were reduced and smoothened after the transformation by the
sigmoid activation function multiplied by weights and subsequent updated weights.
3. It was noted that at 12th
iteration, all the 25 districts other than districts of Karur,
Ramanathapuram, Virudhunagar, Sivagangai, Nilgiris and Kanyakumari got the highest
output sigmoid value of 1 meaning the error was 0. To make the output sigmoid value of
six districts Karur, Ramanathapuram, Virudhunagar, Sivagangai, Nilgiris and
Kanyakumari to become with 0 error, the iterations were continued further. Karur district
attained the output sigmoid value 1 and error equal to 0 at 13th
iteration.
Ramanathapuram and Virudhunagar districts attained the output sigmoid value 1 and
error equal to 0 at 14th
iteration. Kanyakumari district attained the output sigmoid value
1 and error equal to 0 at 16th
iteration. Finally Sivagangai and Nilgiris districts attained
the sigmoid value of 1 at 18th
iteration. Attaining sigmoid value 1 means the prediction
value will be exactly same as desired value.
4. ANN architecture and software system were very well designed, developed, trained
perfectly with 100% accuracy and tested perfectly with 100% accuracy in predicting the
rice production for Tamilnadu. Hence, the research was completed with 100% accuracy
in prediction.
ACKNOWLEDGEMENTS
The PhD scholar first and foremost thank the almighty God for his abundant blessings and
protection during my studies and research work. I am highly indebted to Dr. K. Baskaran, my
research Director and Associate Professor, Dept. of Computer Science & Engineering and
Information Technology, Government College of Technology, Coimbatore for his involvement,
encouragement, suggestions and constructive criticism to make the research a grand success. I
also thank the members of my research committee Dr. Ebenezer Jeyakumar, Director
(Academic), Sri Ramakrishna College of Engineering, Vattamalaipalayam, Coimbatore and Dr.
M. Hemalatha, Head of the Department of Software systems, Karpagam University Coimbatore
for their suggestions and guidance to make my work more applied to the society.
REFERENCES
[1] John W. Santrock, University of Texas, Dallas, 2005, Psychology, 7th Edition, ISBN: 0072937769
published by McGraw-Hill, Chapter 3, Biological foundations of behaviors, pp 76-115.
[2] Thenmozhi,M. 2006, Forecasting stock index returns using Neural Networks published in Delhi
Business Review X Vol. 7, No. 2, July - December 2006.
International Journal of Computer Science, Engineering and Information Technology (IJCSEIT), Vol.3, No.1, February 2013
30
[3] Zabir Haider Khan, Tasnim Sharmin Alin and Md. Akter Hussain (2011) Price Prediction of Share
Market using Artificial Neural Network (ANN) published in International Journal of Computer
Applications (0975 – 8887) Volume 22– No.2, May 2011.
[4] Kavitha M.Mayilvaganan,.Naidu K.B, 2011, “ANN and Fuzzy Logic Models for the Prediction of
groundwater level of a watershed”, International Journal on Computer Science and Engineering, Vol.
3 No. 6, pp. 2523-2530.
[5] Geetha G.,. Selvaraj R Samuel, 2011, “Prediction of monthly rainfall in Chennai using back
propagation neural network model”, International Journal of Engineering Science and Technology,
Vol. 3 No. 1, pp. 211-213.
[6] El-Shafie A, Noureldin A., Taha M. R., and Hussain A., 2011, “Dynamic versus static neural network
model for rainfall forecasting at Klang River Basin, Malaysia”, Hydrol. Earth Syst. Sci., vol. 8, pp.
6489–6532.
[7] Vamsidhar Enireddy Varma K.V.S.R.P..Sankara Rao P satapati Ravikanth, 2010, “Prediction of
Rainfall Using Backpropagation Neural Network Model”, International Journal on Computer Science
and Engineering, Vol. 02, No. 04, pp. 1119-1121.
[8] Solaimani Karim, 2009, “Rainfall-runoff Prediction Based on Artificial Neural Network (A Case
Study: Jarahi Watershed)”, American-Eurasian J. Agric. & Environ. Sci., vol. 5(6), pp. 856-865.
[9] Karmakar Sanjeev et al., 2008, “Development of Artificial Neural Network Models for Long-Range
Meteorological Parameters Pattern Recognition over the Smaller Scale Geographical Region”, IEEE
Computer Society, Washington, DC, USA., 8-10 Dec. 2008, pp.1 – 6.
[10] Hayati Mohsen, and Mohebi Zahra, 2007, “Application of Artificial Neural Networks for
Temperature Forecasting”, World Academy of Science, Engineering and Technology, vol 28, pp.
275-279.
[11] Chattopadhyay Surajit and Chattopadhyay Goutami, 2008, “Identification of the best hidden layer
size for three layered neural net in predicting monsoon rainfall in India”, Journal of Hydroinformatics,
vol. 10(2), pp. 181-188.
[12] Ani1 K. Jain, Jianchang Mao and Mohiuddin, K.M. (1996 ), Artificial Neural Networks: A tutorial,
Michigan State University, published as per 0018-9162/96/$5.000, March 1996, IEEE pp 31 44.
[13] White, H. (1989), Learning in Neural Networks: A statistical perspective, Published in Neural
Computat, 4 (1989) 425 -464.
[14] Bendiktsson, J.A., Swain, P.H. and Ersoy, O.K. Neural network approaches versus statistical
methods on classification of multisource remote sensing data, IEEE Trans. Geosci. Remote Sensing,
28, pp. 540-552 (July 1990).
[15] Heermann, P. and Khazenie, N. Classification of multispectral remote sensing data using a
backpropagation neural network, IEEE Trans. on Geoscience and Remote Sensing, 30, pp. 81-88
(1992).
[16] Hepner, G., Logon, T., Rittner, N. and Bryant, N. Artificial neural network classification using a
minimum training set, Photogrammetry Engineering and Remote Sensing, 56(4), pp. 469-471 (1990).
[17] Amini,J. Optimum Learning Rate in Back-Propagation Neural Network for Classification of Satellite
Images (IRS-1D) published by Sharif University of Technology, December 2008 in Scientia Iranica,
Vol. 15, No. 6, pp. 558-567.
[18] McCelland, J.L. and Rumelhar, D.E., Parallel Distributed Processing, 1, MIT Press, Cambridge, MA,
USA (1986).
[19] Govt. of Tamil Nadu. Department of Economics and Statistics, Chennai ‐ 600 006 published, Report
Number R.No. 6 / 2011, Season and Crop Report, 2005-06 to 2009-10 (Fasli 1419).
International Journal of Computer Science, Engineering and Information Technology (IJCSEIT), Vol.3, No.1, February 2013
31
AUTHORS: SHORT BIOGRAPHY
1) Mr. S.Arun Balaji B.E and M.Tech (Information Technology)
PhD Scholar Computer Science & Engineering, Karpagam University
Coimbatore, India.
Teaching Experience: Total 4 years (2 years in India, 2 years abroad)
Email: arunbalaji1983@yahoo.co.in
2) Dr. K. Baskaran PhD; Associate Professor (CSE & IT)
Government College of Technology, Coimbatore– 641013, India
B.E, M.E and PhD: Computer Science & Engineering
Email: baski_101@yahoo.com
Mobile: +91-9443661901

More Related Content

Similar to DESIGN AND DEVELOPMENT OF ARTIFICIAL NEURAL NETWORKING (ANN) SYSTEM USING SIGMOID ACTIVATION FUNCTION TO PREDICT ANNUAL RICE PRODUCTION IN TAMILNADU

PLANT LEAFLET MALADY REVELATION UTILIZING CNN ALONGSIDE FOG SYSTEM
PLANT LEAFLET MALADY REVELATION UTILIZING CNN ALONGSIDE FOG SYSTEMPLANT LEAFLET MALADY REVELATION UTILIZING CNN ALONGSIDE FOG SYSTEM
PLANT LEAFLET MALADY REVELATION UTILIZING CNN ALONGSIDE FOG SYSTEMIRJET Journal
 
The Dawn of the Age of Artificially Intelligent Neuroprosthetics
The Dawn of the Age of Artificially Intelligent NeuroprostheticsThe Dawn of the Age of Artificially Intelligent Neuroprosthetics
The Dawn of the Age of Artificially Intelligent NeuroprostheticsSagar Hingal
 
Neurotechnology with Computing Systems
Neurotechnology with Computing SystemsNeurotechnology with Computing Systems
Neurotechnology with Computing SystemsAbhishiktha Dachepalli
 
Deep Learning-Based Approach for Thyroid Dysfunction Prediction
Deep Learning-Based Approach for Thyroid Dysfunction PredictionDeep Learning-Based Approach for Thyroid Dysfunction Prediction
Deep Learning-Based Approach for Thyroid Dysfunction PredictionIRJET Journal
 
Plant leaf identification system using convolutional neural network
Plant leaf identification system using convolutional neural networkPlant leaf identification system using convolutional neural network
Plant leaf identification system using convolutional neural networkjournalBEEI
 
Chapter 5 applications of neural networks
Chapter 5           applications of neural networksChapter 5           applications of neural networks
Chapter 5 applications of neural networksPunit Saini
 
An Artificial Neural Network Model for Neonatal Disease Diagnosis
An Artificial Neural Network Model for Neonatal Disease DiagnosisAn Artificial Neural Network Model for Neonatal Disease Diagnosis
An Artificial Neural Network Model for Neonatal Disease DiagnosisWaqas Tariq
 
A SOFTWARE AGENT FRAMEWORK TO OVERCOME MALICIOUS HOST THREATS AND UNCONTROLLE...
A SOFTWARE AGENT FRAMEWORK TO OVERCOME MALICIOUS HOST THREATS AND UNCONTROLLE...A SOFTWARE AGENT FRAMEWORK TO OVERCOME MALICIOUS HOST THREATS AND UNCONTROLLE...
A SOFTWARE AGENT FRAMEWORK TO OVERCOME MALICIOUS HOST THREATS AND UNCONTROLLE...ijait
 
Artificial Neural Network and its Applications
Artificial Neural Network and its ApplicationsArtificial Neural Network and its Applications
Artificial Neural Network and its Applicationsshritosh kumar
 
HOW NEURAL NETWORKS WORK
HOW NEURAL NETWORKS WORKHOW NEURAL NETWORKS WORK
HOW NEURAL NETWORKS WORKAM Publications
 
IRJET- Agricultural Crop Yield Prediction using Deep Learning Approach
IRJET-  	  Agricultural Crop Yield Prediction using Deep Learning ApproachIRJET-  	  Agricultural Crop Yield Prediction using Deep Learning Approach
IRJET- Agricultural Crop Yield Prediction using Deep Learning ApproachIRJET Journal
 

Similar to DESIGN AND DEVELOPMENT OF ARTIFICIAL NEURAL NETWORKING (ANN) SYSTEM USING SIGMOID ACTIVATION FUNCTION TO PREDICT ANNUAL RICE PRODUCTION IN TAMILNADU (20)

PLANT LEAFLET MALADY REVELATION UTILIZING CNN ALONGSIDE FOG SYSTEM
PLANT LEAFLET MALADY REVELATION UTILIZING CNN ALONGSIDE FOG SYSTEMPLANT LEAFLET MALADY REVELATION UTILIZING CNN ALONGSIDE FOG SYSTEM
PLANT LEAFLET MALADY REVELATION UTILIZING CNN ALONGSIDE FOG SYSTEM
 
D010242223
D010242223D010242223
D010242223
 
Reframing the Possibilities in Healthcare using Blue Brain Technology
Reframing the Possibilities in Healthcare using Blue Brain TechnologyReframing the Possibilities in Healthcare using Blue Brain Technology
Reframing the Possibilities in Healthcare using Blue Brain Technology
 
Reframing the Possibilities in Healthcare Using Blue Brain Technology
Reframing the Possibilities in Healthcare Using Blue Brain TechnologyReframing the Possibilities in Healthcare Using Blue Brain Technology
Reframing the Possibilities in Healthcare Using Blue Brain Technology
 
Artificial Neural Networks
Artificial Neural NetworksArtificial Neural Networks
Artificial Neural Networks
 
P2-Artificial.pdf
P2-Artificial.pdfP2-Artificial.pdf
P2-Artificial.pdf
 
The Dawn of the Age of Artificially Intelligent Neuroprosthetics
The Dawn of the Age of Artificially Intelligent NeuroprostheticsThe Dawn of the Age of Artificially Intelligent Neuroprosthetics
The Dawn of the Age of Artificially Intelligent Neuroprosthetics
 
Neurotechnology with Computing Systems
Neurotechnology with Computing SystemsNeurotechnology with Computing Systems
Neurotechnology with Computing Systems
 
Neuroinformatics
NeuroinformaticsNeuroinformatics
Neuroinformatics
 
NEUROINFORMATICS
NEUROINFORMATICSNEUROINFORMATICS
NEUROINFORMATICS
 
Deep Learning-Based Approach for Thyroid Dysfunction Prediction
Deep Learning-Based Approach for Thyroid Dysfunction PredictionDeep Learning-Based Approach for Thyroid Dysfunction Prediction
Deep Learning-Based Approach for Thyroid Dysfunction Prediction
 
Plant leaf identification system using convolutional neural network
Plant leaf identification system using convolutional neural networkPlant leaf identification system using convolutional neural network
Plant leaf identification system using convolutional neural network
 
Neuroprosthetics
NeuroprostheticsNeuroprosthetics
Neuroprosthetics
 
Chapter 5 applications of neural networks
Chapter 5           applications of neural networksChapter 5           applications of neural networks
Chapter 5 applications of neural networks
 
An Artificial Neural Network Model for Neonatal Disease Diagnosis
An Artificial Neural Network Model for Neonatal Disease DiagnosisAn Artificial Neural Network Model for Neonatal Disease Diagnosis
An Artificial Neural Network Model for Neonatal Disease Diagnosis
 
A SOFTWARE AGENT FRAMEWORK TO OVERCOME MALICIOUS HOST THREATS AND UNCONTROLLE...
A SOFTWARE AGENT FRAMEWORK TO OVERCOME MALICIOUS HOST THREATS AND UNCONTROLLE...A SOFTWARE AGENT FRAMEWORK TO OVERCOME MALICIOUS HOST THREATS AND UNCONTROLLE...
A SOFTWARE AGENT FRAMEWORK TO OVERCOME MALICIOUS HOST THREATS AND UNCONTROLLE...
 
ANN presentataion
ANN presentataionANN presentataion
ANN presentataion
 
Artificial Neural Network and its Applications
Artificial Neural Network and its ApplicationsArtificial Neural Network and its Applications
Artificial Neural Network and its Applications
 
HOW NEURAL NETWORKS WORK
HOW NEURAL NETWORKS WORKHOW NEURAL NETWORKS WORK
HOW NEURAL NETWORKS WORK
 
IRJET- Agricultural Crop Yield Prediction using Deep Learning Approach
IRJET-  	  Agricultural Crop Yield Prediction using Deep Learning ApproachIRJET-  	  Agricultural Crop Yield Prediction using Deep Learning Approach
IRJET- Agricultural Crop Yield Prediction using Deep Learning Approach
 

Recently uploaded

ONLINE FOOD ORDER SYSTEM PROJECT REPORT.pdf
ONLINE FOOD ORDER SYSTEM PROJECT REPORT.pdfONLINE FOOD ORDER SYSTEM PROJECT REPORT.pdf
ONLINE FOOD ORDER SYSTEM PROJECT REPORT.pdfKamal Acharya
 
The Most Attractive Pune Call Girls Budhwar Peth 8250192130 Will You Miss Thi...
The Most Attractive Pune Call Girls Budhwar Peth 8250192130 Will You Miss Thi...The Most Attractive Pune Call Girls Budhwar Peth 8250192130 Will You Miss Thi...
The Most Attractive Pune Call Girls Budhwar Peth 8250192130 Will You Miss Thi...ranjana rawat
 
Coefficient of Thermal Expansion and their Importance.pptx
Coefficient of Thermal Expansion and their Importance.pptxCoefficient of Thermal Expansion and their Importance.pptx
Coefficient of Thermal Expansion and their Importance.pptxAsutosh Ranjan
 
MANUFACTURING PROCESS-II UNIT-5 NC MACHINE TOOLS
MANUFACTURING PROCESS-II UNIT-5 NC MACHINE TOOLSMANUFACTURING PROCESS-II UNIT-5 NC MACHINE TOOLS
MANUFACTURING PROCESS-II UNIT-5 NC MACHINE TOOLSSIVASHANKAR N
 
Call for Papers - Educational Administration: Theory and Practice, E-ISSN: 21...
Call for Papers - Educational Administration: Theory and Practice, E-ISSN: 21...Call for Papers - Educational Administration: Theory and Practice, E-ISSN: 21...
Call for Papers - Educational Administration: Theory and Practice, E-ISSN: 21...Christo Ananth
 
UNIT - IV - Air Compressors and its Performance
UNIT - IV - Air Compressors and its PerformanceUNIT - IV - Air Compressors and its Performance
UNIT - IV - Air Compressors and its Performancesivaprakash250
 
CCS335 _ Neural Networks and Deep Learning Laboratory_Lab Complete Record
CCS335 _ Neural Networks and Deep Learning Laboratory_Lab Complete RecordCCS335 _ Neural Networks and Deep Learning Laboratory_Lab Complete Record
CCS335 _ Neural Networks and Deep Learning Laboratory_Lab Complete RecordAsst.prof M.Gokilavani
 
(PRIYA) Rajgurunagar Call Girls Just Call 7001035870 [ Cash on Delivery ] Pun...
(PRIYA) Rajgurunagar Call Girls Just Call 7001035870 [ Cash on Delivery ] Pun...(PRIYA) Rajgurunagar Call Girls Just Call 7001035870 [ Cash on Delivery ] Pun...
(PRIYA) Rajgurunagar Call Girls Just Call 7001035870 [ Cash on Delivery ] Pun...ranjana rawat
 
AKTU Computer Networks notes --- Unit 3.pdf
AKTU Computer Networks notes ---  Unit 3.pdfAKTU Computer Networks notes ---  Unit 3.pdf
AKTU Computer Networks notes --- Unit 3.pdfankushspencer015
 
University management System project report..pdf
University management System project report..pdfUniversity management System project report..pdf
University management System project report..pdfKamal Acharya
 
KubeKraft presentation @CloudNativeHooghly
KubeKraft presentation @CloudNativeHooghlyKubeKraft presentation @CloudNativeHooghly
KubeKraft presentation @CloudNativeHooghlysanyuktamishra911
 
Call Girls Service Nashik Vaishnavi 7001305949 Independent Escort Service Nashik
Call Girls Service Nashik Vaishnavi 7001305949 Independent Escort Service NashikCall Girls Service Nashik Vaishnavi 7001305949 Independent Escort Service Nashik
Call Girls Service Nashik Vaishnavi 7001305949 Independent Escort Service NashikCall Girls in Nagpur High Profile
 
(ANVI) Koregaon Park Call Girls Just Call 7001035870 [ Cash on Delivery ] Pun...
(ANVI) Koregaon Park Call Girls Just Call 7001035870 [ Cash on Delivery ] Pun...(ANVI) Koregaon Park Call Girls Just Call 7001035870 [ Cash on Delivery ] Pun...
(ANVI) Koregaon Park Call Girls Just Call 7001035870 [ Cash on Delivery ] Pun...ranjana rawat
 
Java Programming :Event Handling(Types of Events)
Java Programming :Event Handling(Types of Events)Java Programming :Event Handling(Types of Events)
Java Programming :Event Handling(Types of Events)simmis5
 
Booking open Available Pune Call Girls Koregaon Park 6297143586 Call Hot Ind...
Booking open Available Pune Call Girls Koregaon Park  6297143586 Call Hot Ind...Booking open Available Pune Call Girls Koregaon Park  6297143586 Call Hot Ind...
Booking open Available Pune Call Girls Koregaon Park 6297143586 Call Hot Ind...Call Girls in Nagpur High Profile
 
Sheet Pile Wall Design and Construction: A Practical Guide for Civil Engineer...
Sheet Pile Wall Design and Construction: A Practical Guide for Civil Engineer...Sheet Pile Wall Design and Construction: A Practical Guide for Civil Engineer...
Sheet Pile Wall Design and Construction: A Practical Guide for Civil Engineer...Dr.Costas Sachpazis
 
result management system report for college project
result management system report for college projectresult management system report for college project
result management system report for college projectTonystark477637
 
Introduction to Multiple Access Protocol.pptx
Introduction to Multiple Access Protocol.pptxIntroduction to Multiple Access Protocol.pptx
Introduction to Multiple Access Protocol.pptxupamatechverse
 
Booking open Available Pune Call Girls Pargaon 6297143586 Call Hot Indian Gi...
Booking open Available Pune Call Girls Pargaon  6297143586 Call Hot Indian Gi...Booking open Available Pune Call Girls Pargaon  6297143586 Call Hot Indian Gi...
Booking open Available Pune Call Girls Pargaon 6297143586 Call Hot Indian Gi...Call Girls in Nagpur High Profile
 

Recently uploaded (20)

ONLINE FOOD ORDER SYSTEM PROJECT REPORT.pdf
ONLINE FOOD ORDER SYSTEM PROJECT REPORT.pdfONLINE FOOD ORDER SYSTEM PROJECT REPORT.pdf
ONLINE FOOD ORDER SYSTEM PROJECT REPORT.pdf
 
The Most Attractive Pune Call Girls Budhwar Peth 8250192130 Will You Miss Thi...
The Most Attractive Pune Call Girls Budhwar Peth 8250192130 Will You Miss Thi...The Most Attractive Pune Call Girls Budhwar Peth 8250192130 Will You Miss Thi...
The Most Attractive Pune Call Girls Budhwar Peth 8250192130 Will You Miss Thi...
 
Coefficient of Thermal Expansion and their Importance.pptx
Coefficient of Thermal Expansion and their Importance.pptxCoefficient of Thermal Expansion and their Importance.pptx
Coefficient of Thermal Expansion and their Importance.pptx
 
MANUFACTURING PROCESS-II UNIT-5 NC MACHINE TOOLS
MANUFACTURING PROCESS-II UNIT-5 NC MACHINE TOOLSMANUFACTURING PROCESS-II UNIT-5 NC MACHINE TOOLS
MANUFACTURING PROCESS-II UNIT-5 NC MACHINE TOOLS
 
Call for Papers - Educational Administration: Theory and Practice, E-ISSN: 21...
Call for Papers - Educational Administration: Theory and Practice, E-ISSN: 21...Call for Papers - Educational Administration: Theory and Practice, E-ISSN: 21...
Call for Papers - Educational Administration: Theory and Practice, E-ISSN: 21...
 
UNIT - IV - Air Compressors and its Performance
UNIT - IV - Air Compressors and its PerformanceUNIT - IV - Air Compressors and its Performance
UNIT - IV - Air Compressors and its Performance
 
CCS335 _ Neural Networks and Deep Learning Laboratory_Lab Complete Record
CCS335 _ Neural Networks and Deep Learning Laboratory_Lab Complete RecordCCS335 _ Neural Networks and Deep Learning Laboratory_Lab Complete Record
CCS335 _ Neural Networks and Deep Learning Laboratory_Lab Complete Record
 
Water Industry Process Automation & Control Monthly - April 2024
Water Industry Process Automation & Control Monthly - April 2024Water Industry Process Automation & Control Monthly - April 2024
Water Industry Process Automation & Control Monthly - April 2024
 
(PRIYA) Rajgurunagar Call Girls Just Call 7001035870 [ Cash on Delivery ] Pun...
(PRIYA) Rajgurunagar Call Girls Just Call 7001035870 [ Cash on Delivery ] Pun...(PRIYA) Rajgurunagar Call Girls Just Call 7001035870 [ Cash on Delivery ] Pun...
(PRIYA) Rajgurunagar Call Girls Just Call 7001035870 [ Cash on Delivery ] Pun...
 
AKTU Computer Networks notes --- Unit 3.pdf
AKTU Computer Networks notes ---  Unit 3.pdfAKTU Computer Networks notes ---  Unit 3.pdf
AKTU Computer Networks notes --- Unit 3.pdf
 
University management System project report..pdf
University management System project report..pdfUniversity management System project report..pdf
University management System project report..pdf
 
KubeKraft presentation @CloudNativeHooghly
KubeKraft presentation @CloudNativeHooghlyKubeKraft presentation @CloudNativeHooghly
KubeKraft presentation @CloudNativeHooghly
 
Call Girls Service Nashik Vaishnavi 7001305949 Independent Escort Service Nashik
Call Girls Service Nashik Vaishnavi 7001305949 Independent Escort Service NashikCall Girls Service Nashik Vaishnavi 7001305949 Independent Escort Service Nashik
Call Girls Service Nashik Vaishnavi 7001305949 Independent Escort Service Nashik
 
(ANVI) Koregaon Park Call Girls Just Call 7001035870 [ Cash on Delivery ] Pun...
(ANVI) Koregaon Park Call Girls Just Call 7001035870 [ Cash on Delivery ] Pun...(ANVI) Koregaon Park Call Girls Just Call 7001035870 [ Cash on Delivery ] Pun...
(ANVI) Koregaon Park Call Girls Just Call 7001035870 [ Cash on Delivery ] Pun...
 
Java Programming :Event Handling(Types of Events)
Java Programming :Event Handling(Types of Events)Java Programming :Event Handling(Types of Events)
Java Programming :Event Handling(Types of Events)
 
Booking open Available Pune Call Girls Koregaon Park 6297143586 Call Hot Ind...
Booking open Available Pune Call Girls Koregaon Park  6297143586 Call Hot Ind...Booking open Available Pune Call Girls Koregaon Park  6297143586 Call Hot Ind...
Booking open Available Pune Call Girls Koregaon Park 6297143586 Call Hot Ind...
 
Sheet Pile Wall Design and Construction: A Practical Guide for Civil Engineer...
Sheet Pile Wall Design and Construction: A Practical Guide for Civil Engineer...Sheet Pile Wall Design and Construction: A Practical Guide for Civil Engineer...
Sheet Pile Wall Design and Construction: A Practical Guide for Civil Engineer...
 
result management system report for college project
result management system report for college projectresult management system report for college project
result management system report for college project
 
Introduction to Multiple Access Protocol.pptx
Introduction to Multiple Access Protocol.pptxIntroduction to Multiple Access Protocol.pptx
Introduction to Multiple Access Protocol.pptx
 
Booking open Available Pune Call Girls Pargaon 6297143586 Call Hot Indian Gi...
Booking open Available Pune Call Girls Pargaon  6297143586 Call Hot Indian Gi...Booking open Available Pune Call Girls Pargaon  6297143586 Call Hot Indian Gi...
Booking open Available Pune Call Girls Pargaon 6297143586 Call Hot Indian Gi...
 

DESIGN AND DEVELOPMENT OF ARTIFICIAL NEURAL NETWORKING (ANN) SYSTEM USING SIGMOID ACTIVATION FUNCTION TO PREDICT ANNUAL RICE PRODUCTION IN TAMILNADU

  • 1. International Journal of Computer Science, Engineering and Information Technology (IJCSEIT), Vol.3, No.1, February 2013 DOI : 10.5121/ijcseit.2013.3102 13 DESIGN AND DEVELOPMENT OF ARTIFICIAL NEURAL NETWORKING (ANN) SYSTEM USING SIGMOID ACTIVATION FUNCTION TO PREDICT ANNUAL RICE PRODUCTION IN TAMILNADU S.Arun Balaji1 and K.Baskaran2 1 PhD scholar, Computer Science & Engineering, Karpagam University, Coimbatore, India. Email: arunbalaji1983@yahoo.co.in 2 PhD Research Director and Associate Professor, Dept. of Computer Science & Engineering and Information Technology, Government College of Technology (GCT), Coimbatore, India. Email: baski_101@yahoo.com ABSTRACT Prediction of annual rice production in all the 31 districts of Tamilnadu is an important decision for the Government of Tamilnadu. Rice production is a complex process and non linear problem involving soil, crop, weather, pest, disease, capital, labour and management parameters. ANN software was designed and developed with Feed Forward Back Propagation (FFBP) network to predict rice production. The input layer has six independent variables like area of cultivation and rice production in three seasons like Kuruvai, Samba and Kodai. The popular sigmoid activation function was adopted to convert input data into sigmoid values. The hidden layer computes the summation of six sigmoid values with six sets of weightages. The final output was converted into sigmoid values using a sigmoid transfer function. ANN outputs are the predicted results. The error between original data and ANN output values were computed. A threshold value of 10-9 was used to test whether the error is greater than the threshold level. If the error is greater than threshold then updating of weights was done all summations were done by back propagation. This process was repeated until error equal to zero. The predicted results were printed and it was found to be exactly matching with the expected values. It shows that the ANN prediction was 100% accurate. KEYWORDS Design, Development, Artificial Neural Network, Prediction of rice production 1. INTRODUCTION Rice is the stable food for Tamil Nadu. Prediction of annual rice production in all the 31 districts of Tamilnadu is an important decision for the Government of Tamilnadu so as to plan for
  • 2. International Journal of Computer Science, Engineering and Information Technology (IJCSEIT), Vol.3, No.1, February 2013 14 importing rice from other state or exporting rice to other states to meet the food security. One of the pillars of success of the Government depends on planning the availability of rice. Rice production is based on the soil type, rainfall, atmospheric temperature, sunshine intensity, duration of sunshine, manure applied, inorganic fertilizers applied, weed control, application of timely and sufficient irrigation water, outbreak of pests and diseases etc. Hence, rice production is a complex process and hence, it is difficult to predict with the available data using serial computations and serial algorithms. Some scientists attempted the prediction systems using different modeling and simulations packages as a serial processing approach and meet varied levels of success. To the best of the knowledge of the authors, nobody has made an attempt in predicting rice production in Tamilnadu by building an ANN technique. Literature review states that ANN is used to solve more complex problems (non linear problems) based on parallel processing approach rather than the serial processing. An Artificial Neural Network (ANN) is an information processing paradigm that is inspired by the way biological nervous systems, such as the brain process information. The key element of this paradigm is the novel structure of the information processing system. It is composed of a large number of highly interconnected processing elements (neurons) working in unison to solve specific problems. ANNs, like people, learn by example. An ANN is configured for a specific application, such as pattern recognition or data classification, through a learning process. Learning in biological systems involves adjustments to the synaptic connections that exist between the neurons. This is true of ANNs as well. Neural networks are clusters of neurons that are interconnected to process information. 1.1 Benefits of ANN Already ANN was used to predict the weather forecasting problems and stock market behaviors. Hence, the present paper is unique in the sense ANN is used to predict rice production in Tamilnadu. At the same time, this research is needed for the food planning for Tamilnadu state to solve a complex process using parallel processing approach. Several benefits of using ANN for predicting rice production in Tamilnadu are shown below:  ANN is a powerful modeling technique capable of solving non linear and complex process of rice production using parallel processing approach  ANN learns itself from the structure of training dataset and predicts the future data.  ANN uses dimensionless numbers in its input and output variables.  User feed input and get output without thinking about the dimensionality in computation inside the hidden layer. The overall objective of the present research is to “Design and Development of Artificial Neural Networking (ANN) system using sigmoid activation function to predict annual rice production in Tamilnadu”.
  • 3. International Journal of Computer Science, Engineering and Information Technology (IJCSEIT), Vol.3, No.1, February 2013 15 2. REVIEW OF LITERATURE 2.1 Biology of Human Intelligence The brain and nervous system are enormously complex. The brain itself is composed of billions of nerve cells. The orchestration of all of these cells to allow people to sing, dance, write, talk, and think. Neuroscientist [1] calls the brain the great integrator. The brain does a wonderful job of pulling information together. The brain integrates all functions of the world including sounds, sights, touch, taste, genes and environment. Neurons are the nerve cells that actually handle the information processing function. The human brain contains about 100 billion neurons. The average neuron is as complex as a small computer and has as many as 10,000 physical connections with other cells. Figure 1. Connection between one neuron to other neuron. (Source: John W. Santrock, University of Texas, Dallas, 2005) To have even the merest thought requires millions of neurons acting simultaneously [1]. Nerve cells, chemicals, and electrical impulses work together to transmit information at speeds of up to 330 miles per hour. As a result, information can travel from our brain to our hands (or vice versa) in a matter of milliseconds. Neurons are specialized to handle different information processing functions. All neurons do have some common characteristics. Most neurons are created very early in life, but their shape, size, and connections can change throughout the life span. They are not fixed and immutable but can change. Every neuron has a cell body, dendrites, and axon (see figure 1).
  • 4. International Journal of Computer Science, Engineering and Information Technology (IJCSEIT), Vol.3, No.1, February 2013 16 Figure 2: The neural impulse travels down the axon toward dendrites of the next neuron. (Source: John W. Santrock, University of Texas, Dallas, 2005) The cell body contains the nucleus, which directs the manufacture of substances that the neuron needs for growth and maintenance. Dendrites receive and orient information toward the cell body. One of the most distinctive features of neurons is the tree-like branching of their dendrites. Most nerve cells have numerous dendrites, which increase their surface area, allowing each neuron to receive input from many other neurons. The axon is the part of the neuron that carries information away from the cell body toward other cells. Although very thin (1/10,000th of an inch), axons can be very long, with many branches. In fact, some extend more than three feet—all the way from the top of the brain to the base of the spinal cord. Covering all surfaces of neurons, including the dendrites and axons, are very thin cellular membranes that are much like the surface of a bubble. The neuronal membranes are semipermeable, meaning that they contain tiny holes or channels that allow only certain substances to pass into and out of the neurons.
  • 5. International Journal of Computer Science, Engineering and Information Technology (IJCSEIT), Vol.3, No.1, February 2013 17 A myelin sheath, a layer of fat cells, encases and insulates most axons. By insulating axons, myelin sheaths speed up transmission of nerve impulses. Figure 2 shows how neural impulse travel from sending neuron to receiving neuron. 2.1.1The Neural Impulse A neuron sends information through its axon in the form of brief impulses, or waves, of electricity. To transmit information to other neurons, a neuron sends impulses (“clicks”) through its axon to the next neuron. By changing the rate and timing of the signals or “clicks,” the neuron can vary its message. 2.1.2 Working of Synapses and Neurotransmitters: a) The axon of the sending neuron meets dendrites of the receiving neuron. b) This is an enlargement of one synapse, showing the synaptic gap between the two neurons, the terminal button, and the synaptic vesicles containing a neurotransmitter. c) There is an enlargement of the receptor site. It is to be noted that how the neurotransmitter opens the channel on the receptor site, triggering the neuron to fire. 2.2 ANN architecture It was stated by [2] that a neural network is a massively parallel distributed processor that has a natural propensity for storing experiential knowledge and making it available for use. Artificial neural networks are computers whose architecture is modeled after the brain. It resembles the brain in two respects: knowledge is acquired by the network through a learning process and inter- neuron connection strengths known as synaptic weights are used to store the knowledge. They typically consist of many hundreds of simple processing units, which are wired, together in a complex communication network. Each unit or node is a simplified model of a real neuron, which fires (sends off a new signal) if it receives a sufficiently strong input signal from the other nodes to which it is connected. The strength of these connections may be varied to enable the network to perform different tasks corresponding to different patterns of node firing activity. The basic element of a neural network is the perceptron as shown in figure 3 below. Figure 3: A simple perceptron Neural Network
  • 6. International Journal of Computer Science, Engineering and Information Technology (IJCSEIT), Vol.3, No.1, February 2013 18 2.2.1 Sigmoid Function A sigmoid function is a mathematical function having an "S" shape (sigmoid curve). Sigmoid function is given by the following formula: Sigmoid functions are very similar to the input-output relationships of biological neurons, although not exactly the same. Sigmoid function exhibits smoothness and has the desired asymptotic properties. The sigmoid curve is shown in figure 4. As t goes to minus infinity, S(t) goes to 0. As t goes to infinity, S(t) goes to 1. As t =0, S(t) =0.5 Figure 4: Sigmoid activation function varies from 0 to 1 as a S shaped curve 2.2.2 Error Correction Learning Error-Correction Learning is used with supervised learning. It is the technique of comparing the system’s ANN output to the desired output value. The error is used to train the system for better performance. The error values can be used to directly adjust thee weights, using an algorithm such as the back propagation algorithm. If the system output is ANN output and the desired system output is known actual data supplied. As per [3], the error can be computed using the formula given below: International Journal of Computer Science, Engineering and Information Technology (IJCSEIT), Vol.3, No.1, February 2013 18 2.2.1 Sigmoid Function A sigmoid function is a mathematical function having an "S" shape (sigmoid curve). Sigmoid function is given by the following formula: Sigmoid functions are very similar to the input-output relationships of biological neurons, although not exactly the same. Sigmoid function exhibits smoothness and has the desired asymptotic properties. The sigmoid curve is shown in figure 4. As t goes to minus infinity, S(t) goes to 0. As t goes to infinity, S(t) goes to 1. As t =0, S(t) =0.5 Figure 4: Sigmoid activation function varies from 0 to 1 as a S shaped curve 2.2.2 Error Correction Learning Error-Correction Learning is used with supervised learning. It is the technique of comparing the system’s ANN output to the desired output value. The error is used to train the system for better performance. The error values can be used to directly adjust thee weights, using an algorithm such as the back propagation algorithm. If the system output is ANN output and the desired system output is known actual data supplied. As per [3], the error can be computed using the formula given below: International Journal of Computer Science, Engineering and Information Technology (IJCSEIT), Vol.3, No.1, February 2013 18 2.2.1 Sigmoid Function A sigmoid function is a mathematical function having an "S" shape (sigmoid curve). Sigmoid function is given by the following formula: Sigmoid functions are very similar to the input-output relationships of biological neurons, although not exactly the same. Sigmoid function exhibits smoothness and has the desired asymptotic properties. The sigmoid curve is shown in figure 4. As t goes to minus infinity, S(t) goes to 0. As t goes to infinity, S(t) goes to 1. As t =0, S(t) =0.5 Figure 4: Sigmoid activation function varies from 0 to 1 as a S shaped curve 2.2.2 Error Correction Learning Error-Correction Learning is used with supervised learning. It is the technique of comparing the system’s ANN output to the desired output value. The error is used to train the system for better performance. The error values can be used to directly adjust thee weights, using an algorithm such as the back propagation algorithm. If the system output is ANN output and the desired system output is known actual data supplied. As per [3], the error can be computed using the formula given below:
  • 7. International Journal of Computer Science, Engineering and Information Technology (IJCSEIT), Vol.3, No.1, February 2013 19 Compare the error with threshold value of 10-9 . If the error was greater than threshold value then calculate the updated weights and compute the summation using back propagation. This process is repeated until error is zero. 2.3 ANN based applications According to [4], it was attempted to forecast groundwater level of a watershed using ANN and Fuzzy Logic. A three-layer feed-forward ANN was developed using the sigmoid function and the back propagation algorithm. It was observed that ANNs perform significantly better than Fuzzy Logic. According to [5], prediction of rainfall in Chennai using back propagation neural network model was carried out, the mean monthly rainfall is predicted using ANN model. The model can perform well both in training and independent periods. According to [6] there was a comparison of Dynamic Vs Static neural network models for rainfall forecasting. AI based forecasting architectures using Multi-Layer Perceptron Neural Networks (MLPNN) and Adaptive Neuron-Fuzzy Inference Systems (ANFIS could be suitable for modeling the temporal dimension of the rainfall pattern and provided better forecasting accuracy. On the basis of humidity, dew point and pressure in India [7] has used the back propagation neural network model for predicting the rainfall. In the training it was obtained that the prediction accuracy was 99.79% in training and 94.28% in testing. From these results, it was concluded that rainfall can be predicted in future using the back propagation neural network. Rainfall-runoff prediction based on Artificial Neural Network was studied by [8] and found that Artificial Neural Network method is more appropriate and efficient to predict the river runoff than classical regression model. The ANN model for Long-Range Meteorological Parameters Pattern Recognition over the Smaller Scale Geographical Region was developed by [9] and the performances of this model in pattern recognition and prediction have been found to be extremely good. ANN was used in a new experiment [10] of short term temperature forecasting (STTF) and found that multi layer perceptron network has the minimum forecasting error and can be considered as a good method to model the STTF systems According to [11] work was carried out to find out best hidden layer size for three layered neural net work in predicting monsoon rainfall in India, and it was found that eleven-hidden-nodes in three-layered neural network had more efficacy than asymptotic regression in the present forecasting.
  • 8. International Journal of Computer Science, Engineering and Information Technology (IJCSEIT), Vol.3, No.1, February 2013 20 ANN has the working features like human brain [12] and it has many desirable characteristics. ANN has the following features: a. massive parallelism b. distributed representation and computation c. learning ability d. generalization ability e. Adaptivity to complex problems, without knowing dimensions of data f. inherent contextual information processing g. fault tolerance h. low energy consumption NNs are universal approximators that can map any non linear functions [13]. NNs are powerful tools for solving classifications and forecasting. NNs are less sensitive to error term assumptions and can tolerate noise and chaotic components better than other methods. Bendiktsoon et al. [14] compared neural networks and statistical approaches, together, with a multispectral data classification. They noted that conventional multivariate classification methods cannot be used in processing multisource spatial data. This is due to different distribution properties and measurement scales. Heermann and Khazenie [15] compared neural networks with more classical statistical methods. Heerman and Khazenie's study emphasized the analysis of larger data sets with back propagation methods, in which error is distributed throughout the network. They concluded that the back propagation network could be easily modified to accommodate more features or to include spatial and temporal information. Hepner et al. [16] compared the use of neural network back propagation with a supervised maximum likelihood classification method, using a minimum training set. The results showed that a single training site per class of neural network classification was comparable to a four training site per class of conventional classification. The result demonstrated that the neural network method offered a potentially more robust approach to land cover classification than conventional image classification methods. Amini, J. [17] used, a Multi Layer Perceptron (MLP) network with a Back Propagation (BP) algorithm is used for the classification of IRS-1D satellite images. A network with an optimum learning rate is proposed. The MLP consists of neurons that are arranged in multiple layers with connections only between nodes in the adjacent layers by weights. The layer where the input information is presented is known as the input layer and the layer where the processed information is retrieved is called the output layer. All layers between the input and output layers are known as hidden layers. For all neurons in the network, except the input layer neurons, the total input of each neuron is the sum of the weighted outputs of the neurons in the previous layer. Each neuron is activated with input to the neuron and by the activation function of the neuron [18].
  • 9. International Journal of Computer Science, Engineering and Information Technology (IJCSEIT), Vol.3, No.1, February 2013 21 3. METHODOLOGY The methodologies adopted are given below: 3.1 Selection of Variable In rice production, the most important variables like the different districts, the area of cultivation in each district, the production of rice in each district for three different seasons like Samba, Kuruvai and Kodai were selected. Each season contain 2 variable area and cultivation. There are 3 seasons. Hence the total variables selected were 2 variables viz: area and production multiplied by 3 seasons gives 6 variables. 3.2 Data Collection The published data by the Government of Tamil Nadu [19] was used. Training data was collected from the area and rice production of 31 districts for the year 2009-10. The test data was collected from the 5 years average of the area and rice production of 31 districts for the years 2005-06 to 2009-10. 3.3 Data Preprocessing The training and test data collected had some missing data marked with 0 values. If the study uses these 0 values in computation, this 0 may divide any real number leading to infinity condition. Computer cannot compute such infinity conditions. There are many data cleaning techniques available for data preprocessing. The present study adopted the use of a global constant 0.01 in place of 0 in training and test data. This replacement avoids the computational problem of avoiding infinity during computations. 3.4 Architecture of ANN The multilayer ANN architecture designed and developed in this research consists of three layers. They are:  Input layer  Hidden layer and  Output layer The architecture of ANN designed for the prediction of rice production in Tamilnadu is given in Figure 5. 3.4.1 Input layer The input layer takes the independent data pertaining to the area of cultivation and the rice production for the three seasons. These independent data are converted into sigmoid data between 0 to 1 using an activation function and the corresponding sigmoid data are represented as x1(i), x2(i)…….x6(i). The general format of the activation function is given below:
  • 10. International Journal of Computer Science, Engineering and Information Technology (IJCSEIT), Vol.3, No.1, February 2013 22 Where s(x) is the sigmoid value. It varies from 0 to 1. x is the independent input values like Area in Hectare and Rice Production in tonnes. Figure 5. Architecture of ANN designed for predicting the rice production in Tamilnadu 3.4.2 Hidden Layer The neurons in the hidden layers process the summation of the information received from the connections of the input layer. Then it processes the summations with its activation function and distributes the result to the next layer. This process continues down through the layers to the output layer. In the hidden layer, the sigmoid data represented as x1(i), x2(i)…….x6(i) are multiplied with initially assumed weights represented as wi. The initially assumed weights were from 0 to 1. Each node is multiplied with weights as follows: Where Yi is the summation of each node Xi with corresponding initially assumed weights Wi plus bias. Bias used is +1. Bias is added to the summation to make the summation a number other than 0. It is essential to avoid 0 so that subsequent computations may not face division by zero (infinity). It is well discussed in data preprocessing.
  • 11. International Journal of Computer Science, Engineering and Information Technology (IJCSEIT), Vol.3, No.1, February 2013 23 3.4.3 Output Layer The layer where the processed output information are computed and presented is called the output layer. Different computations performed in the output layer are given below: Steps Computations performed to evaluate the performance of ANN 1 Zi is processed by multiplication of output Yi from the hidden layer with initially assumed weight Wk. There are totally six values Z(1), Z(2)……….Z(6). Zi = Yi * Wk 2 Calculation of total of all six Z values. ZT(i) = ∑Zi 3 Convert the ZT(i) into ZS(i), that is sigmoid value from 0 to 1 using the same activation function as given below: 4 Compute the ANN output for the six independent data like area and rice production using the formula given below: 5 Compute the Error between actual input data and the ANN output data using the formula given below: 6 Compare the error with threshold value of 10-9 . If the error is greater than threshold value then calculate the updated weights using the formula given below: New updated weight = Old weight + Increment of 0.01 7 Back propagation technique was adopted by computing the summation in the hidden layer using updated weights. It computes six sets of Yi and six sets of Zi. The total of six sets Zi is called one set of ZTi. The conversion of ZTi using activation function gave ZSi. The multiplication of ZSi and actual value of variables gave the ANN output. Repeat the process of feed forward and back propagation techniques until error is 0. When error is 0, print the original input and the corresponding ANN output. 8 If original independent input data and the corresponding ANN output are same, the research has predicted correctly without any deviations. This happens only when error is 0. 9 If there is difference between the original input data and the corresponding ANN output, there are some deviations. The errors were worked out to understand how far the ANN output was away from the original data. Then update the weights and follow the back propagation technique of computing summations. 3.5 Supervised Learning in ANN Learning in ANN is nothing but updating network architecture and connection weights so that the network can efficiently predict the output. Performance is improved over time by iteratively updating the weights in the network. In supervised learning, the network is provided with a correct answer (output) for every input pattern. Weights are updated to allow the network to produce answers as close as possible to the known correct answers.
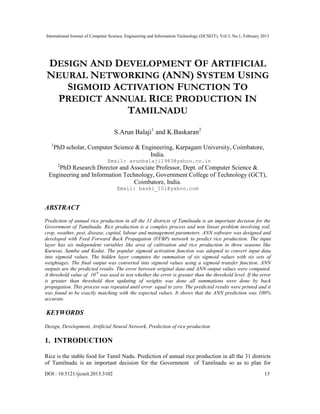
  • 12. International Journal of Computer Science, Engineering and Information Technology (IJCSEIT), Vol.3, No.1, February 2013 24 Compare the error with threshold value of 10-9 . If the error was greater than threshold value then calculate the updated weights using the formula given below: New updated weight = Old weight + Increment of 0.01. After finding the new weights, adopt back propagation technique to compute all summations from the beginnings until error equal to zero. It will predict exact ANN output. 4. RESULTS AND DISCUSSIONS The input sigmoid values sending into the ANN and the output sigmoid values coming out from the output layers are very important aspects to predict the correct answer. Hence, they are discussed below: 4.1 Input Sigmoid values of independent data The preprocessed training data was converted into sigmoid data using the sigmoid activation function and the input sigmoid values for 3 seasonal area and productions are given below: Table 1: Frequency distribution of Sigmoid values of training data containing area of rice cultivation and its production in 2009-10 Table 1 show that the sigmoid value of 1 and 0.5025 were present after transformation of independent data like area and rice production using sigmoid activation function. It was found that there is a range of 1 to 4 for 0.5025 and the majority values are 1s. The total number of 0.5025 is 15 and the remaining 171 items are 1s. 4.2 Effect of initial weights and increments in supervised training The initial weights assumed were within the range of 0 to 1. The weights are updated for 17 times to reach the 18th iteration where the mean error between the original data and the ANN output is 0. Supervised training was carried out by updating the weights in every iteration so as to reduce the initial error in 1st iteration to 0 errors in the final iteration. The mean error between original training data and the ANN output created by the software from 1 to 18 iterations were recorded in a excel file and the graph is drawn by keeping the iteration in x
  • 13. International Journal of Computer Science, Engineering and Information Technology (IJCSEIT), Vol.3, No.1, February 2013 25 axis and the mean error of Kurvai area, Kuruvai production, Samba area, Samba production and the Kodai area and Kodai productions in y axis. The graph is shown in figure 6. Figure 6 shows the fact that the initial error computed for the ANN output from the original input data for all the variable like Kuruvai area and production, Samba area and production and the Kodai area and its production starts at 0.0000548 at the first iteration and the error of all the variables become 0 at 18th iteration. The error reduction pattern seen from the figure 6 follows the same curve linear path. This shows that the non linearity and complexity of input data was reduced and smoothened after the transformation by the sigmoidal activation function multiplied by initial assumed weights and subsequent updated weights. Figure 6: Mean Error between original training data and the ANN output from 1 to 18 iterations The work of Heermann and Khazenie [15] who compared neural networks with more classical statistical methods and found that the error is distributed throughout the network which uses back propagation methods. The conclusion of Heermann and Khazenie [15] is in agreement in the present study because the error is reduced in a smooth curve linear path for all the independent variable from 0.0000548 to 0. 4.3 Effect of output sigmoid value for the training data from 1 to 18 iterations It is found that the program stops its execution at 18th iteration. The output sigmoid value for the training data starts in the order of 0.9999 for all the 31 districts in its first iterations. All districts attain the output sigmoid value of 1 at the last 18th iteration. The output sigmoid values for all the 31 districts for all the 18 iterations were recorded in a excel file and the graph was drawn by keeping the districts in x axis and the output sigmoid value in y axis. The graph is shown in figure 7 below:
  • 14. International Journal of Computer Science, Engineering and Information Technology (IJCSEIT), Vol.3, No.1, February 2013 26 Figure 7: Effect of output sigmoid value for the training data from 1 to 18 iterations Figure 7 shows the fact that for 1st iteration, Karur district show a lower sigmoid value followed by Ramanathapuram and Sivagangai districts. Sivagangai has the lowest sigmoid value in the 1st iteration. As the iterations increased from 1to 18, the sigmoid values of variable moved to 1 because the error was reduced to 0. If the sigmoid value becomes 1, which is the highest value, the graph becomes a straight line. The reason is non linear and complex data are converted into linear which is the specialty of ANN. It is interesting to note the fact that at 13th iteration, all the 25 districts other than districts Karur, Ramanathapuram, Virudhunagar, Sivagangai, Nilgiris and Kanyakumari got the highest output sigmoid value of 1 meaning the error was 0. To make the output sigmoid value of six districts Karur, Ramanathapuram, Virudhunagar, Sivagangai, Nilgiris and Kanyakumari to become 1 and to make the error 0, the iterations were continued further by updating the weights with increment of 0.01. It means conversion of nonlinearity to linearity continued from13th iterations for all the districts. The following observations were noted: Table 2: Number of iterations and the output sigmoid value of 1 with 0 errors S.No Name of Districts No. of iterations Output sigmoid value Error of ANN from actual data 1 All 25 districts excepting Karur, Ramanathapuram, Virudhunagar, Sivagangai, Nilgiris and Kanyakumari districts 12th 1 0 2 Karur district 13th 1 0 3 Ramanathapuram and Virudhunagar, 14th 1 0 4 Kanyakumari district 16th 1 0 5 Sivagangai and Nilgiris 18th 1 0
  • 15. International Journal of Computer Science, Engineering and Information Technology (IJCSEIT), Vol.3, No.1, February 2013 27 (Note: output sigmoid value = 1 means error = 0) The above facts can be well understood by seeing the straight line graph at 18th iterations with the output sigmoid value 1 for all the 31 districts. The discussion can be summed up with the fact that the updated weight causes the summation to yield the maximum sigmoid value of +1. It means the complex and non linearity of the input data is made linear. 4.4 Comparison of preprocessed training and testing data with their corresponding ANN output Table 3 shows that the original set of data is exactly matching with the ANN output. Since there are 0 errors after 18th iterations, the ANN output is same as original input data given into the software developed and trained. It was noted that at 12th iteration, all the 25 districts other than districts of Karur, Ramanathapuram, Virudhunagar, Sivagangai, Nilgiris and Kanyakumari got the ANN output same as original input data. Karur district attained the got the ANN output same as original input data at 13th iteration. Ramanathapuram and Virudhunagar districts attained the ANN output same as original input data at 14th iteration. Kanyakumari district got the ANN output same as original input data at 16th iteration. Finally Sivagangai and Nilgiris districts got the ANN output same as original input data at 18th iteration. Attaining the ANN output same as original input data means the prediction value will be exactly same as desired value. The training of ANN software is perfectly done. The software understood the complexities, non linearity and structure of training data. Table 4 shows that the original set of test data is exactly matching with the ANN output. Since there are 0 errors after 18th iterations during the training phase, the ANN output for test data is same as original input test data given into the software developed. The testing of ANN software is perfectly done. The software understood the complexities and structure of training data and hence it predict very correctly for the testing phase. Similar to the ANN based rainfall prediction in Chennai [5] using back propagation neural network, which performed well both in training and testing periods, the rice prediction model developed in the study performed very well with 100% accuracy. Also, the ANN based rainfall- runoff prediction model [8] worked efficiently to predict the river runoff, the rice prediction model developed in the study performed very well with 100% accuracy. There is 100% accuracy in prediction both in training and testing phase of the software. The software developed in the present research can be used for Tamilnadu Government’s rice prediction studies.
  • 16. International Journal of Computer Science, Engineering and Information Technology (IJCSEIT), Vol.3, No.1, February 2013 28 Table 3: Comparison of preprocessed training data and the ANN output 5. SUMMARY AND CONCLUSIONS Prediction of annual rice production in all the 31 districts of Tamilnadu is an important decision for the Government of Tamilnadu so as to plan for the food security. One of the pillars of success of the Government depends on planning the availability of rice for the state. Hence, design and development of ANN system to predict rice production was successfully carried out. The system uses the popular sigmoid activation function for both converting independent data like area and production of rice and transferring the output sigmoid value back to area and production of rice. The training and testing data were collected from published report of the Government of Tamilnadu [19]. The following conclusions are drawn from the research. 1. The sigmoid value of 1 and 0.5025 were present after transformation of independent data like area and rice production using sigmoid activation function. It was found that there
  • 17. International Journal of Computer Science, Engineering and Information Technology (IJCSEIT), Vol.3, No.1, February 2013 29 were few values of 0.5025 and the majority values were 1s. The total number of 0.5025 was 15 and the remaining 171 items were 1s. 2. The initial error computed for the ANN output from the original input data for the entire variable like Kuruvai area and its production, Samba area and its production and the Kodai area and its production started at 0.0000548 at the first iteration and the error of all the variables became 0 at 18th iteration. The error reduction pattern for the entire six variables followed the same curve linear path. This showed that the non linearity and complexity of input data were reduced and smoothened after the transformation by the sigmoid activation function multiplied by weights and subsequent updated weights. 3. It was noted that at 12th iteration, all the 25 districts other than districts of Karur, Ramanathapuram, Virudhunagar, Sivagangai, Nilgiris and Kanyakumari got the highest output sigmoid value of 1 meaning the error was 0. To make the output sigmoid value of six districts Karur, Ramanathapuram, Virudhunagar, Sivagangai, Nilgiris and Kanyakumari to become with 0 error, the iterations were continued further. Karur district attained the output sigmoid value 1 and error equal to 0 at 13th iteration. Ramanathapuram and Virudhunagar districts attained the output sigmoid value 1 and error equal to 0 at 14th iteration. Kanyakumari district attained the output sigmoid value 1 and error equal to 0 at 16th iteration. Finally Sivagangai and Nilgiris districts attained the sigmoid value of 1 at 18th iteration. Attaining sigmoid value 1 means the prediction value will be exactly same as desired value. 4. ANN architecture and software system were very well designed, developed, trained perfectly with 100% accuracy and tested perfectly with 100% accuracy in predicting the rice production for Tamilnadu. Hence, the research was completed with 100% accuracy in prediction. ACKNOWLEDGEMENTS The PhD scholar first and foremost thank the almighty God for his abundant blessings and protection during my studies and research work. I am highly indebted to Dr. K. Baskaran, my research Director and Associate Professor, Dept. of Computer Science & Engineering and Information Technology, Government College of Technology, Coimbatore for his involvement, encouragement, suggestions and constructive criticism to make the research a grand success. I also thank the members of my research committee Dr. Ebenezer Jeyakumar, Director (Academic), Sri Ramakrishna College of Engineering, Vattamalaipalayam, Coimbatore and Dr. M. Hemalatha, Head of the Department of Software systems, Karpagam University Coimbatore for their suggestions and guidance to make my work more applied to the society. REFERENCES [1] John W. Santrock, University of Texas, Dallas, 2005, Psychology, 7th Edition, ISBN: 0072937769 published by McGraw-Hill, Chapter 3, Biological foundations of behaviors, pp 76-115. [2] Thenmozhi,M. 2006, Forecasting stock index returns using Neural Networks published in Delhi Business Review X Vol. 7, No. 2, July - December 2006.
  • 18. International Journal of Computer Science, Engineering and Information Technology (IJCSEIT), Vol.3, No.1, February 2013 30 [3] Zabir Haider Khan, Tasnim Sharmin Alin and Md. Akter Hussain (2011) Price Prediction of Share Market using Artificial Neural Network (ANN) published in International Journal of Computer Applications (0975 – 8887) Volume 22– No.2, May 2011. [4] Kavitha M.Mayilvaganan,.Naidu K.B, 2011, “ANN and Fuzzy Logic Models for the Prediction of groundwater level of a watershed”, International Journal on Computer Science and Engineering, Vol. 3 No. 6, pp. 2523-2530. [5] Geetha G.,. Selvaraj R Samuel, 2011, “Prediction of monthly rainfall in Chennai using back propagation neural network model”, International Journal of Engineering Science and Technology, Vol. 3 No. 1, pp. 211-213. [6] El-Shafie A, Noureldin A., Taha M. R., and Hussain A., 2011, “Dynamic versus static neural network model for rainfall forecasting at Klang River Basin, Malaysia”, Hydrol. Earth Syst. Sci., vol. 8, pp. 6489–6532. [7] Vamsidhar Enireddy Varma K.V.S.R.P..Sankara Rao P satapati Ravikanth, 2010, “Prediction of Rainfall Using Backpropagation Neural Network Model”, International Journal on Computer Science and Engineering, Vol. 02, No. 04, pp. 1119-1121. [8] Solaimani Karim, 2009, “Rainfall-runoff Prediction Based on Artificial Neural Network (A Case Study: Jarahi Watershed)”, American-Eurasian J. Agric. & Environ. Sci., vol. 5(6), pp. 856-865. [9] Karmakar Sanjeev et al., 2008, “Development of Artificial Neural Network Models for Long-Range Meteorological Parameters Pattern Recognition over the Smaller Scale Geographical Region”, IEEE Computer Society, Washington, DC, USA., 8-10 Dec. 2008, pp.1 – 6. [10] Hayati Mohsen, and Mohebi Zahra, 2007, “Application of Artificial Neural Networks for Temperature Forecasting”, World Academy of Science, Engineering and Technology, vol 28, pp. 275-279. [11] Chattopadhyay Surajit and Chattopadhyay Goutami, 2008, “Identification of the best hidden layer size for three layered neural net in predicting monsoon rainfall in India”, Journal of Hydroinformatics, vol. 10(2), pp. 181-188. [12] Ani1 K. Jain, Jianchang Mao and Mohiuddin, K.M. (1996 ), Artificial Neural Networks: A tutorial, Michigan State University, published as per 0018-9162/96/$5.000, March 1996, IEEE pp 31 44. [13] White, H. (1989), Learning in Neural Networks: A statistical perspective, Published in Neural Computat, 4 (1989) 425 -464. [14] Bendiktsson, J.A., Swain, P.H. and Ersoy, O.K. Neural network approaches versus statistical methods on classification of multisource remote sensing data, IEEE Trans. Geosci. Remote Sensing, 28, pp. 540-552 (July 1990). [15] Heermann, P. and Khazenie, N. Classification of multispectral remote sensing data using a backpropagation neural network, IEEE Trans. on Geoscience and Remote Sensing, 30, pp. 81-88 (1992). [16] Hepner, G., Logon, T., Rittner, N. and Bryant, N. Artificial neural network classification using a minimum training set, Photogrammetry Engineering and Remote Sensing, 56(4), pp. 469-471 (1990). [17] Amini,J. Optimum Learning Rate in Back-Propagation Neural Network for Classification of Satellite Images (IRS-1D) published by Sharif University of Technology, December 2008 in Scientia Iranica, Vol. 15, No. 6, pp. 558-567. [18] McCelland, J.L. and Rumelhar, D.E., Parallel Distributed Processing, 1, MIT Press, Cambridge, MA, USA (1986). [19] Govt. of Tamil Nadu. Department of Economics and Statistics, Chennai ‐ 600 006 published, Report Number R.No. 6 / 2011, Season and Crop Report, 2005-06 to 2009-10 (Fasli 1419).
  • 19. International Journal of Computer Science, Engineering and Information Technology (IJCSEIT), Vol.3, No.1, February 2013 31 AUTHORS: SHORT BIOGRAPHY 1) Mr. S.Arun Balaji B.E and M.Tech (Information Technology) PhD Scholar Computer Science & Engineering, Karpagam University Coimbatore, India. Teaching Experience: Total 4 years (2 years in India, 2 years abroad) Email: arunbalaji1983@yahoo.co.in 2) Dr. K. Baskaran PhD; Associate Professor (CSE & IT) Government College of Technology, Coimbatore– 641013, India B.E, M.E and PhD: Computer Science & Engineering Email: baski_101@yahoo.com Mobile: +91-9443661901