
Recommended
More Related Content
Viewers also liked
Viewers also liked (16)
Similar to Fourier and Periodogram Transform Temperature Analysis in Soil
Similar to Fourier and Periodogram Transform Temperature Analysis in Soil (20)
Recently uploaded
Recently uploaded (20)
Fourier and Periodogram Transform Temperature Analysis in Soil
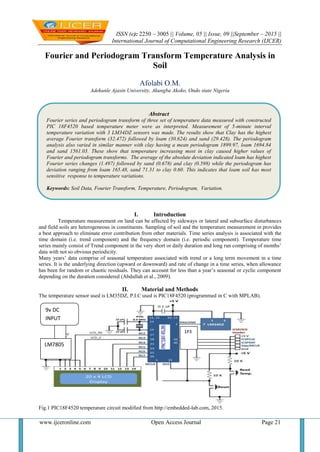
- 1. ISSN (e): 2250 – 3005 || Volume, 05 || Issue, 09 ||September – 2015 || International Journal of Computational Engineering Research (IJCER) www.ijceronline.com Open Access Journal Page 21 Fourier and Periodogram Transform Temperature Analysis in Soil Afolabi O.M. Adekunle Ajasin University, Akungba Akoko, Ondo state Nigeria I. Introduction Temperature measurement on land can be affected by sideways or lateral and subsurface disturbances and field soils are heterogeneous in constituents. Sampling of soil and the temperature measurement in provides a best approach to eliminate error contribution from other materials. Time series analysis is associated with the time domain (i.e. trend component) and the frequency domain (i.e. periodic component). Temperature time series mainly consist of Trend component in the very short or daily duration and long run comprising of months’ data with not so obvious periodicity. Many years’ data comprise of seasonal temperature associated with trend or a long term movement in a time series. It is the underlying direction (upward or downward) and rate of change in a time series, when allowance has been for random or chaotic residuals. They can account for less than a year’s seasonal or cyclic component depending on the duration considered (Abdullah et al., 2009). II. Material and Methods The temperature sensor used is LM35DZ, P.I.C used is PIC18F4520 (programmed in C with MPLAB). Fig.1 PIC18F4520 temperature circuit modified from http://embedded-lab.com, 2015. LM7805 9v DC INPUT 1P3 Abstract Fourier series and periodogram transform of three set of temperature data measured with constructed PIC 18F4520 based temperature meter were as interpreted. Measurement of 5-minute interval temperature variation with 3 LM34DZ sensors was made. The results show that Clay has the highest average Fourier transform (32.472) followed by loam (30.624) and sand (29.428). The periodogram analysis also varied in similar manner with clay having a mean periodogram 1899.97, loam 1694.84 and sand 1561.03. These show that temperature increasing most in clay caused higher values of Fourier and periodogram transforms. The average of the absolute deviation indicated loam has highest Fourier series changes (1.497) followed by sand (0.678) and clay (0.598) while the periodogram has deviation ranging from loam 165.48, sand 71.31 to clay 0.60. This indicates that loam soil has most sensitive response to temperature variations. Keywords: Soil Data, Fourier Transform, Temperature, Periodogram, Variation.
- 2. Fourier and Periodogram Transform Temperature… www.ijceronline.com Open Access Journal Page 22 The display is on 20x4 LCD. The whole constructed circuit was enclosed in a PVC case and the LCD was underneath a transparent Perspex cover. 2000 ml each of the 3 soils were mixed with 500ml water and the solution were put in a wooden box underlain inside with cellophane paper, each of all the three LM34DZ ICs 3 pins were insulated with thick masking tape away from the soil solution to avoid short circuit of the IC before the LM34DZ temperature sensors were immersed 1 cm into the soils. Temperature readings in centigrade were taken from the constructed temperature meter every 5 minutes from all the soils after switching with 1-pole 3- throw (1P3) switch (see Fig. 1) to the 3 LM34DZ sensors. . III. Result and Discussion The temperature data recorded from each soil are in Table 1. Soil temperature data recorded in 7th March, 2015 were checked and the data were consistent and continuous, Tushar and Keith, 2008 Table 1: Time temperature data for Sand, Loam and Clay Soils Time Sand Temperature (o C) Loam Temperature (o C) Clay Temperature (o C)Time (MIN) 11:55 5 27 26.9 31 12 10 27.8 27.9 31.7 12:05 15 28.7 28.1 31.9 12:10 20 28.8 28.9 32.9 12:15 25 28.8 29.9 33 12:20 30 29.9 29.7 33.9 12:25 35 29.8 29.8 32.9 12:30 40 29.9 30.9 32.9 12:35 45 30.1 29.7 32.9 12:40 50 29.9 28.8 33 12:45 55 29.1 30.1 33 12:50 60 30.9 29.7 32.8 12:55 65 30.8 30.9 32.8 13:00 70 29.9 29.9 32.7 13:05 75 29.8 30 32.8 13:10 80 29.8 30.8 32.8 13:15 85 29.9 31.7 32.8 13:20 90 29.8 32 32.7 13:25 95 29.7 32.9 32.8 13:30 100 29.9 32 32.1 13:35 105 29.8 31.8 32.8 13:40 110 28.9 32.8 31.9 13:45 115 28.8 32.9 30.9 13:50 120 28.8 33.9 30.9 13:55 125 29.1 33.6 31.9
- 3. Fourier and Periodogram Transform Temperature… www.ijceronline.com Open Access Journal Page 23 Fig.1 Temperature time series curves for sand, loam and clay The temperature data showed Clay reached its maximum temperature of 33.9 0 C faster than the other two soils at 12.20 pm followed by sand at 12.50 pm a maximum temperature of 30.9 0 C. Loam took longest time to reach its initial maximum temperature of 33.90 C at 13.50pm. The average temperatures recorded from the experiment are 29.428 sand, 30.624 loam and 32.472 clay. The correlation of the 3 separate data shows that clay and sand vary similarly with Pearson correlation coefficient 0.66 in response to similar atmospheric condition while loam and clay do not correlate (-0.19). Sand and loam have low correlation of 0.28. The average of the absolute deviation from each of their mean shows that loam has highest temperature deviation with average absolute deviation 1.50 followed by sand 0.68 and clay 0.60. This means that the temperature of loam soil vary the most out of three soils considered. Fourier Transform Fourier transform (FT) is a mathematical function that can be used for mapping a time series from the time domain into the frequency domain. It decomposes a waveform or a function into sinusoids of different frequencies which sum to the original waveform. It distinguishes different frequency sinusoids and their respective amplitudes. Fourier transform is expressed as x(t)→ X(f) according to 𝑋 𝑓 = 1 𝑛 𝑥(𝑡) 𝑡(𝑛) 𝑡(0) 𝑒−𝑖2𝜋𝑓𝑡 𝑑𝑡…………………………………………………………………………………………… ………….1. for continuous function. The exponential involving 2𝜋𝑓𝑡 is θ in radian, simplified in form as 𝑒iθ = cosθ+isinθ………………………………………………………………………………………………………… …………………….….2. A graph of the distribution of the Fourier coefficients in the complex plane is difficult to interpret (Abdullah et al., 2009). By using the real component of the sinusoid, and using the discrete form of equation 1 for a discrete process measured at equal intervals of time length, ∆t, the discrete Fourier transform (DFT) is the outcome that is implemented as 1 𝑛 𝑥(𝑡)𝑐𝑜𝑠𝑤∆t 𝑡(𝑛) 𝑡(𝑛=0) …………………………………………………………………………………………… ……………………….3 20 22 24 26 28 30 32 34 36 0 20 40 60 80 100 120 140 Sand Loam Clay Time (minute) Temperature 0C
- 4. Fourier and Periodogram Transform Temperature… www.ijceronline.com Open Access Journal Page 24 For the soil temperature data with a finite sequence [xn] of sample from a series x(t), the discrete Fourier transform is defined by X(f) = 1 𝑛 𝑥 𝑡 𝑐𝑜𝑠2𝜋∆t 𝑘 𝑛 𝑛=5 𝑘=1 ……………………………………………………………………………………………………………4 Where k is kth frequency sampled. Periodogram The complex magnitude squared of X(f) is called the power or periodogram . This strength of the periodic component is more often represented by the periodogram defined as P(f)= 1 𝑛 𝑥 𝑡 (𝑐𝑜𝑠𝑤∆t 𝑡(𝑛) 𝑡(𝑛=1) − 𝑖𝑠𝑖𝑛𝑤∆t)2 ………………………………………………………………………………….5 𝑃 𝑓 = 1 𝑛 {𝑥 𝑡 }2 {(𝑐𝑜𝑠𝑤∆t 𝑡(5) 𝑡(𝑛=1) )2 + (𝑠𝑖𝑛𝑤∆t)2 }……………………………………………………………….6 The real part of equation 6 can be implemented in Microsoft EXCEL as ((H3/SQRT(5))*COS(6.284*5)*(1/5+2/5+3/5+4/5+5/5)+SIN(6.284*5*(1/5+2/5+3/5+4/5+5/5)))^2with the procedure of equation 5. Equations 5 and 6 are calculated and shown in tables 2 to 4 following. Table 2. Fourier transform of Sand, Loam and Clay’s temperature Time (MIN) x(FS) x(FL) x(FC) 5 36.22407 36.0898 41.59052 10 37.2973 37.4315 42.52966 15 38.50477 37.6998 42.79799 20 38.63893 38.7731 44.13962 25 38.63893 40.1147 44.27378 30 40.11473 39.8464 45.48125 35 39.98056 39.9806 44.13962 40 40.11473 41.4564 44.13962 45 40.38305 39.8464 44.13962 50 40.11473 38.6389 44.27378 55 39.04142 40.3831 44.27378 60 41.45636 39.8464 44.00545 65 41.32219 41.4564 44.00545 70 40.11473 40.1147 43.87129 75 39.98056 40.2489 44.00545 80 39.98056 41.3222 44.00545 85 40.11473 42.5297 44.00545 90 39.98056 42.9321 43.87129 95 39.8464 44.1396 44.00545 100 40.11473 42.9321 43.06631 105 39.98056 42.6638 44.00545 110 38.7731 44.0055 42.79799 115 38.63893 44.1396 41.45636 120 38.63893 45.4812 41.45636 125 39.04142 45.0788 42.79799
- 5. Fourier and Periodogram Transform Temperature… www.ijceronline.com Open Access Journal Page 25 Table 3. Periodogram of Sand, Loam and Clay’s temperature Time (MIN) p(FS) p(FL) p(FC) 5 1313.064 1303.359 1730.788 10 1392.001 1402.03 1809.812 15 1483.559 1422.196 1832.714 20 1493.912 1504.301 1949.385 25 1493.912 1610.172 1961.25 30 1610.172 1588.71 2069.655 35 1599.423 1599.423 1949.385 40 1610.172 1719.643 1949.385 45 1631.778 1588.71 1949.385 50 1610.172 1493.912 1961.25 55 1525.187 1631.778 1961.25 60 1719.643 1588.71 1937.556 65 1708.534 1719.643 1937.556 70 1610.172 1610.172 1925.762 75 1599.423 1620.957 1937.556 80 1599.423 1708.534 1937.556 85 1610.172 1809.812 1937.556 90 1599.423 1844.219 1925.762 95 1588.71 1949.385 1937.556 100 1610.172 1844.219 1855.76 105 1599.423 1821.245 1937.556 110 1504.301 1937.556 1832.714 115 1493.912 1949.385 1719.643 120 1493.912 2069.655 1719.643 125 1525.187 2033.196 1832.714 The Fourier transform and Periodogram data from tables 2 and 3 are generally higher than the raw temperature data. They all show similar trends as the data they originated from. The Fourier transform correlation of sand and loam is low 0.279863 while that between loam and clay is the lowest -0.18981. The highest correlations of Fourier transform exist between clay and sand 0.6555599 while periodogram correlations are respectively similar but slightly lower (0.243921, -0.21756 and 0.650798). The transforms indicate that clay and sand temperature have similar response to external heat interaction while loam and clay do not have any similar response to heat as the negative correlation is too low for interpreting opposite response. This is conversely similar to the response between sand and loam with too low positive Fourier and Periodogram transforms. Fig.2 Fourier transform time series curves for sand, loam and clay
- 6. Fourier and Periodogram Transform Temperature… www.ijceronline.com Open Access Journal Page 26 Fig.3. Periodogram time series curve for sand, loam and clay The frequency curves of sand Periodogram data show clear changes due to temperature variation and the highest periodogram data occur in loam from 120th and 125th minutes corresponding to a time from 13.50 to 13.55 pm. Clay show early increase in Periodogram and frequency in the 30th minute or 12.20 pm. The periodogram and Fourier transform are useful to check interpretation error in the principal data and here they corroborate the earlier interpretation of soil, clay and sand temperature data and all the resulting curves. IV. Conclusion The 1 pole three throw switch temperature meter permitted the measurement of temperature in the samples of sand, loam and clay soils. Clay has the highest average temperature (32.472) followed by loam (30.624) and sand (29.428). The correlation of the 3 temperature data shows that clay and sand vary similarly with Pearson correlation coefficient 0.66 in response to similar atmospheric condition while loam and clay do not correlate (- 0.19). Sand and loam have poor correlation of 0.28. The average of the absolute deviation indicated loam has highest temperature changes followed by sand and clay. This result is further confirmed by the Fourier transform and periodogram data that proved useful for investigating the interpretations from original data. References [1] Abdullah, S., C.K.E. Nizwan and M.Z. Nuawi, 2009. A study of fatigue data editing using the Short Time [2] Fourier Transform (STFT). Am. J. Applied Sci., 6: 565-575. http://www.scipub.org/fulltext/ajas/ [3] ajas64565575.pdf. [4] Lough, J.M., 1995. Temperature variations in a tropical-subtropical environment: Queensland, [5] Australia, 1910-1987. Int. J. Climatol., 15: 77-95. DOI: 10.1002/joc.3370150109 [6] Tushar S. and Keith A.C. 2008 Time Series Analysis of Soil Freeze and Thaw Processes in Indiana [7] Journal of Hydrometeorology Vol. 9 [8] Frauenberger C. and Gerhard Eckel A. “ANALYSING TIME SERIES DATA” Proceedings of the 13th [9] International Conference on Auditory Display,Montr´eal, Canada, June26-29,2007