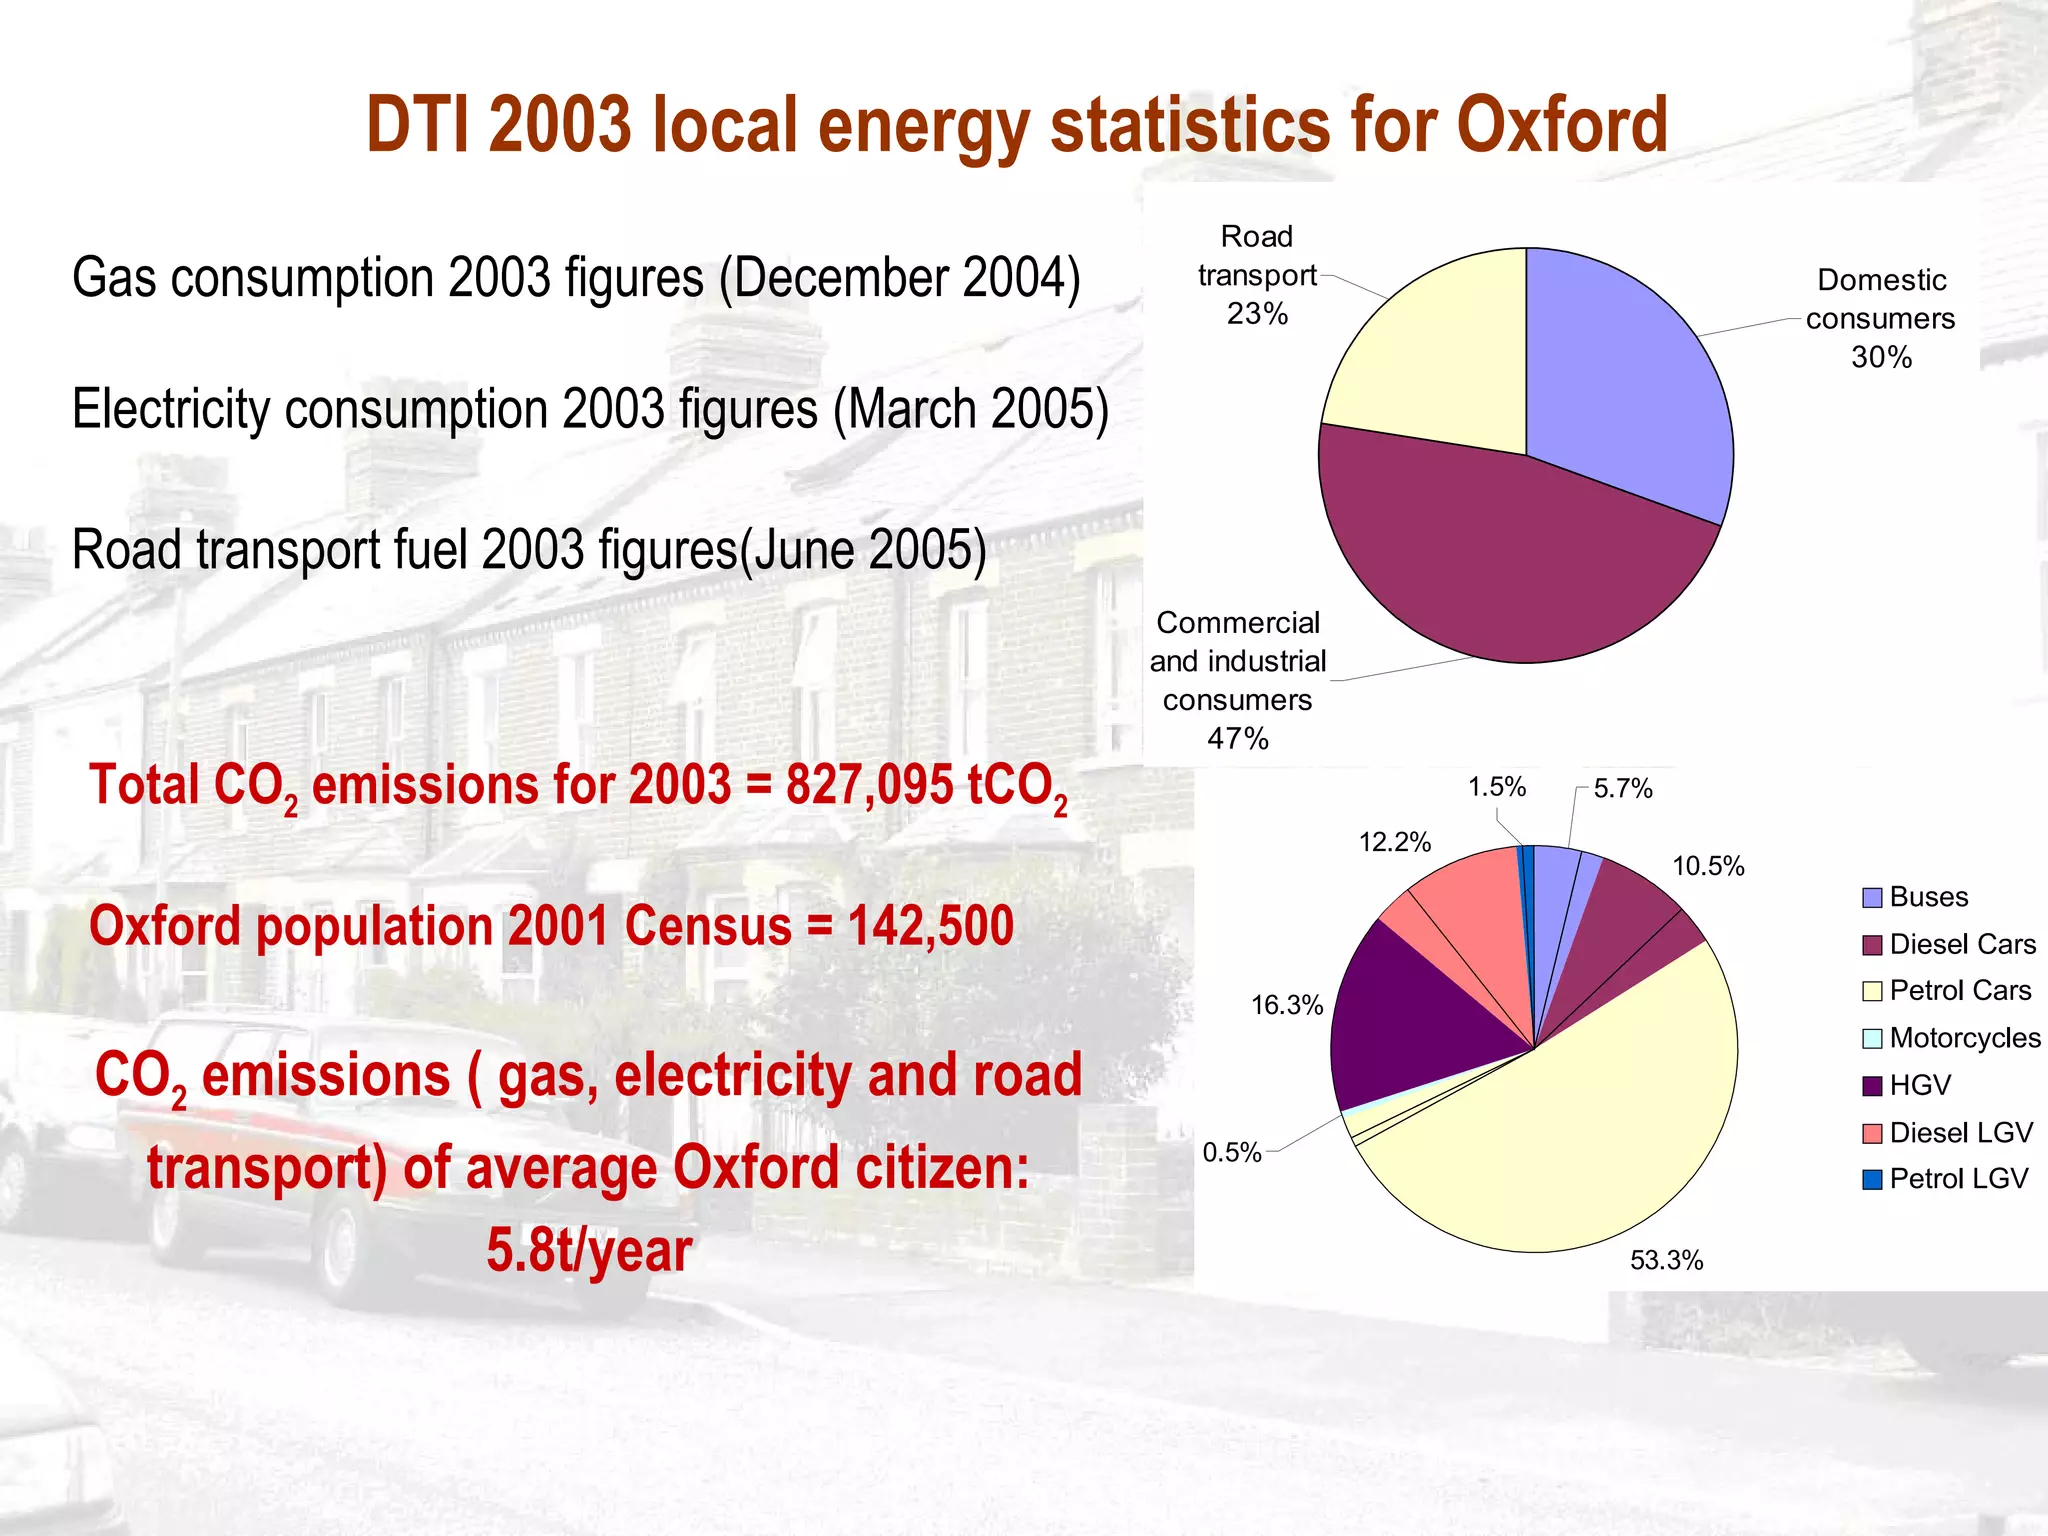
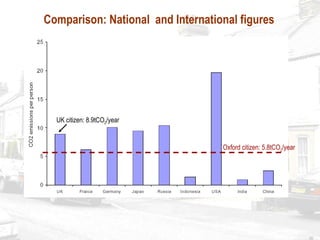
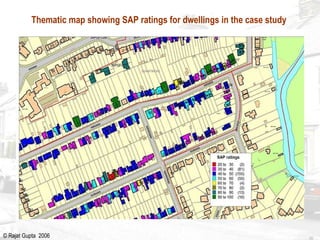
DTI 2003 local energy statistics for Oxford Total CO 2  emissions for 2003 = 827,095 tCO 2 Gas consumption 2003 figures (December 2004) Electricity consumption 2003 figures (March 2005) Road transport fuel 2003 figures(June 2005) Oxford population 2001 Census = 142,500 CO 2  emissions ( gas, electricity and road transport) of average Oxford citizen: 5.8t/year
Comparison: National  and International figures Oxford citizen: 5.8tCO 2 /year UK citizen: 8.9tCO 2 /year
Comparison with national figures: DTI figures (domestic sector)  Annual  gas and electricity consumption: Oxford typical and UK typical dwelling
Oxford case study: DECoRuM baseline energy & CO 2  model © Rajat Gupta  2006
Thematic map showing SAP ratings for dwellings in the case study  © Rajat Gupta  2006
DECoRuM CO 2  reduction model: estimating solar potential 87% of the dwellings in the case study were suitable for installing either a SHW or a PV system or both.   © Rajat Gupta  2006


Oxford Decorum | Rajat Gupta

  • 1.
    DTI 2003 localenergy statistics for Oxford Total CO 2 emissions for 2003 = 827,095 tCO 2 Gas consumption 2003 figures (December 2004) Electricity consumption 2003 figures (March 2005) Road transport fuel 2003 figures(June 2005) Oxford population 2001 Census = 142,500 CO 2 emissions ( gas, electricity and road transport) of average Oxford citizen: 5.8t/year
  • 2.
    Comparison: National and International figures Oxford citizen: 5.8tCO 2 /year UK citizen: 8.9tCO 2 /year
  • 3.
    Comparison with nationalfigures: DTI figures (domestic sector) Annual gas and electricity consumption: Oxford typical and UK typical dwelling
  • 4.
    Oxford case study:DECoRuM baseline energy & CO 2 model © Rajat Gupta 2006
  • 5.
    Thematic map showingSAP ratings for dwellings in the case study © Rajat Gupta 2006
  • 6.
    DECoRuM CO 2 reduction model: estimating solar potential 87% of the dwellings in the case study were suitable for installing either a SHW or a PV system or both. © Rajat Gupta 2006
  • 7.
  • 8.

Editor's Notes

  • #7 The table shows using filtering criteria the number and percentage of dwellings selected with the potential to install an energy efficiency measure, a low carbon technology or a solar energy system, or switch to green tariff electricity.