Applied Psych Test Design: Part C - Use of Rasch scaling technology
•Download as PPT, PDF•
1 like•1,688 views

The Art and Science of Applied Test Development. This is the third in a series of PPT modules explicating the development of psychological tests in the domain of cognitive ability using contemporary methods (e.g., theory-driven test specification; IRT-Rasch scaling; etc.). The presentations are intended to be conceptual and not statistical in nature. Feedback is appreciated.

Recommended
Recommended
More Related Content
What's hot
What's hot (18)
Viewers also liked
Similar to Applied Psych Test Design: Part C - Use of Rasch scaling technology
Similar to Applied Psych Test Design: Part C - Use of Rasch scaling technology (20)
More from Kevin McGrew
More from Kevin McGrew (20)
Recently uploaded
Recently uploaded (20)
Applied Psych Test Design: Part C - Use of Rasch scaling technology
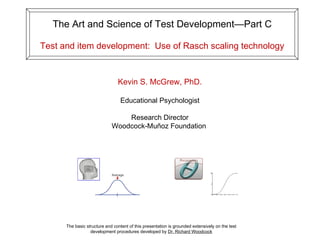
- 1. The Art and Science of Test Development—Part C Test and item development: Use of Rasch scaling technology The basic structure and content of this presentation is grounded extensively on the test development procedures developed by Dr. Richard Woodcock Kevin S. McGrew, PhD. Educational Psychologist Research Director Woodcock-Muñoz Foundation
- 2. Important note: For the on-line public versions of this PPT module certain items, information, etc. is obscured for test security or proprietary reasons …sorry
- 3. Use Rasch (IRT) scaling to evaluate the complete pool of items and to develop the Norming and Publication tests
- 5. Theoretical Domain = Cattell-Horn-Carroll (CHC) theory of cognitive abilities – Gv domain & 3 selected narrow Gv abilities Gv Item Scale Development via Rasch technology Measurement or empirical domain Rasch scale and evaluate the complete pool of items to develop Norming and Publication tests Low ability/easy items High ability/difficult items
- 7. Important understanding regarding 0/1 and multiple point (0/1/2) scoring systems when using Rasch/IRT 0 1 1 “step” 1 2 0 1 “step” 1 “step” Therefore – think of 2-step items as two 0/1 items Dichotomous ( 0/1) item scoring Multiple point (0/1/2) item scoring
- 8. Think of the items as now having been placed in their proper position on an equal interval ruler or yardstick ….each item is a “tick” mark along the latent trait scale Rasch IRT “norms” (calibrates) the scale !
- 10. A major advantage/feature of a large IRT-scaled item pool …….. Norming test Publication test Possible special Research Edition tests All three tests have items on the same scale (W-scale) Although different number of items in each test, the obtained person ability W-score ‘s are equivalent, but differ in degree of precision (reliability) Average difference in “gaps” between items on respective scales is called “ item density” W-scale is equal interval metric Easy Hard
- 11. Items are assigned W-difficulties People are assigned W-ability scores 2 Major Rasch results Rasch puts person ability and item difficulty on the same scale ( W scale )
- 12. Select and order items for Publication test based on inspection of Rasch results Block Rotation Norming test (n=44 items; n = 4,722 norm subjects) Block Rotation Publication test (n = 37 items; n = 4,722 norm subjects) Person W-ability scores 2 Major Rasch results Item W-difficulties
- 13. Block Rotation: Final Rasch with norming test n = 37 norming items n = 4722 norm subjects Measure order and fit statistics table Used to select items with specified item density
- 14. Block Rotation: Final Rasch with norming test n = 37 norming items n = 4722 norm subjects Distribution of Block Rotation W-ability scores in norm sample Complete range ( including extremes ) of Block Rotation W-scores is 432-546 Majority of Block Rotation norm sample obtained W-scores from 480-520
- 15. Recall Block Rotation scoring system is 0/1/2 —Items have “steps” 1 2 0 1 “step” 1 “step” Multiple point (0/1/2) item scoring
- 16. Block Rotation: Final Rasch with norming test n = 37 norming items n = 4722 norm subjects Item map with “steps” displayed for items Blue area represents majority of norm sample subjects Block Rotation W-scores 1 “step” 1 “step” Item 1 (0/1/2) step structure
- 17. Block Rotation: Final Rasch with norming test n = 37 norming items n = 4722 norm subjects Item map with “steps” displayed for items Blue area represents majority of norm sample subjects Block Rotation W-scores Very good test scale coverage for majority of population Excellent “bottom” or “floor” for test scale Adequate “top” or “ceiling” for test scale
- 18. Block Rotation: Final Rasch with norming test n = 37 norming items n = 4722 norm subjects Item map with “steps” displayed for items Red area represents the complete range (including extremes ) of sample Block Rotation W-scores Good test scale coverage for complete range of population
- 19. Block Rotation Rasch floor/ceiling results confirmed by formal +-3SD floor/ceiling analysis (24-300 months of age)
- 20. Block Rotation Rasch floor/ceiling results confirmed by formal +-3SD floor/ceiling analysis (300 - 1200 months of age)
- 21. Block Rotation Norming test (n=44 items; n = 4,722 norm subjects) Block Rotation Publication test (n = 37 items; n = 4,722 norm subjects) Program generates final RS to W-ability scoring table Person W-ability scores 2 Major Rasch results Item W-difficulties
- 22. Block Rotation: Final Rasch with norming test n = 37 norming items n = 4722 norm subjects Raw score to W-score “scoring table” Note: Total raw score points is 74 for 37 items. These are 2-step items. 37 items x 2 steps = 74 total possible points
- 23. Block Rotation Norming Test n=44 items 44 items x 2 steps = raw scores from 0 to 88 on the Rasch-based scoring table (the equal interval Visualization-Vz measurement “ruler” or “yardstick”) Raw Score W-score Block Rotation Norming test (n=44 items) 88 87 . . . . . . . . . . . . . . . . . . . . 1 0 545.7 539.0 . . . . . . . . . . . . . . . . . . . . 437.8 431.6
- 24. Raw Score W-score Block Rotation Norming test (n=44 items) Block Rotation Publication test n = 37 items) Raw Score W-score Block Rotation Norming and Publication tests , although having different number of items (and total Raw Scores), are on the same underlying measurement scale (ruler) 88 87 . . . . . . . . . . . . . . . . . . . . 1 0 545.7 539.0 . . . . . . . . . . . . . . . . . . . . 437.8 431.6 545.7 539.0 . . . . . . . . . . . . . . . 437.8 431.6 74 73 . . . . . . . . . . . . . . . 1 0
- 25. Program generates final RS to W-ability scoring table Result: All norm subjects with Block Rotation scores (n = 4,722) now have scores on equal interval W-score Block Rotation Norming test (n=44 items; n = 4,722 norm subjects) Block Rotation Publication test (n = 37 items) Person W-ability scores 2 Major Rasch results Item W-difficulties
- 26. Block Rotation Norming test (n=44 items; n = 4,722 norm subjects) Block Rotation Publication test (n = 37 items) Program generates final RS to W-ability scoring table Result: All norm subjects with Block Rotation scores (n = 4,722) now have scores on equal interval W-score These Block Rotation W-scores are then used for developing test “norms” and completing technical manual analysis and validity research Person W-ability scores 2 Major Rasch results Item W-difficulties
- 27. Graphic display of distribution of Block Rotation person abilities These Block Rotation W-scores are then used for developing test “norms” and validity research Block Rotation Summary: Final Rasch for Publication test – graphic item map n = 37 norming items (0-74 RS points) n = 4,722 norm subjects 546 432 Pub. Test W-score scale
- 28. Recall early warning to expect the unexpected and the non-linear “art and science” of test development Last minute question raised (prior to formal production) of Block Rotation test: Should the blocks be shaded/colored instead of being black and white? Would adding shading/color change the nature of the task ? What to do ? Answer: Do a study —gather some empirical data to help make decision. The question should be answered empirically – you should not assume that colorizing items will make no difference
- 29. Special Block Rotation no-color vs color group administration study completed
- 31. Two sample items Final Block Rotation Publication Test Constructed n = 37 (0/1/2) items—Raw Scores from 0-74
- 32. Maintaining a master item pool Norming-calibration tests Linking/equating (alternate forms) tests Adding new items to master item pool (use of anchor items from master item pool) Checking for possible item bias (DIF – differential item function) Creating and using shortened “norming ” or “research edition” tests Creating special forms of tests for special populations Flagging potentially poor examiners via empirical “person fit” statistics report Computer adaptive testing ( CAT )
- 33. End of Part C Additional steps in test development process will be presented in subsequent modules as they are developed
Editor's Notes
- d