The document describes several MRI findings that can help diagnose acute stroke at different stages:
1) Diffusion weighted imaging is the most sensitive sequence and can reveal areas of restricted diffusion immediately after a stroke. Intravascular enhancement is another early sign.
2) Within 12 hours, edema can cause sulcal effacement and gyral thickening. Between 1-7 days, enhancement, mass effect and hemorrhage may occur.
3) In subacute stages (1-8 weeks), infarcts appear as focal encephalomalacia and ventricle dilation. Residual blood products may be present. In old infarcts, enhancement decreases over 8 weeks while signal intensity and mass effect resolve.
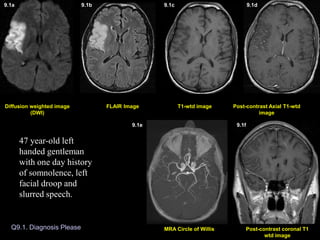
1. Q9.1. Diagnosis Please
Post-contrast Axial T1-wtd
image
T1-wtd image
FLAIR Image
Post-contrast coronal T1
wtd image
MRA Circle of Willis
Diffusion weighted image
(DWI)
Diffusion weighted image (DWI)
9.1a 9.1b 9.1c 9.1d
9.1e 9.1f
47 year-old left
handed gentleman
with one day history
of somnolence, left
facial droop and
slurred speech.
2. Q9.2. Diagnosis Please
Post-contrast Axial T1-wtd
image
T1-wtd image
FLAIR Image
(DWI) image
51 year-old patient multiple myeloma presented with acute onset of right side weakness leading to MRI of the brain 3 days later.
51 year-old patient multiple myeloma presented with acute onset of right side weakness leading to MRI of the brain 3 days later.
51 year-old patient with multiple myeloma presented
with acute onset of right sided weakness leading to MRI
of the brain 3 days later.
9.2a 9.2b 9.2c 9.2d
3. Q9.3. Diagnosis Please
Post-contrast Axial T1-wtd
image
T1-wtd image
FLAIR Image
Post-contrast coronal T1
wtd image
MR Angiography Neck
Diffusion weighted image
(DWI)
72 year-old left handed white man
with history of chest pain, 5 days
prior to MRI, which subsided.
Patient went to a gas station and
could not read the credit card and
signs in the gas station and was
unable to read the magazines in
the doctor’s office. Neurological
examination revealed alexia
without agraphia.
9.3a 9.3b 9.3c 9.3d
9.3e 9.3f
4. 9.4a. Non-contrast CT Brain 9.4b. Non-contrast CT Brain
Q9.4. Diagnosis Please
9.4c. Non-contrast CT Brain
June 29, 2004 July 30, 2004
Patient is status post recent right temporal craniectomy for extensive
right middle fossa skull-based meningioma, with follow-up post-
operative CT images.
9.4a 9.4b 9.4c
5. Q9.5. Diagnosis Please
58 year-old male with history of renal cell carcinoma
presented with 3 weeks history of dressing apraxia consisting
of difficulty in performing routine tasks such as getting
dressed, tying his shoes, difficulty with recall and inferior
quadrantopsia with no focal motor deficits. Symptoms slowly
improved. Differential diagnosis: Stroke versus metastasis.
Post-contrast Axial T1-wtd
image
T1-wtd image
FLAIR Image
Post-contrast sagittal T1
wtd image
Diffusion weighted image
(DWI)
9.5a 9.5b 9.5c 9.5d
9.5e
6. Q9.6. Diagnosis Please
July 31, 2003
T1-wtd image
DW Image FLAIR Image Post-contrast Axial T1-wtd
image
9.6a 9.6b 9.6c 9.6d
December 31, 2003
DW Image FLAIR Image T1-wtd image Post-contrast Axial T1-wtd
image
9.6e 9.6f 9.6g 9.6h
73 year-old male with stage IV non-small cell carcinoma presented with 2 weeks history of
sudden onset of speech difficulty with difficulty in word finding, symptoms gradually
improved. Clinical diagnosis: Stroke versus metastasis.
7. Diffusion weighted image (DWI)
9.1a 9.1b 9.1c 9.1d 9.1e 9.1f
Diagnosis: Acute one day old infarction involving the right middle
cerebral artery (MCA) territory.
Acute infarction is seen as an area of increased signal intensity on
DWI (arrow in A), FLAIR image (arrow in B), with no evidence of
hemorrhage on T1-wtd image (C) and no enhancement on post
contrast images (D). Intravascular enhancement also an indication
of acute stroke is shown on coronal T1 weighted image (arrow in F).
MR angiography of circle of Willis demonstrates small caliber of
right Sylvian branches of MCA (arrows in E) when compared to the
normal side.
8. Post-contrast Axial T1-wtd
image
T1-wtd image
FLAIR Image
DWI
9.2a 9.2b 9.2c 9.2d
Diagnosis: Small acute 3 day old infarction involving the left
insular cortex, the territory of left MCA, best noted on diffusion
weighted image (arrow in A) and with enhancement (arrow in D).
9. 9.3a 9.3b 9.3c 9.3d 9.3e 9.3f
Diagnosis: Acute infarction (5 day old) involving the left posterior
cerebral artery (PCA) territory.
The area of infarction is seen as an area of increased signal intensity
on DWI (arrow in A) and FLAIR image (arrow in B) involving the
left posterior temporal-occipital lobe. Mild enhancement seen on
post contrast images (arrow in D and F). Figure E represents
screening 2D time of flight MR angiogram of the neck vessels
revealing no obvious occlusion of major vessels in the neck.
Diagnosis: Acute infarction (5 day old) involving the left posterior cerebral artery (PCA) territory.
10. 9.4a. Non-contrast CT Brain 9.4b. Non-contrast CT Brain 9.4c. Non-contrast CT Brain
June 29, 2004 July 30, 2004
Non-contrast CT brain on 8 days post-operatively demonstrated a
focal area of low attenuation within the right frontal lobe cortex
(arrow in A) and adjacent white matter representing acute infarct.
Scan done a month later (B & C) demonstrated a massive
acute/subacute infarct involving the right MCA territory (white
arrows in B & C) and ACA (anterior cerebral artery) territory
(yellow arrow in C) with mass effect and subfalcine herniation to
the left (fig. B).
11. Q9.5. Diagnosis Please
Post-contrast Axial T1-wtd
image
T1-wtd image
FLAIR Image
Post-contrast sagittal T1
wtd image
Diffusion weighted image
(DWI)
9.5a 9.5b 9.5c 9.5d
9.5e
Diagnosis: Subacute infarct 3 weeks old involving the
right middle cerebral (MCA) artery territory.
Abnormal T2 wtd hyperintensity involving the right posterior temporal-
parietal-occipital lobe with gyral thickening best noted on FLAIR image
(arrows in B). Subacute blood outlining the cortex is best seen on pre-
contrast T1-wtd image (arrows in C). There is no definite contrast
enhancement obscured by bright signal intensity of blood. The right MCA
territory infarct is also shown on sagittal post contrast T1-wtd image
(arrows in E). Diffusion weighted image reveals bright signal intensity
(arrows in A) involving the cortex from restricted diffusion, an important
sequence in the diagnosis of acute stroke.
12. Q9.6. Diagnosis Please
July 31, 2003
December 31, 2003
Diagnosis: Non-hemorrhagic subacute enhancing infarct (2 weeks old) involving
the left basal ganglia region. Subacute infarct is seen as an area of increased signal
intensity on FLAIR image (arrow in B) and bright signal intensity on DWI (arrow in
A). Enhancement of the infarct is shown on post contrast image (arrow in D).
A repeat MRI scan done 5 months later
showed resolution of infarct and no
evidence of bright signal intensity on
diffusion weighted image E.
5 months old infarct.
9.6a 9.6b 9.6c 9.6d
9.6e 9.6f 9.6g 9.6h
13. 1a
2a
5b
6d
4b
6e
Imaging Findings of Stroke:
• MR imaging of the brain is far more sensitive than CT imaging to recognize acute
infarction.
• Diffusion wtd. pulse sequence (DW imaging) is the most sensitive MR sequence to
demonstrate stroke. This sequence is sensitive to restricted diffusion within the cell from
stroke-induced cytotoxic edema and the region of acute stroke is seen as an area of bright
signal on DWI (Figs. 1a, 2a). Cytotoxic edema can occur immediately after the initial insult
thus DWI images can reveal, the area of acute infarct immediately after the insult.
• Intravascular contrast enhancement, another sign of early stroke (Figure 1f).
• Sulcal effacement, gyral edema (Fig. 5b), loss of gray-white matter interface can occur
within 12 hours of stroke.
• Parenchymal contrast enhancement (Fig. 6d), mass effect (Fig. 4b) and hemorrhage can
occur within 1-7 days of insult.
Subacute infarct: (1 week to 8 weeks)
•Focal area of encephalomalacia
•Porencephalic dilatation of adjacent ventricle.
• Residual old blood products may be present.
Old Infarct:
• Contrast enhancement slowly decreases in time but can persist for 8 weeks, with
decreasing mass effect and abnormal signal intensity:
Acute Stroke (up to 7 days)