SlideShare a Scribd company logo
1 of 40
C H A P T E R
9 Forecasting
As part of the planning and budgeting processes that precede
each new fiscal year,
human service agencies are confronted with a series of
questions: What will the
agency caseload be? Will the caseload go up, go down, or
remain the same? What
does the revenue situation look like? Will revenues increase,
stay the same, or
decline? What about expenses? In light of changes in caseload
and revenues, can
the current pattern of expenses be maintained? Should expenses
be reduced?
Without some estimate of how many clients a human service
agency will serve in
the coming fiscal year and what the revenue and expense picture
will look like, it
is difficult to prepare a realistic line-item operating budget for a
human service
agency.
There are essentially two ways human service administrators
can estimate
future case loads, revenues, and expenses: by educated guessing
or by one or more
of a variety of generally accepted forecasting techniques. As a
general rule, the use
of one or more generally recognized forecasting techniques is
preferable to simply
guessing. While an educated guess can sometimes turn out to be
quite accurate, it
is hard to defend during the budget process.
Forecasting can be defined as techniques that predict the future
based on his-
torical data (Lee & Shim, 1990:442). One of the interesting
discoveries that
researchers have made about forecasting is that simple
techniques perform (pro-
duce estimates) that are frequently just as accurate as complex
forecasting tech-
niques (Cirincione, Gurrieri, & Van de Sande, 1999).
Consequently, one doesn’t
have to be an expert in math or statistics to use many of the
commonly recognized
forecasting techniques. This chapter presents four commonly
recognized time
series forecasting techniques: (1) simple moving averages, (2)
weighted moving
averages, (3) exponential smoothing, and (4) time series
regression. The first three
of these forecasting techniques are relatively simple and the
calculations can be
done by hand. Time series regression is a more complex
forecasting technique that
requires the use of a computer and a basic understanding of
some statistical con-
cepts. Today, a variety of low-cost computer programs can
perform not only time
series forecasting, but moving averages, weighted moving
averages, exponential
smoothing, and assorted other techniques that are not covered in
this chapter.
Before proceeding directly to the discussion of the four
forecasting tech-
niques, a few basic forecasting rules of thumb are presented.
118
Financial Management for Human Service Administrators, by
Lawrence L. Martin. Copyright © 2001 by Allyn and Bacon, a
Pearson Education Company.
ISBN
: 0-536 -12114-1
Some Basic Forecasting Rules of Thumb
Several rules of thumb can be used as guides in conducting
forecasts and inter-
preting the results.
Rule 1. Examine the data for the presence or absence of a trend.
Revenues and expenses
and, to a lesser extent, caseload, tend to change incrementally.
Consequently, either
an upward or downward trend may be present in the data.
Looking at Table 9.1, an
upward trend is clearly evident in the caseload data. The
caseload has been trend-
ing upward for the past four fiscal years. On the other hand, the
donation data do
not demonstrate a trend, but rather vary (increase and decrease)
from year to year.
In the absence of any other data or any other contextual
information about the
nature of the human service agency, the type of service
involved, the client popu-
lation, the community, the local economy, and so on, we would
expect that the
trend in the caseload data would continue for fiscal year 20X5.
We are less sure
about the forecast for donations because of the absence of a
trend.
Rule 2. The farther out the forecast, the less reliable the
forecast. A forecast that looks
ahead one fiscal year will generally be more reliable (more
accurate) than a forecast
that looks ahead three fiscal years. The reason is simple: Things
change! A good
example of the problem with forecasts that look too far ahead is
provided by the
U.S. space program. When the United States put a man on the
moon in 1969, all
kinds of forecasts about the future of space exploration were
made based on how
long it took us to reach the moon. According to many of these
forecasts, we should
already have a space colony on Mars. But we don’t. Why?
Because things change!
In the case of the space program, government funding for space
exploration was
cut back and our space exploration policy changed from using
manned spacecraft
to using unmanned spacecraft.
Rule 3. Older data are less important than more recent data.
Table 9.1 could include
donation data for fiscal years 1999, 1998, 1997, and so on. But
we know that a prob-
lem in forecasting is that things change. So, the older the data
included in a fore-
cast, the more opportunity for things to change and,
consequently, the less reliable
the forecast is likely to be.
Rule 4. The last actual value of the forecast variable is the
single most important piece of
information. In Table 9.1, the caseload and donation forecasts
are to be made for fis-
cal year 20X5; the last actual value for the caseload is 1,450
and the last actual value
for donations is $25,000. In the absence of any other data, the
single best predictor of
the future is the last value of the forecast variable. The reason
is that the last actual
value is the single piece of datum that is temporarily closest to
the forecast. For
example, if the only datum we had in Table 9.1 was the last
actual value for caseload
(1,450) for fiscal year 20X4, our best forecast for 20X5 would
be 1,450. The last actual
Forecasting 119
Financial Management for Human Service Administrators, by
Lawrence L. Martin. Copyright © 2001 by Allyn and Bacon, a
Pearson Education Company.
IS
BN
: 0
-5
36
-1
21
14
-1
value also provides a reality check for a forecast. For any
forecast, the question
should be asked, Does the forecast seem reasonable given the
last actual data?
Rule 5. The more one knows about the data, the better one can
interpret the forecast. One
can forecast anything. The real gut issue is how to interpret the
results of the fore-
cast. In Table 9.1, any one of a number of forecasting
techniques could be used to
forecast the caseload for fiscal year 20X5. But the critical issue
is, What are the data
trying to tell us? A trend in the caseload data is clearly evident
over the past four
fiscal years. The caseload was 1,200 in FY 20X1 and increased
100 cases per year for
fiscal year 20X2 and 20X3. But then something happened to the
trend. In FY 20X4,
the caseload increased by only 50. Why? What is going on?
Unfortunately, we
don’t know anything about the Palmdale Human Service
Agency, the type of ser-
vice involved, the client population, the community, the local
economy, and
numerous other factors that could help provide us with a context
in which to inter-
pret the forecast. If we had contextual information, we would be
better able to
understand what the data are trying to tell us and we would be
better able to inter-
pret the forecast. Something may be occurring with the agency,
the service, or the
community that might explain the caseload data for fiscal year
20X4 and thus help
to interpret the forecast for 20X5.
With this brief discussion of some forecasting rules of thumb
completed, we
can proceed to a discussion of our four forecasting techniques.
Simple Moving Averages
The forecasting technique called simple moving averages
involves taking historical
data on the forecast variable for a series of time periods and
computing a simple
arithmetic (mean) average. The forecaster must decide how
many time periods of
the forecast variable to include in the moving average. For
example, in Table 9.1,
we have historical values of the forecast variables of caseload
and donations for
four fiscal years. Rule 3 comes into play here: Older data are
less important than
more recent data. Following this guideline, we might decide to
use only three years
of historical data on the caseload and donations to make our
forecasts. Table 9.2
takes this approach to forecasting caseload and donation data
for fiscal year 20X5
using simple moving averages.
120 C H A P T E R 9
TABLE 9.1 The Palmdale Human Service Agency
Fiscal Year
20X1
20X2
20X3
20X4
20X5
Caseload
1,200
1,300
1,400
1,450
?
Donations
$25,000
22,000
27,000
25,000
?
Financial Management for Human Service Administrators, by
Lawrence L. Martin. Copyright © 2001 by Allyn and Bacon, a
Pearson Education Company.
ISBN
: 0-536 -12114-1
Using simple moving averages, the caseload forecast for fiscal
year 20X5 is
1,383, whereas the donations forecast is $24,667. The caseload
forecast is derived
by adding the caseload data for the three time periods and
dividing by the num-
ber of time periods. The same procedure is used to forecast
donations. At this
point we are reminded of Rule 1 relating to the presence or
absence of a trend. We
know that an upward trend exists in the caseload data, but that
no trend appears
to exist in the donations data. Thus, we should anticipate that
the caseload fore-
cast will show a continuation of the trend, whereas the
donations forecast will
continue to fluctuate.
Our expectations are satisfied with respect to the donations
forecast, but not
for the caseload forecast. The donations forecast for fiscal year
20X5 is 24,667,
which is less than the last actual data for fiscal year 20X4. The
donations forecast
continues to jump around. Our expectation is not satisfied for
the caseload fore-
cast. The caseload forecast for fiscal year 20X5 is 1,383, which
is again less than the
actual data for fiscal year 20X4. But we should expect, based on
the observed trend
in the caseload data, a forecast that is greater than the actual
caseload for fiscal year
20X4.
What is the problem with the simple moving averages forecast
of caseload for
fiscal year 20X5? Rules 3 and 4 provide some guidance. Rule 3
tells us that older
data are less important than more recent data. All the data in the
two simple mov-
ing averages forecasts are weighted the same. Actually, no
weights are used, which
has the effect of treating all data as though they were weighted
equally. Rule 4 sug-
gests that the last actual value of the forecast variable is more
important than the
other data and should perhaps be given greater weight in the
forecast.
The point needs to be made that the moving in simple moving
averages means
that for fiscal year 20X6, the forecast would be comprised of
the actual caseload
and donations data for fiscal years 20X3, 20X4, and 20X5. The
actual caseload and
donations data for 20X5 would be added to the moving averages
and the caseload
and donations data for 20X2 would be deleted. This process
keeps the simple mov-
ing average’s base of three fiscal years.
Forecasting 121
TABLE 9.2 Palmdale Human Service Agency
Caseload and Donations Forecasts
Using Simple Moving Averages
Fiscal Year
20X2
20X3
20X4
20X2–X4
20X5
Caseload
1,300
1,400
1,450
4,150
4,150
= 1,383
3
Donations
$22,000
27,000
25,000
74,000
74,000
= $24,667
3
Financial Management for Human Service Administrators, by
Lawrence L. Martin. Copyright © 2001 by Allyn and Bacon, a
Pearson Education Company.
IS
BN
: 0
-5
36
-1
21
14
-1
Weighted Moving Averages
The second of our four forecasting techniques, weighted moving
averages, attempts
to improve on simple moving averages by assigning weights to
the data that com-
prise the forecast. In keeping with Rules 3 and 4, the idea is to
place more weight
on the last actual value of the forecast variable and decreasing
weights on the older
data. For example, a common practice in weighted moving
averages is to assign a
weight of “1” to the oldest datum to be used in the forecast and
then assign increas-
ing weights to more recent data so that the last actual value
receives the greatest
weight. Following this approach, Table 9.3 shows the results of
a weighted moving
average forecast for caseload and donations for fiscal year
20X5.
Using weighted moving averages, the caseload forecast for
fiscal year 20X5 is
1,408 and the donations forecast is $25,167. The caseload
forecast is arrived at by
multiplying the caseload data for each year by its weight,
adding the results
together, and dividing by the total number of weights. The
forecast for donations
is obtained using the same approach. The caseload forecast of
1,408 appears more
realistic than the simple moving averages forecast of 1,383, but
it is still less than
the last actual caseload data of 1,450 for fiscal year 20X4.
Again, we are confronted
with the problem that we cannot put a lot of confidence in a
forecast of 1,408 unless
we have some contextual information that explains why we
should accept a case-
load forecast that does not demonstrate a continuation of the
identified trend. The
122 C H A P T E R 9
TABLE 9.3 Palmdale Human Service Agency
Forecasts Using Weighted Moving Averages
Caseload
Fiscal Year
20X2
20X3
20X4
20X5
Caseload
1,300
1,400
1,450
8,450/6 = 1,408
Weight
1
2
3
6
Weighted Score
1,300
2,800
4,350
8,450
Donations
Fiscal Year
20X2
20X3
20X4
20X5
Donations
$22,000
27,000
25,000
$151,000/6 = $25,167
Weight
1
2
3
6
Weighted Score
$ 22,000
54,000
75,000
151,000
Financial Management for Human Service Administrators, by
Lawrence L. Martin. Copyright © 2001 by Allyn and Bacon, a
Pearson Education Company.
ISBN
: 0-536 -12114-1
donations forecast of $25,167 appears reasonable given the
historical way in which
donations have tended to fluctuate.
Exponential Smoothing
In order to perform a forecast using either simple moving
averages or weighted
moving averages, the forecaster must collect and save data for
several historical
time periods. Exponential smoothing is a forecasting technique
that requires only
two pieces of information: (a) the last actual value of the
forecast variable and
(b) the last actual forecast. With these two pieces of information
and the use of a
simple formula, we can forecast caseload, revenues, expenses,
or any other vari-
able. One might say that exponential smoothing takes to heart
Rule 4 that the last
actual value of the forecast variable is the single most important
piece of informa-
tion. The forecasting formula used in exponential smoothing is
NF = LF + α (LD – LF) where NF = New forecast
LF = Last forecast
α = 0 to 1
LD = Last data
The formula is relatively straightforward with the exception of
the alpha (α).
Alpha is a value between 1 and 0 that is selected by the
forecaster. The alpha deter-
mines how much weight in the new forecast will be placed on
the last data (the last
value of the forecast variable) and, conversely, how much
weight will be placed on
the last forecast. An alpha of 1 means that 100 percent of the
new forecast will be
based on the last data and 0 per cent on the last forecast. An
exponential smooth-
ing forecast using an alpha of 1 would result in a number that
would be exactly the
same as the last actual value of the forecast variable. An alpha
of zero means that 0
percent of the new forecast will be based on the last data and
100 percent on the last
forecast. An exponential smoothing forecast using an alpha of 0
would result in a
number that is exactly the same as the last forecast. An alpha of
.5 means that 50
percent of the new forecast will be based on the last actual data
and 50 percent on
the last forecast.
When using exponential smoothing, the alpha selected is
determined by the
accuracy of the last forecast. For example, if the caseload
forecast for fiscal year
20X4 was 1,700 and the actual caseload was 1,450, then the
forecast was not very
accurate. In such a situation, the forecaster would want to select
for the next fore-
cast (fiscal year 20X5) a high alpha (.7 to .9) that places more
weight on the last
data and less weight on the last forecast. If, however, the
caseload forecast for fis-
cal year 20X4 was 1,460 and the actual caseload for fiscal year
20X4 was 1,450,
then the forecast was quite accurate. In such a situation, the
forecaster would
want to select for the next forecast (fiscal year 20X5) a low
alpha (.2 to .3) that
places more weight on the last forecast and less weight on the
last data. A small
alpha (.2 to .4) has the same effect as if data for several time
periods were included
Forecasting 123
Financial Management for Human Service Administrators, by
Lawrence L. Martin. Copyright © 2001 by Allyn and Bacon, a
Pearson Education Company.
IS
BN
: 0
-5
36
-1
21
14
-1
in the forecast. In other words, a small alpha “smooths” the
forecast, hence the
name exponential smoothing.
Let’s assume that the caseload forecast for fiscal year 20X4 was
1,500 and that
the donations forecast was $26,000. We know that the actual
caseload and dona-
tions data for fiscal year 20X4 were, respectively, 1,450 and
$25,000. Because the
caseload forecast was quite accurate, we will select an alpha of
.2 for use in our
forecast of caseload for 20X5. Because the forecast for
donations was somewhat
less accurate, we will select a higher alpha (.5) that will place
equal emphasis on
both the last forecast and the last data. This information can
now be entered into
the exponential smoothing formula (Table 9.4) and a fiscal year
20X5 forecast can
be made for both caseload and donations.
The exponential smoothing caseload forecast is 1,490 for 20X5.
This forecast
appears to be realistic because the upward trend evidenced over
the last four fiscal
years is continued and because the new forecast is greater than
the actual caseload
data of 1,450 for fiscal year 20X4. Similarly, the exponential
smoothing forecast for
donations of $25,500 for fiscal year 20X5 appears reasonable,
but we are less sure of
this forecast because of the tendency of the donations data to
fluctuate.
Time Series Regression
Time series regression is the last of the four generally
recognized forecasting tech-
niques to be discussed in this chapter and the only one that
requires the use of a
computer. Time series regression is more sophisticated than the
other forecasting
124 C H A P T E R 9
TABLE 9.4 Palmdale Human Service Agency
Caseload and Donations Forecasts
Using Exponential Smoothing
Caseload
NF = LF + α(LD – LF)
= 1,500 + .2(1,450 – 1,500)
= 1,500 + .2(–50)
= 1,500 + (–10)
= 1,490
Donations
NF = LF + α (LD – LF)
= $26,000 + .5($25,000 – $26,000)
= $26,000 + .5(–$1,000)
= $26,000 + (–$500)
= $25,500
Financial Management for Human Service Administrators, by
Lawrence L. Martin. Copyright © 2001 by Allyn and Bacon, a
Pearson Education Company.
ISBN
: 0-536 -12114-1
techniques considered, but it also more powerful and provides
more insights into
the data and the forecast. Time series regression forecasting
also yields an estimate
of how much confidence one should have in the forecast. These
features make it
one of the most commonly used forecasting techniques
(Forester, 1993). Time series
regression forecasting can be performed using any computer
software package
that contains a simple linear regression program.
Time series regression is an application of what is called the
ordinary least
squares regression model. Time series regression forecasting
attempts to find a
linear relationship between time (the independent variable) and
the forecast vari-
able (the dependent variable). A linear relationship can be
thought of as a trend.
In other words, time series regression analyzes the data looking
for a trend. The
time series regression model looks for (a) a positive linear
relationship (or trend)
between time and the forecast variable, (b) a negative linear
relationship (or
trend) between time and the value of the forecast variable, or
(c) no linear rela-
tionship (or trend). A positive linear relationship (or trend)
means that over time
the values of the forecast variable are increasing. A negative
linear relationship (or
trend) means that over time the values of the forecast variable
are decreasing. If
the time series regression model finds a moderate to strong
positive or negative
linear relationship (or trend), the computer output can be used
to make a forecast
using the formula
Y = A + BX where Y is the forecast (an unknown quantity)
A is the base or constant
B is the unit value change in the forecast variable
X is the increment of time to be forecasted
The use of an example should help make the discussion of time
series regres-
sion forecasting more understandable. Table 9.5 demonstrates
how time series
regression can be used to conduct a caseload forecast using the
caseload data we
have used in the other forecasts. In conducting a caseload
forecast using time series
regression, we are going to use all four years of available
caseload data. Using
older data here does not violate Rule 3, because (a) a time series
regression forecast
needs at least four (some would say five) data points to function
properly and
(b) the analysis is able to differentiate between changes
attributable to time (the
trend) and changes attributable to other factors.
The first part of Table 9.5 shows how the data for a time series
regression fore-
cast are entered into a computer program. Time is always
treated as the indepen-
dent variable (IV), whereas the forecast variable (e.g., caseload
or donations) is
always treated as the dependent variable (DV). When the data
are inputted into the
computer program, it is important not to reverse these variables.
Time must
always be the independent variable or the computer output will
be meaningless.
When inputting data into a time series regression, the time
periods are trans-
formed into consecutive numbers. For example, we have four
years of caseload
data (the time period) so fiscal year 20X1 = 1, 20X2 = 2, 20X3
= 3, and 20X4 = 4. The
oldest time period is always designated 1.
Forecasting 125
Financial Management for Human Service Administrators, by
Lawrence L. Martin. Copyright © 2001 by Allyn and Bacon, a
Pearson Education Company.
IS
BN
: 0
-5
36
-1
21
14
-1
The second part of Table 9.5 shows the resulting computer
output, specifi-
cally the “coefficients” and the “model summary” sections.
Computer programs
such as Statistical Packages for the Social Sciences (SPSS)
provide a lot of output
that is not essential to the purposes of conducting and
interpreting the results of a
time series regression forecast. For forecasting purposes, one
needs to know the
value of R-square, the value of A (the constant), and the value
of B (Var1). In SPSS,
the value of R-square is usually found as part of the model
summary output, while
values of the A (constant) and the B (Var1) are usually found as
part of the coeffi-
cients output.
The R-square tells us how much confidence we should have in
the forecast.
R-square can vary between 0 and 1. R-square can also be
thought of as a measure
of the strength of a trend (either positive or negative) in the
values of the forecast
variable over time. If the R-square is greater than .7, a strong
trend exists. An R-
square between .5 and .7 indicates a moderate trend; R-square
less than .5 indicates
a weak trend. Looking at the model summary portion of the
computer output
(Table 9.5), we can see that the R-square for the time series
regression is .980, which
is significantly greater than .7. In terms of interpretation, we
can say that we can
126 C H A P T E R 9
TABLE 9.5 Caseload Forecast Using Time Series Regression
Computer Input
Time Caseload
(IV) (DV)
1 1,200
2 1,300
3 1,400
4 1,450
Computer Output
Coefficients
Model
Constant
Var 1
Unstandardized Coefficients
B
1125
85
Std. Error
23.717
8.660
BETA
.990
t
47.434
9.815
Sig.
.000
.010
Model Summary
Model
1
R
.990
R-Square
.980
Adjusted
R-Square
.969
Standard Error
of the Estimate
19.3649
Standardized Coefficients
Financial Management for Human Service Administrators, by
Lawrence L. Martin. Copyright © 2001 by Allyn and Bacon, a
Pearson Education Company.
ISBN
: 0-536 -12114-1
have a high degree of confidence in the result of a time series
regression forecast.
Another interpretation is that the time series regression analysis
has found a strong
trend in the caseload data. This strong trend can be used for
forecasting purposes.
In order to perform a time series regression forecast, we must
substitute the
relevant values into the formula Y = A + BX (Table 9.6). To the
base value of A (a
constant), we add B (Var1) multiplied by X (the time period to
be forecasted). Since
we are using four years of caseload data in the time series
regression and we are
performing a forecast for the next fiscal year, X = 5. The result
is a caseload forecast
of 1,550. This caseload forecast looks good because it is a
continuation of the
observed trend in the caseload data and because it is greater
than the last actual
caseload data for fiscal year 20X4.
Why does the time series caseload forecast perform so much
better than the
other forecasting techniques? The answer is that time series
regression is particu-
larly sensitive to, and performs best, when a strong trend is
present. The three
other forecasting techniques discussed in this chapter are not as
sensitive to trends.
At this point it is probably advisable to pause for a moment and
explain
exactly what the values of the A (constant) and the B (Var1 or
variable 1) mean in a
time series regression. When conducting a time series
regression, many computer
programs provide for the optional generation of a graph of the
linear relationship
between time and the forecast variable. Figure 9.1 is such a
graph. The indepen-
dent variable (time) is shown on the x-axis and the dependent
variable (caseload)
is shown on the y-axis. In the middle of the graph are four data
points. The first
data point represents the caseload data (1,200) for fiscal year
20X1 (year 1). The sec-
ond data point represents the caseload data (1,300) for fiscal
year 20X2 (year 2). The
third data point represents the caseload data (1,400) for fiscal
year 20X3 (year 3).
And finally, the fourth data point represents the caseload data
(1,450) for 20X4
(year 4).
The line in the center of the graph is the regression line. The
regression line can
be thought of as “the best line” that expresses the linear
relationship (the trend)
between time and the forecast variable. The line begins at
1,125. This point is called
A (constant) because it is the fixed point at which the
regression line begins. This
point is also called the y-intercept because it is the point at
which the regression line
crosses the y-axis. The slope of the regression line then goes up
85 (B or Var1) for
each time period (year). In performing the actual time series
regression forecast,
the regression line is simply extended out to the time period
being forecasted. In
Forecasting 127
TABLE 9.6 Caseload Forecast Using Time
Series Regression
Y = A + BX
= 1125 + 85(5)
= 1125 + 425
= 1550
Financial Management for Human Service Administrators, by
Lawrence L. Martin. Copyright © 2001 by Allyn and Bacon, a
Pearson Education Company.
IS
BN
: 0
-5
36
-1
21
14
-1
this example, caseload is being forecasted for the fifth year. The
mathematics of the
forecast are simply to begin with the value of A (constant) and
then to add the
value of B (Var1) for each time period (year) up to the forecast
time period (year):
1,125 + 85 (year 1) + 85 (year 2) + 85 (year 3) + 85 (year 4) +
85 (year 5) = 1,550
Now let’s do a time series regression forecast for donations.
The top portion of
Table 9.7 shows how the data are entered into the computer
program; the lower por-
tion shows the computer output. In the “coefficients” section of
the output, we see
that the value of A (constant) is 23,500 and the value of B
(Var1) is 500. In the model
summary section, we see that the R-square is .098. The R-
square is extremely low,
which means that we can have little confidence in any forecast
made using time
series regression. Another way of interpreting the low R-Square
is that the com-
puter could not find a trend in the data. Knowing that we can
have no confidence in
the results, let’s go ahead anyway and do a time series
regression forecast using the
formula Y = A + BX (see Table 9.8) The resulting forecast for
donations is $27,000 in
fiscal year 20X5, but we know that we can have absolutely no
confidence in this
forecast.
The two time series regression forecasts for caseload and for
donations
demonstrate the strengths and limitations of this forecasting
technique. Time series
regression forecasting works well when a strong (R-square = .7
or greater) trend
exists, works less well when a moderate (R-square = .4 to .7)
trend exist, and does
not work well at all when a weak (R-square = less than .4)
exists.
128 C H A P T E R 9
FIGURE 9.1 Graph of Time and Caseload
with Regression Line
1600
1500
1400
1300
1200
1100
1000
1 2 3 4 5
x -axis
y
-a
xi
s
Financial Management for Human Service Administrators, by
Lawrence L. Martin. Copyright © 2001 by Allyn and Bacon, a
Pearson Education Company.
ISBN
: 0-536 -12114-1
When to Use Which Forecasting Technique
The preceding discussion of the four generally recognized
forecasting techniques
(in particular, the discussion of time series regression) allows
three more rules of
thumb to be offered:
Rule 6. When a strong trend (R-square = .7 or greater) is
present in the data, use
time series regression.
Forecasting 129
TABLE 9.7 Donations Using Time Series Regression
Computer Input
Time Caseload
(IV) (DV)
1 $25,000
2 22,000
3 27,000
4 25,000
Computer Output
Coefficients
Model
Constant
Var 1
Unstandardized Coefficients
B
23,500
500
Std. Error
2936.835
1702.381
BETA
.313
t
8.002
.466
Sig.
.015
.687
Model Summary
Model
1
R
.313
R-Square
.098
Adjusted
R-Square
–.353
Standard Error
of the Estimate
2397.9165
Standardized Coefficients
TABLE 9.8 Donations Using Time
Series Regression
Y = A + BX
= $23,500 + $500(5)
= $23,500 + $2,500
= $27,000
Financial Management for Human Service Administrators, by
Lawrence L. Martin. Copyright © 2001 by Allyn and Bacon, a
Pearson Education Company.
IS
BN
: 0
-5
36
-1
21
14
-1
Rule 7. When a moderate trend (R-square = .4 to .7) is present
in the data, use
moving averages or weighted moving averages.
Rule 8. When a weak trend (R-square = less than .4) or no trend
is present in the
data, use exponential smoothing with the choice of alpha
dependent upon the
accuracy of the last forecast.
Following Rule 6, for any given forecast, a forecaster should
first use time
series regression and determine if a trend is present in the data
and the strength of
any such trend.
Summary
This chapter presented four generally recognized forecasting
techniques: (1) sim-
ple moving averages, (2) weighted moving averages, (3)
exponential smoothing,
and (4) time series regression. The advantages and
disadvantages of each forecast-
ing technique were identified and several rules of thumb were
provided to guide
human services administrators in the selection of the most
appropriate forecasting
technique and in interpreting the results of forecasts.
E X E R C I S E S
Exercise 9.1
The following data represent total personnel expenses for the
Palmdale Human
Service Agency for past four fiscal years:
20X1 $5,250,000
20X2 $5,500,000
20X3 $6,000,000
20X4 $6,750,000
Forecast personnel expenses for fiscal year 20X5 using moving
averages, weighted
moving averages, exponential smoothing, and time series
regression. For moving
averages and weighted moving averages, use only the data for
the past three fiscal
years. For weighted moving averages, assign a value of 1 to the
data for 20X2, a
value of 2 to the data for 20X3, and a value of 3 to the data for
20X4. For exponen-
tial smoothing, assume that the last forecast for fiscal year
20X4 was $6,300,000.
You decide on the alpha to be used for exponential smoothing.
For time series
regression, use the data for all four fiscal years. Which forecast
will you use? Why?
130 C H A P T E R 9
Financial Management for Human Service Administrators, by
Lawrence L. Martin. Copyright © 2001 by Allyn and Bacon, a
Pearson Education Company.
ISBN
: 0-536 -12114-1
Exercise 9.2
The following data represent total “person trips” (service
outputs or units of ser-
vice) provided by the Palmdale Human Service Agency’s
specialized transporta-
tion program for the past four fiscal years:
20X1 12,000
20X2 15,000
20X3 13,500
20X4 14,250
Forecast person trips for fiscal year 20X5 using moving
averages, weighted mov-
ing averages, exponential smoothing, and time series regression.
For moving aver-
ages and weighted moving averages, use only the data for the
past three fiscal
years. For weighted moving averages, assign a value of 1 to the
data for 20X2, a
value of 2 to the data for 20X3, and a value of 3 to the data for
20X4. For exponen-
tial smoothing, assume that the last forecast for fiscal year
20X4 was 15,000. You
decide on the alpha to be used for exponential smoothing. For
time series regres-
sion, use the data for all four fiscal years. Which forecast will
you use? Why?
Exercise 9.3
The following data represent total revenues (from all sources)
for the Palmdale
Human Service Agency for the past four fiscal years:
20X1 $15,000,000
20X2 $14,250,000
20X3 $14,000,000
20X4 $13,500,000
Forecast total revenues for fiscal year 20X5 using moving
averages, weighted mov-
ing averages, exponential smoothing, and time series regression.
For moving aver-
ages and weighted moving averages, use only the data for the
past three fiscal
years. For weighted moving averages, assign a value of 1 to the
data for 20X2, a
value of 2 to the data for 20X3, and a value of 3 to the data for
20X4. For exponen-
tial smoothing, assume that the last forecast for fiscal year
20X4 was $13,000,000.
You decide on the alpha to be used for exponential smoothing.
For time series
regression, use the data for all four fiscal years. Which forecast
will you use? Why?
Forecasting 131
Financial Management for Human Service Administrators, by
Lawrence L. Martin. Copyright © 2001 by Allyn and Bacon, a
Pearson Education Company.
IS
BN
: 0
-5
36
-1
21
14
-1

More Related Content

Similar to C H A P T E R9 ForecastingAs part of the planning and bu.docx

Charity Excellence Crisis Impact Assessment & Forecast For Grant Makers & Sec...
Charity Excellence Crisis Impact Assessment & Forecast For Grant Makers & Sec...Charity Excellence Crisis Impact Assessment & Forecast For Grant Makers & Sec...
Charity Excellence Crisis Impact Assessment & Forecast For Grant Makers & Sec...Ian Mclintock
 
Monthly abr20 credit qi
Monthly abr20 credit qiMonthly abr20 credit qi
Monthly abr20 credit qiEyeHigh
 
An Analysis Of Communication Flow
An Analysis Of Communication FlowAn Analysis Of Communication Flow
An Analysis Of Communication FlowMelissa Moore
 
Budgeting for Federal Insurance and Retirement Programs: Cash or Accrual?
Budgeting for Federal Insurance and Retirement Programs: Cash or Accrual?Budgeting for Federal Insurance and Retirement Programs: Cash or Accrual?
Budgeting for Federal Insurance and Retirement Programs: Cash or Accrual?Congressional Budget Office
 
Afonso et al 2022 - Do financial markets reward government spending efficienc...
Afonso et al 2022 - Do financial markets reward government spending efficienc...Afonso et al 2022 - Do financial markets reward government spending efficienc...
Afonso et al 2022 - Do financial markets reward government spending efficienc...JorgeAlbertoGuerra
 
Earnings Persistence of Cash Flow and Accruals - Vietnam Market
Earnings Persistence of Cash Flow and Accruals - Vietnam MarketEarnings Persistence of Cash Flow and Accruals - Vietnam Market
Earnings Persistence of Cash Flow and Accruals - Vietnam MarketBang Vu
 
Essay On Stamford International Inc
Essay On Stamford International IncEssay On Stamford International Inc
Essay On Stamford International IncDeborah Gastineau
 
pwc-sec-comment-letter-trends-2014
pwc-sec-comment-letter-trends-2014pwc-sec-comment-letter-trends-2014
pwc-sec-comment-letter-trends-2014Ken Stoler
 
Budgeting for Federal Insurance and Retirement Programs: Cash or Accrual?
Budgeting for Federal Insurance and Retirement Programs: Cash or Accrual?Budgeting for Federal Insurance and Retirement Programs: Cash or Accrual?
Budgeting for Federal Insurance and Retirement Programs: Cash or Accrual?Congressional Budget Office
 
Macroeconomic relationships
Macroeconomic relationshipsMacroeconomic relationships
Macroeconomic relationshipsGaetan Lion
 
The Importance Of Volunteer Accounting
The Importance Of Volunteer AccountingThe Importance Of Volunteer Accounting
The Importance Of Volunteer AccountingBarb Tillich
 
Comments on BEPS Monitoring May 8
Comments on BEPS Monitoring May 8Comments on BEPS Monitoring May 8
Comments on BEPS Monitoring May 8Flavia Garcia
 
Countries' updates - Scott Showalter, FASAB, United States
Countries' updates - Scott Showalter, FASAB, United StatesCountries' updates - Scott Showalter, FASAB, United States
Countries' updates - Scott Showalter, FASAB, United StatesOECD Governance
 
ACC 291 Exceptional Education-snaptutorial.com
ACC 291 Exceptional Education-snaptutorial.comACC 291 Exceptional Education-snaptutorial.com
ACC 291 Exceptional Education-snaptutorial.comrobertleews
 
Acc 291 Enhance teaching-snaptutorial.com
Acc 291 Enhance teaching-snaptutorial.comAcc 291 Enhance teaching-snaptutorial.com
Acc 291 Enhance teaching-snaptutorial.comrobertleew
 
Exercise 14–2 Cumulative Inflation Factor for CompChapter Notes.docx
Exercise 14–2 Cumulative Inflation Factor for CompChapter Notes.docxExercise 14–2 Cumulative Inflation Factor for CompChapter Notes.docx
Exercise 14–2 Cumulative Inflation Factor for CompChapter Notes.docxgitagrimston
 

Similar to C H A P T E R9 ForecastingAs part of the planning and bu.docx (18)

Ch 1.pdf
Ch 1.pdfCh 1.pdf
Ch 1.pdf
 
Charity Excellence Crisis Impact Assessment & Forecast For Grant Makers & Sec...
Charity Excellence Crisis Impact Assessment & Forecast For Grant Makers & Sec...Charity Excellence Crisis Impact Assessment & Forecast For Grant Makers & Sec...
Charity Excellence Crisis Impact Assessment & Forecast For Grant Makers & Sec...
 
Monthly abr20 credit qi
Monthly abr20 credit qiMonthly abr20 credit qi
Monthly abr20 credit qi
 
An Analysis Of Communication Flow
An Analysis Of Communication FlowAn Analysis Of Communication Flow
An Analysis Of Communication Flow
 
Budgeting for Federal Insurance and Retirement Programs: Cash or Accrual?
Budgeting for Federal Insurance and Retirement Programs: Cash or Accrual?Budgeting for Federal Insurance and Retirement Programs: Cash or Accrual?
Budgeting for Federal Insurance and Retirement Programs: Cash or Accrual?
 
Afonso et al 2022 - Do financial markets reward government spending efficienc...
Afonso et al 2022 - Do financial markets reward government spending efficienc...Afonso et al 2022 - Do financial markets reward government spending efficienc...
Afonso et al 2022 - Do financial markets reward government spending efficienc...
 
Earnings Persistence of Cash Flow and Accruals - Vietnam Market
Earnings Persistence of Cash Flow and Accruals - Vietnam MarketEarnings Persistence of Cash Flow and Accruals - Vietnam Market
Earnings Persistence of Cash Flow and Accruals - Vietnam Market
 
Fiscal Highlights, June 2010
Fiscal Highlights, June 2010Fiscal Highlights, June 2010
Fiscal Highlights, June 2010
 
Essay On Stamford International Inc
Essay On Stamford International IncEssay On Stamford International Inc
Essay On Stamford International Inc
 
pwc-sec-comment-letter-trends-2014
pwc-sec-comment-letter-trends-2014pwc-sec-comment-letter-trends-2014
pwc-sec-comment-letter-trends-2014
 
Budgeting for Federal Insurance and Retirement Programs: Cash or Accrual?
Budgeting for Federal Insurance and Retirement Programs: Cash or Accrual?Budgeting for Federal Insurance and Retirement Programs: Cash or Accrual?
Budgeting for Federal Insurance and Retirement Programs: Cash or Accrual?
 
Macroeconomic relationships
Macroeconomic relationshipsMacroeconomic relationships
Macroeconomic relationships
 
The Importance Of Volunteer Accounting
The Importance Of Volunteer AccountingThe Importance Of Volunteer Accounting
The Importance Of Volunteer Accounting
 
Comments on BEPS Monitoring May 8
Comments on BEPS Monitoring May 8Comments on BEPS Monitoring May 8
Comments on BEPS Monitoring May 8
 
Countries' updates - Scott Showalter, FASAB, United States
Countries' updates - Scott Showalter, FASAB, United StatesCountries' updates - Scott Showalter, FASAB, United States
Countries' updates - Scott Showalter, FASAB, United States
 
ACC 291 Exceptional Education-snaptutorial.com
ACC 291 Exceptional Education-snaptutorial.comACC 291 Exceptional Education-snaptutorial.com
ACC 291 Exceptional Education-snaptutorial.com
 
Acc 291 Enhance teaching-snaptutorial.com
Acc 291 Enhance teaching-snaptutorial.comAcc 291 Enhance teaching-snaptutorial.com
Acc 291 Enhance teaching-snaptutorial.com
 
Exercise 14–2 Cumulative Inflation Factor for CompChapter Notes.docx
Exercise 14–2 Cumulative Inflation Factor for CompChapter Notes.docxExercise 14–2 Cumulative Inflation Factor for CompChapter Notes.docx
Exercise 14–2 Cumulative Inflation Factor for CompChapter Notes.docx
 

More from humphrieskalyn

Evaluate the role of leadership on organizational behaviorProv.docx
Evaluate the role of leadership on organizational behaviorProv.docxEvaluate the role of leadership on organizational behaviorProv.docx
Evaluate the role of leadership on organizational behaviorProv.docxhumphrieskalyn
 
Evaluate the role that PKI plays in cryptography.Ensure that you.docx
Evaluate the role that PKI plays in cryptography.Ensure that you.docxEvaluate the role that PKI plays in cryptography.Ensure that you.docx
Evaluate the role that PKI plays in cryptography.Ensure that you.docxhumphrieskalyn
 
Evaluate the presence and effects of alteration in the homeostatic s.docx
Evaluate the presence and effects of alteration in the homeostatic s.docxEvaluate the presence and effects of alteration in the homeostatic s.docx
Evaluate the presence and effects of alteration in the homeostatic s.docxhumphrieskalyn
 
Evaluate the role of a digital certificate in cryptography.  How doe.docx
Evaluate the role of a digital certificate in cryptography.  How doe.docxEvaluate the role of a digital certificate in cryptography.  How doe.docx
Evaluate the role of a digital certificate in cryptography.  How doe.docxhumphrieskalyn
 
Evaluate the merits of Piaget’s stage theory for explaining cognitiv.docx
Evaluate the merits of Piaget’s stage theory for explaining cognitiv.docxEvaluate the merits of Piaget’s stage theory for explaining cognitiv.docx
Evaluate the merits of Piaget’s stage theory for explaining cognitiv.docxhumphrieskalyn
 
Evaluate the notion that white collar offenders are intrinsically di.docx
Evaluate the notion that white collar offenders are intrinsically di.docxEvaluate the notion that white collar offenders are intrinsically di.docx
Evaluate the notion that white collar offenders are intrinsically di.docxhumphrieskalyn
 
EV 551 Hazardous Materials Assessment – Summer2020Homework 1 – 4.docx
EV 551 Hazardous Materials Assessment – Summer2020Homework 1 – 4.docxEV 551 Hazardous Materials Assessment – Summer2020Homework 1 – 4.docx
EV 551 Hazardous Materials Assessment – Summer2020Homework 1 – 4.docxhumphrieskalyn
 
Evaluate the history of cryptography from its origins.  Analyze how .docx
Evaluate the history of cryptography from its origins.  Analyze how .docxEvaluate the history of cryptography from its origins.  Analyze how .docx
Evaluate the history of cryptography from its origins.  Analyze how .docxhumphrieskalyn
 
Evaluate the evidence provided by Apollo Shoes.Decide how to s.docx
Evaluate the evidence provided by Apollo Shoes.Decide how to s.docxEvaluate the evidence provided by Apollo Shoes.Decide how to s.docx
Evaluate the evidence provided by Apollo Shoes.Decide how to s.docxhumphrieskalyn
 
Evaluate the Health History and Medical Information for Mrs. J.,.docx
Evaluate the Health History and Medical Information for Mrs. J.,.docxEvaluate the Health History and Medical Information for Mrs. J.,.docx
Evaluate the Health History and Medical Information for Mrs. J.,.docxhumphrieskalyn
 
Evaluate the current state of the health care system in Sacramento. .docx
Evaluate the current state of the health care system in Sacramento. .docxEvaluate the current state of the health care system in Sacramento. .docx
Evaluate the current state of the health care system in Sacramento. .docxhumphrieskalyn
 
Evaluate the advantages and disadvantages of the various decis.docx
Evaluate the advantages and disadvantages of the various decis.docxEvaluate the advantages and disadvantages of the various decis.docx
Evaluate the advantages and disadvantages of the various decis.docxhumphrieskalyn
 
Evaluate some technologies that can help with continuous monitoring..docx
Evaluate some technologies that can help with continuous monitoring..docxEvaluate some technologies that can help with continuous monitoring..docx
Evaluate some technologies that can help with continuous monitoring..docxhumphrieskalyn
 
Evaluate progress on certification plansReport your prog.docx
Evaluate progress on certification plansReport your prog.docxEvaluate progress on certification plansReport your prog.docx
Evaluate progress on certification plansReport your prog.docxhumphrieskalyn
 
Evaluate how you have achieved course competencies and your plans to.docx
Evaluate how you have achieved course competencies and your plans to.docxEvaluate how you have achieved course competencies and your plans to.docx
Evaluate how you have achieved course competencies and your plans to.docxhumphrieskalyn
 
Evaluate how information privacy and security relates to the Interne.docx
Evaluate how information privacy and security relates to the Interne.docxEvaluate how information privacy and security relates to the Interne.docx
Evaluate how information privacy and security relates to the Interne.docxhumphrieskalyn
 
Evaluate assessment of suicide in forensic settings andor cri.docx
Evaluate assessment of suicide in forensic settings andor cri.docxEvaluate assessment of suicide in forensic settings andor cri.docx
Evaluate assessment of suicide in forensic settings andor cri.docxhumphrieskalyn
 
Evaluate different approaches to ethical decision making. Then, choo.docx
Evaluate different approaches to ethical decision making. Then, choo.docxEvaluate different approaches to ethical decision making. Then, choo.docx
Evaluate different approaches to ethical decision making. Then, choo.docxhumphrieskalyn
 
Evaluate and grade websites in terms of their compliance with PL pri.docx
Evaluate and grade websites in terms of their compliance with PL pri.docxEvaluate and grade websites in terms of their compliance with PL pri.docx
Evaluate and grade websites in terms of their compliance with PL pri.docxhumphrieskalyn
 
Evaluate at least (2) factors that make financial statement analys.docx
Evaluate at least (2) factors that make financial statement analys.docxEvaluate at least (2) factors that make financial statement analys.docx
Evaluate at least (2) factors that make financial statement analys.docxhumphrieskalyn
 

More from humphrieskalyn (20)

Evaluate the role of leadership on organizational behaviorProv.docx
Evaluate the role of leadership on organizational behaviorProv.docxEvaluate the role of leadership on organizational behaviorProv.docx
Evaluate the role of leadership on organizational behaviorProv.docx
 
Evaluate the role that PKI plays in cryptography.Ensure that you.docx
Evaluate the role that PKI plays in cryptography.Ensure that you.docxEvaluate the role that PKI plays in cryptography.Ensure that you.docx
Evaluate the role that PKI plays in cryptography.Ensure that you.docx
 
Evaluate the presence and effects of alteration in the homeostatic s.docx
Evaluate the presence and effects of alteration in the homeostatic s.docxEvaluate the presence and effects of alteration in the homeostatic s.docx
Evaluate the presence and effects of alteration in the homeostatic s.docx
 
Evaluate the role of a digital certificate in cryptography.  How doe.docx
Evaluate the role of a digital certificate in cryptography.  How doe.docxEvaluate the role of a digital certificate in cryptography.  How doe.docx
Evaluate the role of a digital certificate in cryptography.  How doe.docx
 
Evaluate the merits of Piaget’s stage theory for explaining cognitiv.docx
Evaluate the merits of Piaget’s stage theory for explaining cognitiv.docxEvaluate the merits of Piaget’s stage theory for explaining cognitiv.docx
Evaluate the merits of Piaget’s stage theory for explaining cognitiv.docx
 
Evaluate the notion that white collar offenders are intrinsically di.docx
Evaluate the notion that white collar offenders are intrinsically di.docxEvaluate the notion that white collar offenders are intrinsically di.docx
Evaluate the notion that white collar offenders are intrinsically di.docx
 
EV 551 Hazardous Materials Assessment – Summer2020Homework 1 – 4.docx
EV 551 Hazardous Materials Assessment – Summer2020Homework 1 – 4.docxEV 551 Hazardous Materials Assessment – Summer2020Homework 1 – 4.docx
EV 551 Hazardous Materials Assessment – Summer2020Homework 1 – 4.docx
 
Evaluate the history of cryptography from its origins.  Analyze how .docx
Evaluate the history of cryptography from its origins.  Analyze how .docxEvaluate the history of cryptography from its origins.  Analyze how .docx
Evaluate the history of cryptography from its origins.  Analyze how .docx
 
Evaluate the evidence provided by Apollo Shoes.Decide how to s.docx
Evaluate the evidence provided by Apollo Shoes.Decide how to s.docxEvaluate the evidence provided by Apollo Shoes.Decide how to s.docx
Evaluate the evidence provided by Apollo Shoes.Decide how to s.docx
 
Evaluate the Health History and Medical Information for Mrs. J.,.docx
Evaluate the Health History and Medical Information for Mrs. J.,.docxEvaluate the Health History and Medical Information for Mrs. J.,.docx
Evaluate the Health History and Medical Information for Mrs. J.,.docx
 
Evaluate the current state of the health care system in Sacramento. .docx
Evaluate the current state of the health care system in Sacramento. .docxEvaluate the current state of the health care system in Sacramento. .docx
Evaluate the current state of the health care system in Sacramento. .docx
 
Evaluate the advantages and disadvantages of the various decis.docx
Evaluate the advantages and disadvantages of the various decis.docxEvaluate the advantages and disadvantages of the various decis.docx
Evaluate the advantages and disadvantages of the various decis.docx
 
Evaluate some technologies that can help with continuous monitoring..docx
Evaluate some technologies that can help with continuous monitoring..docxEvaluate some technologies that can help with continuous monitoring..docx
Evaluate some technologies that can help with continuous monitoring..docx
 
Evaluate progress on certification plansReport your prog.docx
Evaluate progress on certification plansReport your prog.docxEvaluate progress on certification plansReport your prog.docx
Evaluate progress on certification plansReport your prog.docx
 
Evaluate how you have achieved course competencies and your plans to.docx
Evaluate how you have achieved course competencies and your plans to.docxEvaluate how you have achieved course competencies and your plans to.docx
Evaluate how you have achieved course competencies and your plans to.docx
 
Evaluate how information privacy and security relates to the Interne.docx
Evaluate how information privacy and security relates to the Interne.docxEvaluate how information privacy and security relates to the Interne.docx
Evaluate how information privacy and security relates to the Interne.docx
 
Evaluate assessment of suicide in forensic settings andor cri.docx
Evaluate assessment of suicide in forensic settings andor cri.docxEvaluate assessment of suicide in forensic settings andor cri.docx
Evaluate assessment of suicide in forensic settings andor cri.docx
 
Evaluate different approaches to ethical decision making. Then, choo.docx
Evaluate different approaches to ethical decision making. Then, choo.docxEvaluate different approaches to ethical decision making. Then, choo.docx
Evaluate different approaches to ethical decision making. Then, choo.docx
 
Evaluate and grade websites in terms of their compliance with PL pri.docx
Evaluate and grade websites in terms of their compliance with PL pri.docxEvaluate and grade websites in terms of their compliance with PL pri.docx
Evaluate and grade websites in terms of their compliance with PL pri.docx
 
Evaluate at least (2) factors that make financial statement analys.docx
Evaluate at least (2) factors that make financial statement analys.docxEvaluate at least (2) factors that make financial statement analys.docx
Evaluate at least (2) factors that make financial statement analys.docx
 

Recently uploaded

psychiatric nursing HISTORY COLLECTION .docx
psychiatric  nursing HISTORY  COLLECTION  .docxpsychiatric  nursing HISTORY  COLLECTION  .docx
psychiatric nursing HISTORY COLLECTION .docxPoojaSen20
 
ICT role in 21st century education and it's challenges.
ICT role in 21st century education and it's challenges.ICT role in 21st century education and it's challenges.
ICT role in 21st century education and it's challenges.MaryamAhmad92
 
Grant Readiness 101 TechSoup and Remy Consulting
Grant Readiness 101 TechSoup and Remy ConsultingGrant Readiness 101 TechSoup and Remy Consulting
Grant Readiness 101 TechSoup and Remy ConsultingTechSoup
 
UGC NET Paper 1 Mathematical Reasoning & Aptitude.pdf
UGC NET Paper 1 Mathematical Reasoning & Aptitude.pdfUGC NET Paper 1 Mathematical Reasoning & Aptitude.pdf
UGC NET Paper 1 Mathematical Reasoning & Aptitude.pdfNirmal Dwivedi
 
Third Battle of Panipat detailed notes.pptx
Third Battle of Panipat detailed notes.pptxThird Battle of Panipat detailed notes.pptx
Third Battle of Panipat detailed notes.pptxAmita Gupta
 
Unit-IV- Pharma. Marketing Channels.pptx
Unit-IV- Pharma. Marketing Channels.pptxUnit-IV- Pharma. Marketing Channels.pptx
Unit-IV- Pharma. Marketing Channels.pptxVishalSingh1417
 
Explore beautiful and ugly buildings. Mathematics helps us create beautiful d...
Explore beautiful and ugly buildings. Mathematics helps us create beautiful d...Explore beautiful and ugly buildings. Mathematics helps us create beautiful d...
Explore beautiful and ugly buildings. Mathematics helps us create beautiful d...christianmathematics
 
Understanding Accommodations and Modifications
Understanding  Accommodations and ModificationsUnderstanding  Accommodations and Modifications
Understanding Accommodations and ModificationsMJDuyan
 
ICT Role in 21st Century Education & its Challenges.pptx
ICT Role in 21st Century Education & its Challenges.pptxICT Role in 21st Century Education & its Challenges.pptx
ICT Role in 21st Century Education & its Challenges.pptxAreebaZafar22
 
Application orientated numerical on hev.ppt
Application orientated numerical on hev.pptApplication orientated numerical on hev.ppt
Application orientated numerical on hev.pptRamjanShidvankar
 
Kodo Millet PPT made by Ghanshyam bairwa college of Agriculture kumher bhara...
Kodo Millet  PPT made by Ghanshyam bairwa college of Agriculture kumher bhara...Kodo Millet  PPT made by Ghanshyam bairwa college of Agriculture kumher bhara...
Kodo Millet PPT made by Ghanshyam bairwa college of Agriculture kumher bhara...pradhanghanshyam7136
 
1029 - Danh muc Sach Giao Khoa 10 . pdf
1029 -  Danh muc Sach Giao Khoa 10 . pdf1029 -  Danh muc Sach Giao Khoa 10 . pdf
1029 - Danh muc Sach Giao Khoa 10 . pdfQucHHunhnh
 
Activity 01 - Artificial Culture (1).pdf
Activity 01 - Artificial Culture (1).pdfActivity 01 - Artificial Culture (1).pdf
Activity 01 - Artificial Culture (1).pdfciinovamais
 
2024-NATIONAL-LEARNING-CAMP-AND-OTHER.pptx
2024-NATIONAL-LEARNING-CAMP-AND-OTHER.pptx2024-NATIONAL-LEARNING-CAMP-AND-OTHER.pptx
2024-NATIONAL-LEARNING-CAMP-AND-OTHER.pptxMaritesTamaniVerdade
 
How to Create and Manage Wizard in Odoo 17
How to Create and Manage Wizard in Odoo 17How to Create and Manage Wizard in Odoo 17
How to Create and Manage Wizard in Odoo 17Celine George
 
Dyslexia AI Workshop for Slideshare.pptx
Dyslexia AI Workshop for Slideshare.pptxDyslexia AI Workshop for Slideshare.pptx
Dyslexia AI Workshop for Slideshare.pptxcallscotland1987
 
Micro-Scholarship, What it is, How can it help me.pdf
Micro-Scholarship, What it is, How can it help me.pdfMicro-Scholarship, What it is, How can it help me.pdf
Micro-Scholarship, What it is, How can it help me.pdfPoh-Sun Goh
 
Russian Escort Service in Delhi 11k Hotel Foreigner Russian Call Girls in Delhi
Russian Escort Service in Delhi 11k Hotel Foreigner Russian Call Girls in DelhiRussian Escort Service in Delhi 11k Hotel Foreigner Russian Call Girls in Delhi
Russian Escort Service in Delhi 11k Hotel Foreigner Russian Call Girls in Delhikauryashika82
 
Unit-V; Pricing (Pharma Marketing Management).pptx
Unit-V; Pricing (Pharma Marketing Management).pptxUnit-V; Pricing (Pharma Marketing Management).pptx
Unit-V; Pricing (Pharma Marketing Management).pptxVishalSingh1417
 
Magic bus Group work1and 2 (Team 3).pptx
Magic bus Group work1and 2 (Team 3).pptxMagic bus Group work1and 2 (Team 3).pptx
Magic bus Group work1and 2 (Team 3).pptxdhanalakshmis0310
 

Recently uploaded (20)

psychiatric nursing HISTORY COLLECTION .docx
psychiatric  nursing HISTORY  COLLECTION  .docxpsychiatric  nursing HISTORY  COLLECTION  .docx
psychiatric nursing HISTORY COLLECTION .docx
 
ICT role in 21st century education and it's challenges.
ICT role in 21st century education and it's challenges.ICT role in 21st century education and it's challenges.
ICT role in 21st century education and it's challenges.
 
Grant Readiness 101 TechSoup and Remy Consulting
Grant Readiness 101 TechSoup and Remy ConsultingGrant Readiness 101 TechSoup and Remy Consulting
Grant Readiness 101 TechSoup and Remy Consulting
 
UGC NET Paper 1 Mathematical Reasoning & Aptitude.pdf
UGC NET Paper 1 Mathematical Reasoning & Aptitude.pdfUGC NET Paper 1 Mathematical Reasoning & Aptitude.pdf
UGC NET Paper 1 Mathematical Reasoning & Aptitude.pdf
 
Third Battle of Panipat detailed notes.pptx
Third Battle of Panipat detailed notes.pptxThird Battle of Panipat detailed notes.pptx
Third Battle of Panipat detailed notes.pptx
 
Unit-IV- Pharma. Marketing Channels.pptx
Unit-IV- Pharma. Marketing Channels.pptxUnit-IV- Pharma. Marketing Channels.pptx
Unit-IV- Pharma. Marketing Channels.pptx
 
Explore beautiful and ugly buildings. Mathematics helps us create beautiful d...
Explore beautiful and ugly buildings. Mathematics helps us create beautiful d...Explore beautiful and ugly buildings. Mathematics helps us create beautiful d...
Explore beautiful and ugly buildings. Mathematics helps us create beautiful d...
 
Understanding Accommodations and Modifications
Understanding  Accommodations and ModificationsUnderstanding  Accommodations and Modifications
Understanding Accommodations and Modifications
 
ICT Role in 21st Century Education & its Challenges.pptx
ICT Role in 21st Century Education & its Challenges.pptxICT Role in 21st Century Education & its Challenges.pptx
ICT Role in 21st Century Education & its Challenges.pptx
 
Application orientated numerical on hev.ppt
Application orientated numerical on hev.pptApplication orientated numerical on hev.ppt
Application orientated numerical on hev.ppt
 
Kodo Millet PPT made by Ghanshyam bairwa college of Agriculture kumher bhara...
Kodo Millet  PPT made by Ghanshyam bairwa college of Agriculture kumher bhara...Kodo Millet  PPT made by Ghanshyam bairwa college of Agriculture kumher bhara...
Kodo Millet PPT made by Ghanshyam bairwa college of Agriculture kumher bhara...
 
1029 - Danh muc Sach Giao Khoa 10 . pdf
1029 -  Danh muc Sach Giao Khoa 10 . pdf1029 -  Danh muc Sach Giao Khoa 10 . pdf
1029 - Danh muc Sach Giao Khoa 10 . pdf
 
Activity 01 - Artificial Culture (1).pdf
Activity 01 - Artificial Culture (1).pdfActivity 01 - Artificial Culture (1).pdf
Activity 01 - Artificial Culture (1).pdf
 
2024-NATIONAL-LEARNING-CAMP-AND-OTHER.pptx
2024-NATIONAL-LEARNING-CAMP-AND-OTHER.pptx2024-NATIONAL-LEARNING-CAMP-AND-OTHER.pptx
2024-NATIONAL-LEARNING-CAMP-AND-OTHER.pptx
 
How to Create and Manage Wizard in Odoo 17
How to Create and Manage Wizard in Odoo 17How to Create and Manage Wizard in Odoo 17
How to Create and Manage Wizard in Odoo 17
 
Dyslexia AI Workshop for Slideshare.pptx
Dyslexia AI Workshop for Slideshare.pptxDyslexia AI Workshop for Slideshare.pptx
Dyslexia AI Workshop for Slideshare.pptx
 
Micro-Scholarship, What it is, How can it help me.pdf
Micro-Scholarship, What it is, How can it help me.pdfMicro-Scholarship, What it is, How can it help me.pdf
Micro-Scholarship, What it is, How can it help me.pdf
 
Russian Escort Service in Delhi 11k Hotel Foreigner Russian Call Girls in Delhi
Russian Escort Service in Delhi 11k Hotel Foreigner Russian Call Girls in DelhiRussian Escort Service in Delhi 11k Hotel Foreigner Russian Call Girls in Delhi
Russian Escort Service in Delhi 11k Hotel Foreigner Russian Call Girls in Delhi
 
Unit-V; Pricing (Pharma Marketing Management).pptx
Unit-V; Pricing (Pharma Marketing Management).pptxUnit-V; Pricing (Pharma Marketing Management).pptx
Unit-V; Pricing (Pharma Marketing Management).pptx
 
Magic bus Group work1and 2 (Team 3).pptx
Magic bus Group work1and 2 (Team 3).pptxMagic bus Group work1and 2 (Team 3).pptx
Magic bus Group work1and 2 (Team 3).pptx
 

C H A P T E R9 ForecastingAs part of the planning and bu.docx

  • 1. C H A P T E R 9 Forecasting As part of the planning and budgeting processes that precede each new fiscal year, human service agencies are confronted with a series of questions: What will the agency caseload be? Will the caseload go up, go down, or remain the same? What does the revenue situation look like? Will revenues increase, stay the same, or decline? What about expenses? In light of changes in caseload and revenues, can the current pattern of expenses be maintained? Should expenses be reduced? Without some estimate of how many clients a human service agency will serve in the coming fiscal year and what the revenue and expense picture will look like, it is difficult to prepare a realistic line-item operating budget for a human service agency. There are essentially two ways human service administrators can estimate future case loads, revenues, and expenses: by educated guessing or by one or more of a variety of generally accepted forecasting techniques. As a general rule, the use of one or more generally recognized forecasting techniques is preferable to simply guessing. While an educated guess can sometimes turn out to be
  • 2. quite accurate, it is hard to defend during the budget process. Forecasting can be defined as techniques that predict the future based on his- torical data (Lee & Shim, 1990:442). One of the interesting discoveries that researchers have made about forecasting is that simple techniques perform (pro- duce estimates) that are frequently just as accurate as complex forecasting tech- niques (Cirincione, Gurrieri, & Van de Sande, 1999). Consequently, one doesn’t have to be an expert in math or statistics to use many of the commonly recognized forecasting techniques. This chapter presents four commonly recognized time series forecasting techniques: (1) simple moving averages, (2) weighted moving averages, (3) exponential smoothing, and (4) time series regression. The first three of these forecasting techniques are relatively simple and the calculations can be done by hand. Time series regression is a more complex forecasting technique that requires the use of a computer and a basic understanding of some statistical con- cepts. Today, a variety of low-cost computer programs can perform not only time series forecasting, but moving averages, weighted moving averages, exponential smoothing, and assorted other techniques that are not covered in this chapter. Before proceeding directly to the discussion of the four forecasting tech-
  • 3. niques, a few basic forecasting rules of thumb are presented. 118 Financial Management for Human Service Administrators, by Lawrence L. Martin. Copyright © 2001 by Allyn and Bacon, a Pearson Education Company. ISBN : 0-536 -12114-1 Some Basic Forecasting Rules of Thumb Several rules of thumb can be used as guides in conducting forecasts and inter- preting the results. Rule 1. Examine the data for the presence or absence of a trend. Revenues and expenses and, to a lesser extent, caseload, tend to change incrementally. Consequently, either an upward or downward trend may be present in the data. Looking at Table 9.1, an upward trend is clearly evident in the caseload data. The caseload has been trend- ing upward for the past four fiscal years. On the other hand, the donation data do not demonstrate a trend, but rather vary (increase and decrease) from year to year. In the absence of any other data or any other contextual information about the nature of the human service agency, the type of service involved, the client popu- lation, the community, the local economy, and so on, we would
  • 4. expect that the trend in the caseload data would continue for fiscal year 20X5. We are less sure about the forecast for donations because of the absence of a trend. Rule 2. The farther out the forecast, the less reliable the forecast. A forecast that looks ahead one fiscal year will generally be more reliable (more accurate) than a forecast that looks ahead three fiscal years. The reason is simple: Things change! A good example of the problem with forecasts that look too far ahead is provided by the U.S. space program. When the United States put a man on the moon in 1969, all kinds of forecasts about the future of space exploration were made based on how long it took us to reach the moon. According to many of these forecasts, we should already have a space colony on Mars. But we don’t. Why? Because things change! In the case of the space program, government funding for space exploration was cut back and our space exploration policy changed from using manned spacecraft to using unmanned spacecraft. Rule 3. Older data are less important than more recent data. Table 9.1 could include donation data for fiscal years 1999, 1998, 1997, and so on. But we know that a prob- lem in forecasting is that things change. So, the older the data included in a fore- cast, the more opportunity for things to change and, consequently, the less reliable
  • 5. the forecast is likely to be. Rule 4. The last actual value of the forecast variable is the single most important piece of information. In Table 9.1, the caseload and donation forecasts are to be made for fis- cal year 20X5; the last actual value for the caseload is 1,450 and the last actual value for donations is $25,000. In the absence of any other data, the single best predictor of the future is the last value of the forecast variable. The reason is that the last actual value is the single piece of datum that is temporarily closest to the forecast. For example, if the only datum we had in Table 9.1 was the last actual value for caseload (1,450) for fiscal year 20X4, our best forecast for 20X5 would be 1,450. The last actual Forecasting 119 Financial Management for Human Service Administrators, by Lawrence L. Martin. Copyright © 2001 by Allyn and Bacon, a Pearson Education Company. IS BN : 0 -5 36 -1 21 14
  • 6. -1 value also provides a reality check for a forecast. For any forecast, the question should be asked, Does the forecast seem reasonable given the last actual data? Rule 5. The more one knows about the data, the better one can interpret the forecast. One can forecast anything. The real gut issue is how to interpret the results of the fore- cast. In Table 9.1, any one of a number of forecasting techniques could be used to forecast the caseload for fiscal year 20X5. But the critical issue is, What are the data trying to tell us? A trend in the caseload data is clearly evident over the past four fiscal years. The caseload was 1,200 in FY 20X1 and increased 100 cases per year for fiscal year 20X2 and 20X3. But then something happened to the trend. In FY 20X4, the caseload increased by only 50. Why? What is going on? Unfortunately, we don’t know anything about the Palmdale Human Service Agency, the type of ser- vice involved, the client population, the community, the local economy, and numerous other factors that could help provide us with a context in which to inter- pret the forecast. If we had contextual information, we would be better able to understand what the data are trying to tell us and we would be better able to inter-
  • 7. pret the forecast. Something may be occurring with the agency, the service, or the community that might explain the caseload data for fiscal year 20X4 and thus help to interpret the forecast for 20X5. With this brief discussion of some forecasting rules of thumb completed, we can proceed to a discussion of our four forecasting techniques. Simple Moving Averages The forecasting technique called simple moving averages involves taking historical data on the forecast variable for a series of time periods and computing a simple arithmetic (mean) average. The forecaster must decide how many time periods of the forecast variable to include in the moving average. For example, in Table 9.1, we have historical values of the forecast variables of caseload and donations for four fiscal years. Rule 3 comes into play here: Older data are less important than more recent data. Following this guideline, we might decide to use only three years of historical data on the caseload and donations to make our forecasts. Table 9.2 takes this approach to forecasting caseload and donation data for fiscal year 20X5 using simple moving averages. 120 C H A P T E R 9 TABLE 9.1 The Palmdale Human Service Agency
  • 9. Financial Management for Human Service Administrators, by Lawrence L. Martin. Copyright © 2001 by Allyn and Bacon, a Pearson Education Company. ISBN : 0-536 -12114-1 Using simple moving averages, the caseload forecast for fiscal year 20X5 is 1,383, whereas the donations forecast is $24,667. The caseload forecast is derived by adding the caseload data for the three time periods and dividing by the num- ber of time periods. The same procedure is used to forecast donations. At this point we are reminded of Rule 1 relating to the presence or absence of a trend. We know that an upward trend exists in the caseload data, but that no trend appears to exist in the donations data. Thus, we should anticipate that the caseload fore- cast will show a continuation of the trend, whereas the donations forecast will continue to fluctuate. Our expectations are satisfied with respect to the donations forecast, but not for the caseload forecast. The donations forecast for fiscal year 20X5 is 24,667, which is less than the last actual data for fiscal year 20X4. The donations forecast continues to jump around. Our expectation is not satisfied for the caseload fore- cast. The caseload forecast for fiscal year 20X5 is 1,383, which
  • 10. is again less than the actual data for fiscal year 20X4. But we should expect, based on the observed trend in the caseload data, a forecast that is greater than the actual caseload for fiscal year 20X4. What is the problem with the simple moving averages forecast of caseload for fiscal year 20X5? Rules 3 and 4 provide some guidance. Rule 3 tells us that older data are less important than more recent data. All the data in the two simple mov- ing averages forecasts are weighted the same. Actually, no weights are used, which has the effect of treating all data as though they were weighted equally. Rule 4 sug- gests that the last actual value of the forecast variable is more important than the other data and should perhaps be given greater weight in the forecast. The point needs to be made that the moving in simple moving averages means that for fiscal year 20X6, the forecast would be comprised of the actual caseload and donations data for fiscal years 20X3, 20X4, and 20X5. The actual caseload and donations data for 20X5 would be added to the moving averages and the caseload and donations data for 20X2 would be deleted. This process keeps the simple mov- ing average’s base of three fiscal years. Forecasting 121
  • 11. TABLE 9.2 Palmdale Human Service Agency Caseload and Donations Forecasts Using Simple Moving Averages Fiscal Year 20X2 20X3 20X4 20X2–X4 20X5 Caseload 1,300 1,400 1,450 4,150 4,150 = 1,383 3 Donations $22,000
  • 12. 27,000 25,000 74,000 74,000 = $24,667 3 Financial Management for Human Service Administrators, by Lawrence L. Martin. Copyright © 2001 by Allyn and Bacon, a Pearson Education Company. IS BN : 0 -5 36 -1 21 14 -1 Weighted Moving Averages The second of our four forecasting techniques, weighted moving averages, attempts to improve on simple moving averages by assigning weights to
  • 13. the data that com- prise the forecast. In keeping with Rules 3 and 4, the idea is to place more weight on the last actual value of the forecast variable and decreasing weights on the older data. For example, a common practice in weighted moving averages is to assign a weight of “1” to the oldest datum to be used in the forecast and then assign increas- ing weights to more recent data so that the last actual value receives the greatest weight. Following this approach, Table 9.3 shows the results of a weighted moving average forecast for caseload and donations for fiscal year 20X5. Using weighted moving averages, the caseload forecast for fiscal year 20X5 is 1,408 and the donations forecast is $25,167. The caseload forecast is arrived at by multiplying the caseload data for each year by its weight, adding the results together, and dividing by the total number of weights. The forecast for donations is obtained using the same approach. The caseload forecast of 1,408 appears more realistic than the simple moving averages forecast of 1,383, but it is still less than the last actual caseload data of 1,450 for fiscal year 20X4. Again, we are confronted with the problem that we cannot put a lot of confidence in a forecast of 1,408 unless we have some contextual information that explains why we should accept a case- load forecast that does not demonstrate a continuation of the identified trend. The
  • 14. 122 C H A P T E R 9 TABLE 9.3 Palmdale Human Service Agency Forecasts Using Weighted Moving Averages Caseload Fiscal Year 20X2 20X3 20X4 20X5 Caseload 1,300 1,400 1,450 8,450/6 = 1,408 Weight 1 2 3
  • 16. 1 2 3 6 Weighted Score $ 22,000 54,000 75,000 151,000 Financial Management for Human Service Administrators, by Lawrence L. Martin. Copyright © 2001 by Allyn and Bacon, a Pearson Education Company. ISBN : 0-536 -12114-1 donations forecast of $25,167 appears reasonable given the historical way in which donations have tended to fluctuate. Exponential Smoothing In order to perform a forecast using either simple moving averages or weighted
  • 17. moving averages, the forecaster must collect and save data for several historical time periods. Exponential smoothing is a forecasting technique that requires only two pieces of information: (a) the last actual value of the forecast variable and (b) the last actual forecast. With these two pieces of information and the use of a simple formula, we can forecast caseload, revenues, expenses, or any other vari- able. One might say that exponential smoothing takes to heart Rule 4 that the last actual value of the forecast variable is the single most important piece of informa- tion. The forecasting formula used in exponential smoothing is NF = LF + α (LD – LF) where NF = New forecast LF = Last forecast α = 0 to 1 LD = Last data The formula is relatively straightforward with the exception of the alpha (α). Alpha is a value between 1 and 0 that is selected by the forecaster. The alpha deter- mines how much weight in the new forecast will be placed on the last data (the last value of the forecast variable) and, conversely, how much weight will be placed on the last forecast. An alpha of 1 means that 100 percent of the new forecast will be based on the last data and 0 per cent on the last forecast. An exponential smooth- ing forecast using an alpha of 1 would result in a number that would be exactly the same as the last actual value of the forecast variable. An alpha
  • 18. of zero means that 0 percent of the new forecast will be based on the last data and 100 percent on the last forecast. An exponential smoothing forecast using an alpha of 0 would result in a number that is exactly the same as the last forecast. An alpha of .5 means that 50 percent of the new forecast will be based on the last actual data and 50 percent on the last forecast. When using exponential smoothing, the alpha selected is determined by the accuracy of the last forecast. For example, if the caseload forecast for fiscal year 20X4 was 1,700 and the actual caseload was 1,450, then the forecast was not very accurate. In such a situation, the forecaster would want to select for the next fore- cast (fiscal year 20X5) a high alpha (.7 to .9) that places more weight on the last data and less weight on the last forecast. If, however, the caseload forecast for fis- cal year 20X4 was 1,460 and the actual caseload for fiscal year 20X4 was 1,450, then the forecast was quite accurate. In such a situation, the forecaster would want to select for the next forecast (fiscal year 20X5) a low alpha (.2 to .3) that places more weight on the last forecast and less weight on the last data. A small alpha (.2 to .4) has the same effect as if data for several time periods were included Forecasting 123
  • 19. Financial Management for Human Service Administrators, by Lawrence L. Martin. Copyright © 2001 by Allyn and Bacon, a Pearson Education Company. IS BN : 0 -5 36 -1 21 14 -1 in the forecast. In other words, a small alpha “smooths” the forecast, hence the name exponential smoothing. Let’s assume that the caseload forecast for fiscal year 20X4 was 1,500 and that the donations forecast was $26,000. We know that the actual caseload and dona- tions data for fiscal year 20X4 were, respectively, 1,450 and $25,000. Because the caseload forecast was quite accurate, we will select an alpha of .2 for use in our forecast of caseload for 20X5. Because the forecast for donations was somewhat less accurate, we will select a higher alpha (.5) that will place equal emphasis on
  • 20. both the last forecast and the last data. This information can now be entered into the exponential smoothing formula (Table 9.4) and a fiscal year 20X5 forecast can be made for both caseload and donations. The exponential smoothing caseload forecast is 1,490 for 20X5. This forecast appears to be realistic because the upward trend evidenced over the last four fiscal years is continued and because the new forecast is greater than the actual caseload data of 1,450 for fiscal year 20X4. Similarly, the exponential smoothing forecast for donations of $25,500 for fiscal year 20X5 appears reasonable, but we are less sure of this forecast because of the tendency of the donations data to fluctuate. Time Series Regression Time series regression is the last of the four generally recognized forecasting tech- niques to be discussed in this chapter and the only one that requires the use of a computer. Time series regression is more sophisticated than the other forecasting 124 C H A P T E R 9 TABLE 9.4 Palmdale Human Service Agency Caseload and Donations Forecasts Using Exponential Smoothing Caseload
  • 21. NF = LF + α(LD – LF) = 1,500 + .2(1,450 – 1,500) = 1,500 + .2(–50) = 1,500 + (–10) = 1,490 Donations NF = LF + α (LD – LF) = $26,000 + .5($25,000 – $26,000) = $26,000 + .5(–$1,000) = $26,000 + (–$500) = $25,500 Financial Management for Human Service Administrators, by Lawrence L. Martin. Copyright © 2001 by Allyn and Bacon, a Pearson Education Company. ISBN : 0-536 -12114-1 techniques considered, but it also more powerful and provides more insights into the data and the forecast. Time series regression forecasting also yields an estimate of how much confidence one should have in the forecast. These features make it one of the most commonly used forecasting techniques (Forester, 1993). Time series regression forecasting can be performed using any computer software package that contains a simple linear regression program.
  • 22. Time series regression is an application of what is called the ordinary least squares regression model. Time series regression forecasting attempts to find a linear relationship between time (the independent variable) and the forecast vari- able (the dependent variable). A linear relationship can be thought of as a trend. In other words, time series regression analyzes the data looking for a trend. The time series regression model looks for (a) a positive linear relationship (or trend) between time and the forecast variable, (b) a negative linear relationship (or trend) between time and the value of the forecast variable, or (c) no linear rela- tionship (or trend). A positive linear relationship (or trend) means that over time the values of the forecast variable are increasing. A negative linear relationship (or trend) means that over time the values of the forecast variable are decreasing. If the time series regression model finds a moderate to strong positive or negative linear relationship (or trend), the computer output can be used to make a forecast using the formula Y = A + BX where Y is the forecast (an unknown quantity) A is the base or constant B is the unit value change in the forecast variable X is the increment of time to be forecasted The use of an example should help make the discussion of time series regres- sion forecasting more understandable. Table 9.5 demonstrates
  • 23. how time series regression can be used to conduct a caseload forecast using the caseload data we have used in the other forecasts. In conducting a caseload forecast using time series regression, we are going to use all four years of available caseload data. Using older data here does not violate Rule 3, because (a) a time series regression forecast needs at least four (some would say five) data points to function properly and (b) the analysis is able to differentiate between changes attributable to time (the trend) and changes attributable to other factors. The first part of Table 9.5 shows how the data for a time series regression fore- cast are entered into a computer program. Time is always treated as the indepen- dent variable (IV), whereas the forecast variable (e.g., caseload or donations) is always treated as the dependent variable (DV). When the data are inputted into the computer program, it is important not to reverse these variables. Time must always be the independent variable or the computer output will be meaningless. When inputting data into a time series regression, the time periods are trans- formed into consecutive numbers. For example, we have four years of caseload data (the time period) so fiscal year 20X1 = 1, 20X2 = 2, 20X3 = 3, and 20X4 = 4. The oldest time period is always designated 1. Forecasting 125
  • 24. Financial Management for Human Service Administrators, by Lawrence L. Martin. Copyright © 2001 by Allyn and Bacon, a Pearson Education Company. IS BN : 0 -5 36 -1 21 14 -1 The second part of Table 9.5 shows the resulting computer output, specifi- cally the “coefficients” and the “model summary” sections. Computer programs such as Statistical Packages for the Social Sciences (SPSS) provide a lot of output that is not essential to the purposes of conducting and interpreting the results of a time series regression forecast. For forecasting purposes, one needs to know the value of R-square, the value of A (the constant), and the value of B (Var1). In SPSS, the value of R-square is usually found as part of the model summary output, while values of the A (constant) and the B (Var1) are usually found as
  • 25. part of the coeffi- cients output. The R-square tells us how much confidence we should have in the forecast. R-square can vary between 0 and 1. R-square can also be thought of as a measure of the strength of a trend (either positive or negative) in the values of the forecast variable over time. If the R-square is greater than .7, a strong trend exists. An R- square between .5 and .7 indicates a moderate trend; R-square less than .5 indicates a weak trend. Looking at the model summary portion of the computer output (Table 9.5), we can see that the R-square for the time series regression is .980, which is significantly greater than .7. In terms of interpretation, we can say that we can 126 C H A P T E R 9 TABLE 9.5 Caseload Forecast Using Time Series Regression Computer Input Time Caseload (IV) (DV) 1 1,200 2 1,300 3 1,400 4 1,450 Computer Output
  • 26. Coefficients Model Constant Var 1 Unstandardized Coefficients B 1125 85 Std. Error 23.717 8.660 BETA .990 t 47.434 9.815 Sig. .000 .010 Model Summary
  • 27. Model 1 R .990 R-Square .980 Adjusted R-Square .969 Standard Error of the Estimate 19.3649 Standardized Coefficients Financial Management for Human Service Administrators, by Lawrence L. Martin. Copyright © 2001 by Allyn and Bacon, a Pearson Education Company. ISBN : 0-536 -12114-1 have a high degree of confidence in the result of a time series regression forecast. Another interpretation is that the time series regression analysis
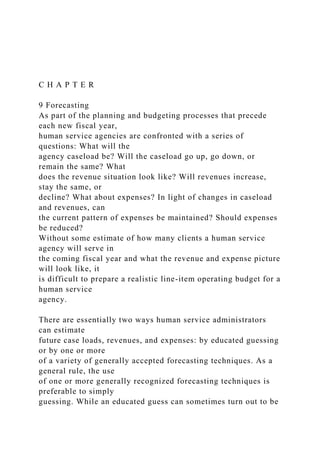
  • 28. has found a strong trend in the caseload data. This strong trend can be used for forecasting purposes. In order to perform a time series regression forecast, we must substitute the relevant values into the formula Y = A + BX (Table 9.6). To the base value of A (a constant), we add B (Var1) multiplied by X (the time period to be forecasted). Since we are using four years of caseload data in the time series regression and we are performing a forecast for the next fiscal year, X = 5. The result is a caseload forecast of 1,550. This caseload forecast looks good because it is a continuation of the observed trend in the caseload data and because it is greater than the last actual caseload data for fiscal year 20X4. Why does the time series caseload forecast perform so much better than the other forecasting techniques? The answer is that time series regression is particu- larly sensitive to, and performs best, when a strong trend is present. The three other forecasting techniques discussed in this chapter are not as sensitive to trends. At this point it is probably advisable to pause for a moment and explain exactly what the values of the A (constant) and the B (Var1 or variable 1) mean in a time series regression. When conducting a time series regression, many computer programs provide for the optional generation of a graph of the
  • 29. linear relationship between time and the forecast variable. Figure 9.1 is such a graph. The indepen- dent variable (time) is shown on the x-axis and the dependent variable (caseload) is shown on the y-axis. In the middle of the graph are four data points. The first data point represents the caseload data (1,200) for fiscal year 20X1 (year 1). The sec- ond data point represents the caseload data (1,300) for fiscal year 20X2 (year 2). The third data point represents the caseload data (1,400) for fiscal year 20X3 (year 3). And finally, the fourth data point represents the caseload data (1,450) for 20X4 (year 4). The line in the center of the graph is the regression line. The regression line can be thought of as “the best line” that expresses the linear relationship (the trend) between time and the forecast variable. The line begins at 1,125. This point is called A (constant) because it is the fixed point at which the regression line begins. This point is also called the y-intercept because it is the point at which the regression line crosses the y-axis. The slope of the regression line then goes up 85 (B or Var1) for each time period (year). In performing the actual time series regression forecast, the regression line is simply extended out to the time period being forecasted. In Forecasting 127
  • 30. TABLE 9.6 Caseload Forecast Using Time Series Regression Y = A + BX = 1125 + 85(5) = 1125 + 425 = 1550 Financial Management for Human Service Administrators, by Lawrence L. Martin. Copyright © 2001 by Allyn and Bacon, a Pearson Education Company. IS BN : 0 -5 36 -1 21 14 -1 this example, caseload is being forecasted for the fifth year. The mathematics of the forecast are simply to begin with the value of A (constant) and then to add the value of B (Var1) for each time period (year) up to the forecast time period (year): 1,125 + 85 (year 1) + 85 (year 2) + 85 (year 3) + 85 (year 4) +
  • 31. 85 (year 5) = 1,550 Now let’s do a time series regression forecast for donations. The top portion of Table 9.7 shows how the data are entered into the computer program; the lower por- tion shows the computer output. In the “coefficients” section of the output, we see that the value of A (constant) is 23,500 and the value of B (Var1) is 500. In the model summary section, we see that the R-square is .098. The R- square is extremely low, which means that we can have little confidence in any forecast made using time series regression. Another way of interpreting the low R-Square is that the com- puter could not find a trend in the data. Knowing that we can have no confidence in the results, let’s go ahead anyway and do a time series regression forecast using the formula Y = A + BX (see Table 9.8) The resulting forecast for donations is $27,000 in fiscal year 20X5, but we know that we can have absolutely no confidence in this forecast. The two time series regression forecasts for caseload and for donations demonstrate the strengths and limitations of this forecasting technique. Time series regression forecasting works well when a strong (R-square = .7 or greater) trend exists, works less well when a moderate (R-square = .4 to .7) trend exist, and does not work well at all when a weak (R-square = less than .4) exists.
  • 32. 128 C H A P T E R 9 FIGURE 9.1 Graph of Time and Caseload with Regression Line 1600 1500 1400 1300 1200 1100 1000 1 2 3 4 5 x -axis y -a xi s Financial Management for Human Service Administrators, by Lawrence L. Martin. Copyright © 2001 by Allyn and Bacon, a Pearson Education Company. ISBN : 0-536 -12114-1
  • 33. When to Use Which Forecasting Technique The preceding discussion of the four generally recognized forecasting techniques (in particular, the discussion of time series regression) allows three more rules of thumb to be offered: Rule 6. When a strong trend (R-square = .7 or greater) is present in the data, use time series regression. Forecasting 129 TABLE 9.7 Donations Using Time Series Regression Computer Input Time Caseload (IV) (DV) 1 $25,000 2 22,000 3 27,000 4 25,000 Computer Output Coefficients Model Constant Var 1
  • 35. .313 R-Square .098 Adjusted R-Square –.353 Standard Error of the Estimate 2397.9165 Standardized Coefficients TABLE 9.8 Donations Using Time Series Regression Y = A + BX = $23,500 + $500(5) = $23,500 + $2,500 = $27,000 Financial Management for Human Service Administrators, by Lawrence L. Martin. Copyright © 2001 by Allyn and Bacon, a Pearson Education Company. IS BN : 0 -5
  • 36. 36 -1 21 14 -1 Rule 7. When a moderate trend (R-square = .4 to .7) is present in the data, use moving averages or weighted moving averages. Rule 8. When a weak trend (R-square = less than .4) or no trend is present in the data, use exponential smoothing with the choice of alpha dependent upon the accuracy of the last forecast. Following Rule 6, for any given forecast, a forecaster should first use time series regression and determine if a trend is present in the data and the strength of any such trend. Summary This chapter presented four generally recognized forecasting techniques: (1) sim- ple moving averages, (2) weighted moving averages, (3) exponential smoothing, and (4) time series regression. The advantages and disadvantages of each forecast- ing technique were identified and several rules of thumb were provided to guide
  • 37. human services administrators in the selection of the most appropriate forecasting technique and in interpreting the results of forecasts. E X E R C I S E S Exercise 9.1 The following data represent total personnel expenses for the Palmdale Human Service Agency for past four fiscal years: 20X1 $5,250,000 20X2 $5,500,000 20X3 $6,000,000 20X4 $6,750,000 Forecast personnel expenses for fiscal year 20X5 using moving averages, weighted moving averages, exponential smoothing, and time series regression. For moving averages and weighted moving averages, use only the data for the past three fiscal years. For weighted moving averages, assign a value of 1 to the data for 20X2, a value of 2 to the data for 20X3, and a value of 3 to the data for 20X4. For exponen- tial smoothing, assume that the last forecast for fiscal year 20X4 was $6,300,000. You decide on the alpha to be used for exponential smoothing. For time series regression, use the data for all four fiscal years. Which forecast will you use? Why? 130 C H A P T E R 9
  • 38. Financial Management for Human Service Administrators, by Lawrence L. Martin. Copyright © 2001 by Allyn and Bacon, a Pearson Education Company. ISBN : 0-536 -12114-1 Exercise 9.2 The following data represent total “person trips” (service outputs or units of ser- vice) provided by the Palmdale Human Service Agency’s specialized transporta- tion program for the past four fiscal years: 20X1 12,000 20X2 15,000 20X3 13,500 20X4 14,250 Forecast person trips for fiscal year 20X5 using moving averages, weighted mov- ing averages, exponential smoothing, and time series regression. For moving aver- ages and weighted moving averages, use only the data for the past three fiscal years. For weighted moving averages, assign a value of 1 to the data for 20X2, a value of 2 to the data for 20X3, and a value of 3 to the data for 20X4. For exponen- tial smoothing, assume that the last forecast for fiscal year 20X4 was 15,000. You decide on the alpha to be used for exponential smoothing. For time series regres-
  • 39. sion, use the data for all four fiscal years. Which forecast will you use? Why? Exercise 9.3 The following data represent total revenues (from all sources) for the Palmdale Human Service Agency for the past four fiscal years: 20X1 $15,000,000 20X2 $14,250,000 20X3 $14,000,000 20X4 $13,500,000 Forecast total revenues for fiscal year 20X5 using moving averages, weighted mov- ing averages, exponential smoothing, and time series regression. For moving aver- ages and weighted moving averages, use only the data for the past three fiscal years. For weighted moving averages, assign a value of 1 to the data for 20X2, a value of 2 to the data for 20X3, and a value of 3 to the data for 20X4. For exponen- tial smoothing, assume that the last forecast for fiscal year 20X4 was $13,000,000. You decide on the alpha to be used for exponential smoothing. For time series regression, use the data for all four fiscal years. Which forecast will you use? Why? Forecasting 131 Financial Management for Human Service Administrators, by Lawrence L. Martin. Copyright © 2001 by Allyn and Bacon, a Pearson Education Company.