
Recommended
Recommended
More Related Content
What's hot
What's hot (19)
Similar to Monthly abr20 credit qi
Similar to Monthly abr20 credit qi (20)
Recently uploaded
Recently uploaded (20)
Monthly abr20 credit qi
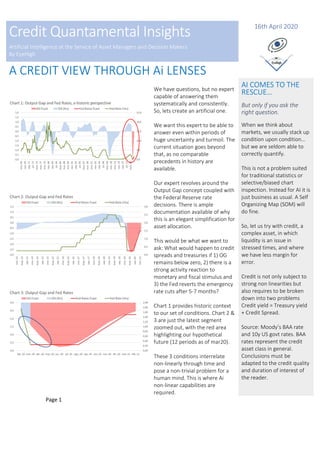
- 1. Page 1 Credit Quantamental Insights Artificial Intelligence at the Service of Asset Managers and Decision Makers By EyeHigh 16th April 2020 A CREDIT VIEW THROUGH Ai LENSES We have questions, but no expert capable of answering them systematically and consistently. So, lets create an artificial one. We want this expert to be able to answer even within periods of huge uncertainty and turmoil. The current situation goes beyond that, as no comparable precedents in history are available. Our expert revolves around the Output Gap concept coupled with the Federal Reserve rate decisions. There is ample documentation available of why this is an elegant simplification for asset allocation. This would be what we want to ask: What would happen to credit spreads and treasuries if 1) OG remains below zero, 2) there is a strong activity reaction to monetary and fiscal stimulus and 3) the Fed reverts the emergency rate cuts after 5-7 months? Chart 1 provides historic context to our set of conditions. Chart 2 & 3 are just the latest segment zoomed out, with the red area highlighting our hypothetical future (12 periods as of mar20). These 3 conditions interrelate non-linearly through time and pose a non-trivial problem for a human mind. This is where Ai non-linear capabilities are required. AI COMES TO THE RESCUE… But only if you ask the right question. When we think about markets, we usually stack up condition upon condition… but we are seldom able to correctly quantify. This is not a problem suited for traditional statistics or selective/biased chart inspection. Instead for AI it is just business as usual. A Self Organizing Map (SOM) will do fine. So, let us try with credit, a complex asset, in which liquidity is an issue in stressed times, and where we have less margin for error. Credit is not only subject to strong non linearities but also requires to be broken down into two problems Credit yield = Treasury yield + Credit Spread. Source: Moody’s BAA rate and 10y US govt rates. BAA rates represent the credit asset class in general. Conclusions must be adapted to the credit quality and duration of interest of the reader.
- 2. Page 2 Credit Quantamental Insights Artificial Intelligence at the Service of Asset Managers and Decision Makers By EyeHigh A CREDIT VIEW THROUGH Ai LENSES Chart 4 shows our takeaways after asking the algorithm for that specific sequence of events: 1) The initial spread widening and Treasury yield compression tends to revert after the initial shock. Still there is a diminishing but positive upside risk to spreads while the economy is still deteriorating (period 3 corresponds to jun20 in Chart 3). 2) Through periods 4 to 6 growth is above potential (OG less negative) and spreads improve, a typical recovery pattern. 3) The Fed starts raising rates in period 7, acknowledging the recovery is in place. At that point the long end of the Treasury curve is subject to an additional source of upward risk. Here, spreads and yields move in opposite directions for a while. 4) Since governments are in desperate need to issue debt to pay for the fiscal packages, yields upside risk ought to be in fact much higher. The algorithm has no knowledge whatsoever of this, and therefore it is important to mention it. Chart 5 answers our final question. Taking as much macro information as possible, do underlying macro forces pressure credit spreads up or down for the next 3-4 months? For the time being the algorithm, in a totally aseptic fashion, tells us that credit spreads are subject to an upwards though moderating risk. MACRO SCENARIO Our macro scenario purports an economic impact like the one that took place during the 2008 crisis. This implies that the OG contraction reaches almost the same depth (negative OG). In turn, it recovers a lot faster provided the unprecedented size of the monetary and fiscal packages. Both assumptions might be wrong, but what we want is to set the playfield for our thinking. Fed rate increases follow the usual pattern when a recovery takes place. At some point “emergency cuts” must be reversed. A FINAL QUESTION In a last-ditch effort, we asked the algorithm a final question: Are macro factors pressuring up or down credit spreads for the next few months? Notice that answering this requires tens of indicators in a time series fashion. The question when correctly posed can be interpreted as an underlying force or risk. Chart 5: BAA Spread
- 3. DISCLAIMER: This document does not constitute an offer or a solicitation to engage in any trading strategy or to purchase or sell any financial instruments. Given its general nature, the information included in this document does not contain all the elements that may be relevant for a recipient to make an informed decision in relation to any strategies or financial instruments discussed herein. The information and opinions contained in this document have been obtained from sources believed to be reliable, but we make no representation, express or implied, that such information and opinions are accurate or complete. Other financial institutions or persons may have different opinions or draw different conclusions from the same facts or ideas analyzed in this document. Any scenarios, assumptions, historical or simulated performances, indicative prices or examples of potential transactions or returns are included for illustrative purposes only, and we give no assurance that any favorable scenarios described are likely to happen, nor that it is possible to trade on the terms described herein or that any of the potential returns illustrated can be achieved. We have used historical information in order to provide an illustration of how certain parameters may have performed over a defined period. This document also contains certain performance data based on back-testing, i.e., calculations of the hypothetical performance of a strategy, index or asset as if it had actually existed during a defined period of time and may in certain circumstances contain simulated performance information where the index or asset described has recently been established or issued. The scenarios, simulations, development expectations and forecasts contained in this document are for illustrative purposes only. This type of information has inherent limitations which you must consider carefully. While the information has been prepared in good faith in accordance with our own internal models and other relevant sources, an analysis based on different models or assumptions may yield different results. Therefore, this analysis may vary significantly from an analysis obtained from other sources or market participants. Further, please note that such analysis is based on a number of working assumptions that may not be capable of duplication in actual trading terms. Unlike actual performance records, hypothetical or simulated performances, returns or scenarios may not necessarily reflect certain market factors such as liquidity constraints, fees and transaction costs. Actual historical or backtested past performance does not constitute an indication of future results. In providing this document, we give no financial, legal, tax or any other type of advice to recipients. Certain strategies and/or potential transactions discussed in this document involve the use of derivatives, which may be complex in nature and may give rise to substantial risk, including the risk of partial or total loss of any investment. We make no representation as to whether any of the strategies discussed herein may be suitable for investors’ financial needs, circumstances or requirements. Investors must make their own assessment of the strategies and/or potential transactions, using such professional advisors as they make require. We accept no liability for any direct or consequential losses arising from any action taken in connection with the information contained in this document.