GIS Expo 2014: Nearshore Depth Derivation Using World View-2 Multispectral Satellite Imagery
•Download as PPTX, PDF•
1 like•1,239 views

Presentation by Julia Ehses, NOAA Coral Reef Ecosystems Division

Recommended
Recommended
More Related Content
What's hot
What's hot (7)
Viewers also liked
Viewers also liked (9)
Similar to GIS Expo 2014: Nearshore Depth Derivation Using World View-2 Multispectral Satellite Imagery
Similar to GIS Expo 2014: Nearshore Depth Derivation Using World View-2 Multispectral Satellite Imagery (20)
More from Hawaii Geographic Information Coordinating Council
More from Hawaii Geographic Information Coordinating Council (20)
GIS Expo 2014: Nearshore Depth Derivation Using World View-2 Multispectral Satellite Imagery
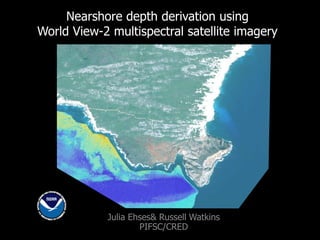
- 1. Nearshore depth derivation using World View-2 multispectral satellite imagery Julia Ehses& Russell Watkins PIFSC/CRED
- 5. Image Preprocessing – Three steps are performed before deriving depths. Step 1 Data conversion - Digital number values are converted to top‐of‐atmosphere radiance/reflectance. Step 2 Masking - Non-aquatic and terrestrial areas including clouds, turbidity, breaking surf, and boats are removed from the image by creating an ocean mask. Step 3 Sea Surface corrections - Correction of sun glint in visible bands.
- 6. Depth Derivation Method 1. Lyzenga's multiple linear regression analysis 2. Stumpf’s ratio method
- 11. Final Products are available for download at: http://www.soest.hawaii.edu/pibhmc/pibhmc_mapping.htm Products
- 12. Conclusions •WV-2 multispectral satellite imagery can be used to derive depths in water shallower than 20m. • Best results are obtained over steep slopes and homogenous hard bottom. • Shallow sandy substrate can lead to false depth values and reversed topography. • Site-specific method modification is often required. • Results are highly dependant upon the availability of quality ground control data and satellite imagery.
- 17. The 8 spectral bands of WorldView-2
Editor's Notes
- One of our projects right now is deriving depth using WV-2 multispectral satellite imagery.The background image shows such a satellite image and also derived depth around South NiihauFirst I want to give you some background information.
- Our main study area is the US Pacific Island Region. Over the last 14 years we did very intensive multibeam bathymetry data collections in these areas. Unfortunately data collections in the 0 to 20m depth range is very difficult, because ships can’t collect data so close to shore.
- Therefore we have data gaps (in black) between the multibeam data and shorelineWe are very interested in filling these gaps, because it will give us important information to help us understand the coral reef environment.There are two ways of filling the gaps. One way is with LiDAR data collection. Unfortunately this is very expensive and sometimes just simply impossible due to the remote locations of our study sites.The other way of filling data gaps is to derive depth using satellite imagery.This is not a very new idea and has been done many times, but usually only for small areas. Our attempts are very unique, because our study site is very large.
- First we wanted to test known methods. Therefore we choose a study area where we have “ideal” conditions. What that means is that we have a good satellite image and sufficient ground control data. Here we use LiDAR data as our ground control points.The LiDAR data are shown in pink/purple. We need those to calculate depth and create a depth model, but we also need ground control data for depth model validation to figure out if our model is successful and our derived depth data correct. I want to give you a very brief summary of the whole process.
- First we need preprocess the imagery, before depth can be calculated.The first step is to convert the raw image data from DN to TOA radiance and or reflectance depending on what is needed.The second step is to create an ocean mask, where all the non-aquatic features are cut out like land, clouds, boats, but also breaking surf and turbidity to avoid errors in the calculationsThe third step is the sea surface corrections. Here we remove sun glint from the entire image.
- There two main methods that are often used. Both relay on fundamental concept that the spectral signature of satellite imageries respond linear to depth.We tried both and had generally more success with the Lyzenga method.I’m not going into more detail and want to focus more on the results today. However, if anybody is interested in more detailed information about the whole process and method I’m happy to walk you through the whole process.
- Here we see LiDAR bathymetry on the first tile. A 5 m resolution grid. You can easily see that the Lyzenga method does a really nice job in recovering the seafloor morphologies very nicely, whereas the Stumpf method doesn’t pick up most of the features.
- Here we are looking at the error which is defined as the absolute difference between LiDAR depth and the derived depth using the Lyzenga method.The darker green colors show a small error from less than 1 m to 1 to 2m the lighter the green the greater the error. Interestingly you can see how the 20m depth contour follows very closely around to where the error increasing to >5m.This seems to be consistent across most study sites, therefore we generally decided to cut of our derived depth data at 20m.
- The x axis shows LiDAR depth and the Y axis shows estimated depth.The purple line shows the ideal situation of a perfect fit.Green points show the actual data.The doted line shows the best fit of the estimated depth.You can see how the Lyzenga method was very successful in our first study site and the Stumpf method does not work well here.We don’t’ want to generally say that these methods will always behave the same. One method might work best here, but in a different situation the Stumpf method may lead to better results.
- Here I want to share another example of a derived depth product we created.The special situation here is that we had very limited resources for ground control data. We ended up using depth data collected during dive surveys. Despite the limited resources we got reasonable results. But in this example I want to especially highlight one very common problem, that many other authors came across as well. The upper tiles show the WV-2 image. The bottom tiles the derived depth outputs.You can see how in tile A the very reflective shallow sandy bottom results in a reversed topography. The sandy bottom appears shallower than it should be.This problem doesn’t occur anymore in the deeper sandy sections like you can see in tile B and C.
- On the website of the pacific benthic habitat mapping center you can find all available productsSo far we only have very few WV-2 derived products. Swains Island in the PRIAs, Rota in the CNMI, Niihau Island and portions of the Big Island.But we do also have several depth products derived from Ikonos imagery.
- Here I want to summarize the most important results and challenges.We can successfully derive depth to a depth of 20m.Best results are obtained over steep slopes and homogenous hard bottomSite specific method modification is often required.Most important to note is that the quality of your final result is always depended on the quality of the image as well as on the quality of the ground control data.Your derived depth model will only be as accurate as your initial ground control data. This is important to keep in mind depending on what you want to use the derived depth for.We don’t only work in the Pacific Island Regions we are also applying this work to the Coral Triangle Region, more specifically around Timor Leste. Here I want to show you a few examples of imagery that we purchased and things we pay attention to in that process to avoid some of the challenges related to the image quality
- Really good image, no clouds not haze very limited glint. Looks good over land and ocean.
- Also very good image, some glint. Difficult to derive depth here regardless because of a lot of shallow sandy bottom.
- Here is one example of which we come across quite often in the archived imagery. Images with high turbidity.Something that Digital Globe will not scan for and certainly will not allow us to derive any depths from imagery like that.
- If you are interested in more detail write us an email.