Download to read offline


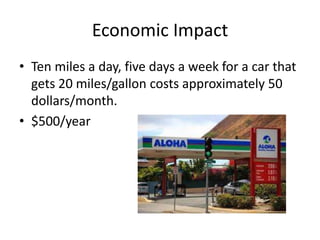
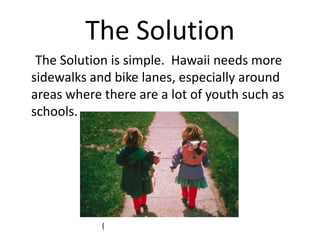


The document discusses the need for more sidewalks and bike lanes in Hawaii. It notes that currently there are few sidewalks and bike lanes, forcing many to drive even for short trips. This has environmental impacts from increased emissions and economic impacts from higher fuel costs. Having more walking and biking infrastructure would encourage active transportation, reducing costs while improving health and the environment. The solution proposed is to build more sidewalks and bike lanes, especially around schools, to create a more sustainable transportation system.


