Downloaded 476 times

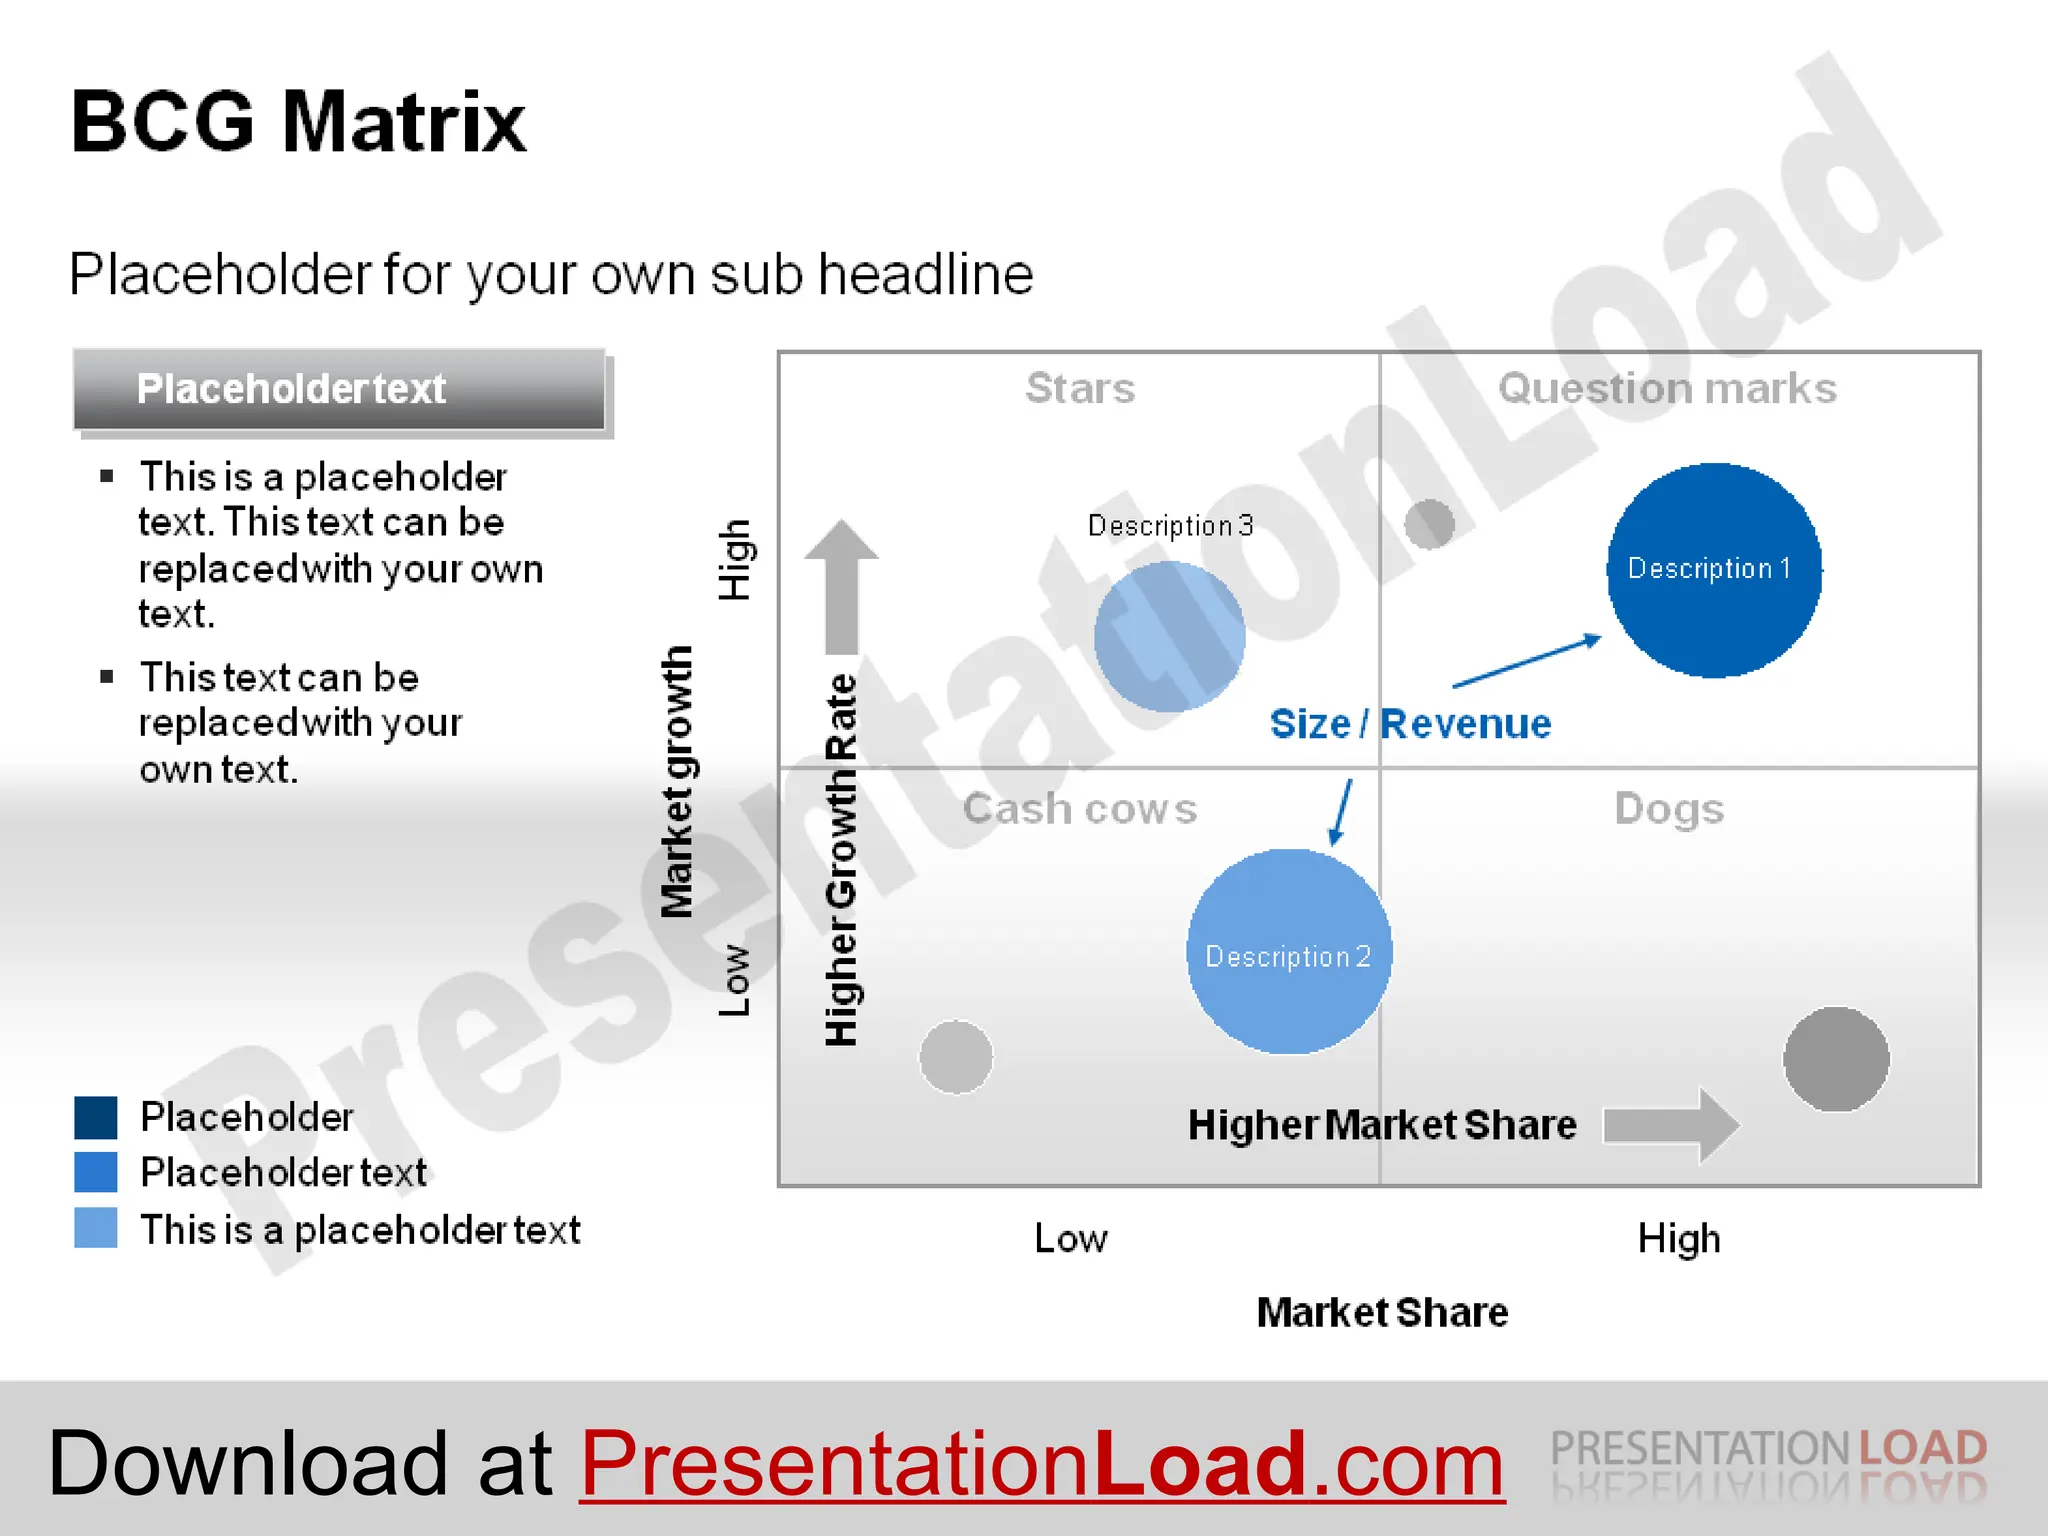
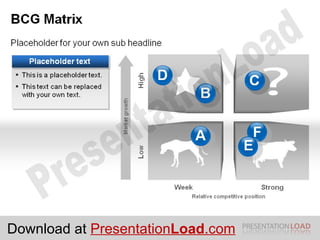
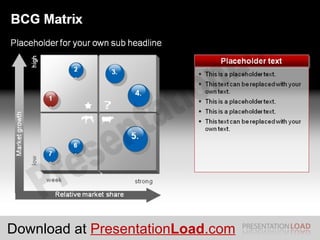
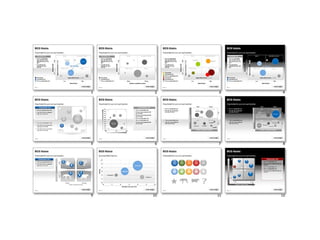
With the PowerPoint BCG-Matrix, also known as "Boston-I-Portfolio" you can easily display your companies´ strategic management. This matrix was developed to review the coherence between the product lifecycle and the cost experience curve. Products of a company will be separated in four areas (Question Marks, Stars, Cash Cows und Poor Dogs). Out of these conclusions you can transfer recommendations for further proceeding. http://www.presentationload.de/en/powerpoint-charts-diagrams/BCG-Matrix-Charts.html?campaign=sharingplatforms/slideshare


