SlideShare a Scribd company logo
1 of 3
Download to read offline
Souce:                                                                                                                     PERU                                                                                                                        December 31, 2000
The Peruvian Bank Insurance Superintendency                                                                                                                                                                                                                     US $000
                                                                                                                  COMMERCIAL BANKING SYSTEM


        BALANCE SHEET                           CONTNT           INTBNK       CRDTO        WIESE        SUDAM       CITIBANK     STDCHT       BOSTON     BNP       BSCH         COMER       BIF       FINAN      LATINO      NBK        NVOMDO      TOTAL

        QUICK ASSETS                                1,113,976     173,200     1,553,780      350,388    118,362      236,990      50,060       52,524    12,893     275,105      38,719     41,582     24,101     90,348      48,986      93,695     4,274,710
        Cash & Legal Reserves                         107,844      56,161       145,888       87,858      6,394       18,415       2,414        7,439        16      34,168       5,836      4,743      6,408      8,293       8,911       6,580       507,370
        Due from Banks-Demand                         795,943      99,813     1,200,500      639,768     87,328      183,353      28,315       36,369    11,119     194,581      25,826     33,907     15,361     25,942      23,628      69,086     3,470,840
        Clearance                                      22,887       9,489        43,558       22,672      4,528       14,944       2,063        1,878       754      18,187       1,464      2,932        183      2,704       1,656       4,368       154,267
        Marketable Securities S/T                     187,302       7,737       163,835     (399,910)    20,112       20,278      17,268        6,837     1,003      28,169       5,593          -      2,149     53,409      14,790      13,661       142,232

        LOANS                                       1,521,513     754,854     2,533,644    2,061,683    447,578      458,911      85,366      179,849    12,567     858,709     168,808    241,923    181,009    230,155     353,324     464,747    10,554,638
        Call Loans to Domestic Banks                   47,459           -         3,151            -      6,274        4,000      10,814       10,227         -         852       2,273      2,301      1,136        991           -           -        89,478
        Overdrafts                                     35,898      31,819       152,505      190,567     35,371       68,713       1,051          521       791      23,155      21,563     19,544      6,043     30,241      14,454      28,847       661,083
        Bills & Discounts + Loans                   1,100,973     550,376     1,887,108    1,615,464    257,837      334,552      65,874      119,920     7,684     200,891      97,506    126,692     80,717     55,664     173,645     189,142     6,864,046
        Mortgage Financing                            144,939      37,273       185,415       71,727     66,789       32,812           -       18,876         -     204,364           -     28,512      2,522      6,976      14,556      20,590       835,352
        Other & LT Loans + Leasing                    112,766      53,084       144,051       83,525     62,645       15,137       6,409       31,067     4,226     302,868      29,838     46,823     72,614     29,719     108,244     189,764     1,292,780
        Refinanced Credits                             90,787       68,337      145,787      139,509      15,728        2,474         708           -         -      110,956     15,133     27,858     28,625      91,994     34,021      27,353        799,268
        Doubtful & Problem Loans                      146,155       98,187      318,808      231,515      24,378       22,722       8,124       1,270         -      130,686     18,760     14,120     14,608      60,559     33,942      38,022      1,161,854
         - Loan Loss Reserve                         (157,464)     (84,223)    (303,181)    (270,623)    (21,444)     (21,498)     (7,612)     (2,032)     (134)    (115,064)   (16,264)   (23,927)   (25,257)    (45,990)   (25,540)    (28,971)    (1,149,224)
         -Interest & Fees-Unearned                          -            -            -            -           -            -           -           -         -            -          -          -          -           -          -           -              -

        Int. Fees & Other Collections                      -            -            -             -          -            -           -            -         -           -           -          -          -          -           -           -             -
        Adjudicated Assets                             2,546       12,076       26,730        19,276      8,224          189         (14)           -         -      22,811       1,362      3,534      1,946      4,214       8,766       4,189       115,849
        Investments & Subsidiaries                    45,228      103,783      170,341     1,174,400      3,108        5,098       5,239           10         9     155,906       3,672         11         32     10,550       3,460           -     1,680,846
        Net Fixed Assets                              80,473       47,631      165,620       195,079     16,772        9,585       9,280        1,833     2,062      67,264       9,905     16,567     10,528     21,316      24,637      44,863       723,415
                                                           -            -            -             -          -            -           -            -         -           -           -          -          -          -           -           -             -
        Other Assets                                 334,409      259,377      559,747       723,399     50,351      135,757      31,247       90,475       555     189,857      29,532     28,568     66,714    136,061     140,684     139,680     2,916,414

        TOTAL ASSETS                                3,098,144    1,350,922    5,009,863    4,524,224    644,395      846,530     181,179      324,691    28,086    1,569,652    251,999    332,185    284,329    492,644     579,857     747,174    20,265,872

        DEPOSITS                                    2,481,420     750,403     3,773,499    2,531,071    301,472      400,112     108,196      117,489     2,365     764,811     166,950    101,864    105,644    240,499     234,428     254,898    12,335,122
        Demand Deposits                               318,420      80,505       671,254      360,798     36,186      137,882      18,695       11,350     1,389     113,109      21,557     17,863      6,423     32,654      30,414      16,793     1,875,292
        Savings                                       485,135     212,242     1,358,288      679,575     63,952       86,561      13,138            -         -     175,003      26,976      6,938     26,878     76,877      44,168      29,362     3,285,093
        Time Deposits (Incl. CTS + FCBC)            1,649,523     355,550     1,664,783    1,317,788    195,151      156,634      75,588       99,433       914     411,632     111,695     73,216     64,901    117,088     140,102     183,768     6,617,764
        Deposits Retained as Guarantee                      -           -             -            -          -            -           -            -         -           -           -          -          -          -           -           -             -
        Other Deposits                                 28,341     102,106        79,174      172,911      6,184       19,035         774        6,706        63      65,068       6,722      3,847      7,443     13,880      19,744      24,975       556,973

        BORROWED FUNDS                                89,919      340,148      241,270     1,133,712    256,674      193,516      13,044       89,428    14,053     420,475      32,270    168,943     83,427     75,082     204,512     300,852     3,657,324
         - Call Loans from Domestic Banks              1,420          980        1,420        15,767      2,068       20,170           -       11,245     5,196       8,523           -          -          -      4,957           -         852        72,601
         - Financing f/ Banks & Central Bank          88,498      339,168      227,633     1,117,927    253,708      173,346      13,044       78,183     8,857     411,873      32,270    168,891     83,363     70,081     204,512     247,213     3,518,567
         - Bonds & Mortgage Bills Outstanding              -            -       12,216            17        897            -           -            -         -          79           -         52         63         43           -      52,787        66,156
        Payable Interest & Fees                            -            -            -             -          -            -           -            -         -           -           -          -          -          -           -       8,147         8,147
        Other Liabilities                            245,512      130,686      445,509       371,056     33,126      133,653      28,028       85,021     1,575     235,180      23,158     32,072     61,522    107,693      66,803     101,446     2,102,038
        Pension Funds & Other Reserves                22,838       13,377       55,767        52,139      6,520        8,342       1,918        7,106       212      20,347       3,573      1,959      3,299      4,685       6,832       9,346       218,259

        TOTAL LIABILITIES                           2,839,689    1,234,614    4,516,044    4,087,978    597,791      735,624     151,186      299,044    18,206    1,440,813    225,951    304,838    253,891    427,959     512,574     674,689    18,320,890

        CAPITAL FUNDS                                258,456      116,309      493,818      436,247      46,603      110,906      29,993       25,647     9,880     128,838      26,048     27,347     30,438     64,685      67,283      72,485     1,944,982
        Paid-in Capital                              216,686       88,101      291,568      320,601      41,848       43,320      24,401       28,332    13,668     116,512      26,685     25,913     28,890     65,673      61,753      52,884     1,446,835
        Capital Surplus                                    -            -            -        8,341           -       52,219           -            -         -           -           -          -          -          -       3,064           -        63,624
        Legal Reserves                                35,276       27,252      182,017       96,666       2,096        1,776       7,684            -         -      10,336           -      1,195      1,325          -       4,049      17,110       386,782
                                                           -            -            -            -           -            -           -            -         -           -           -          -          -          -           -           -             -
        Retained Earnings                                  -            -          295            -           -        4,375      (3,633)      (1,811)   (1,760)          -        (763)         9          -          -           -           -        (3,288)
        Net Profit/ (Loss) - Current Year              6,494          956       19,939       10,638       2,660        9,215       1,541         (874)   (2,028)      1,990         127        230        222       (988)     (1,584)      2,491        51,029

        TOTAL LIAB.& CAP.FUNDS                      3,098,144    1,350,922    5,009,863    4,524,224    644,395      846,530     181,179      324,691    28,086    1,569,652    251,999    332,185    284,329    492,644     579,857     747,174    20,265,872


        CONTINGENT LIABILITIES                       602,411      235,793      673,786   1,148,861   168,016  387,332 100,432  206,804   7,859   478,204                         70,996     49,638     93,572    157,819     141,006     171,093     4,693,623
        Financial Derivatives                              -            -            -           -         -        -       -        -       -         -                              -          -          -          -           -           -             -
        Contingent Credits                           602,411      235,793      673,786   1,148,861   168,016  387,332 100,432  206,804   7,859   478,204                         70,996     49,638     93,572    157,819     141,006     171,093     4,693,623
                                                           -            -            -           -         -        -       -        -       -         -                              -          -          -          -           -           -             -
        Exchange rate used (S/. = US$ 1)        $      0.284                    ---DOES NOT INCLUDE NEITHER CONSUMER ORIENTED BANKS NOR "MI BANCO"---


Jorge Romani                                                                                                                                                                                                                                                       Page 1
Phone (511) 919-8252 romani@terra.com.pe                                                                                          1/29/2011                                                                                                             SFN-1200 $SFN1200
Souce:                                                                                                            PERU                                                                                                                        December 31, 2000
The Peruvian Bank Insurance Superintendency                                                                                                                                                                                                            US $000
                                                                                                         COMMERCIAL BANKING SYSTEM


        PROFIT & LOSS STAT.                   CONTNT       INTBNK      CRDTO       WIESE       SUDAM       CITIBANK     STDCHT       BOSTON      BNP       BSCH        COMER       BIF       FINAN      LATINO      NBK        NVOMDO      TOTAL

        FINANCIAL INCOME                       344,524      182,055     642,908    463,541      76,966       88,804      21,556       27,441     1,923     195,402      45,917    41,538     40,737      44,909     69,160       83,372     2,370,753
        Ints.& Fees/ Loans                     205,243      125,950     360,972    289,039      60,567       64,527      11,055       14,517       949     128,273      38,158    32,932     33,526      30,282     55,209       68,832     1,520,032
        Ints.& Fees/ Loans to Banks-Demand      41,343       10,527      71,301     41,939       4,133        7,762       1,994        3,134       604      13,704       2,353     2,466      1,918       2,569      3,443        4,238       213,426
        Ints.& Fees/ Due from Banks              2,504        1,203       7,764      1,176       1,182        1,718         777          330       139         977         316       289        365         161        204          262        19,368
        Fees from Contingent Liabilities        52,992       18,361     123,981     53,258       5,321       10,686       2,207        5,459       186      23,277       3,049     3,553      3,602       9,506      5,281        6,449       327,166
        Trustees & Adm. Fees                         -          158         495        499          19            -           -            -         0           -           -         -          -          35          2          215         1,422
        Exchange Gain                           17,897        8,404      19,724     17,340       3,442          983       4,337        2,335       105      16,068       1,692     2,197      1,539       1,442      3,130        2,812       103,447
        Gain/ (Loss) on Equities Portfolio      23,458       16,122      51,503     60,189       2,157        3,041       1,186          949       (64)     12,104         339        (7)      (316)        875      1,794          480       173,810
        Other Financial Income                   1,087        1,332       7,168        100         145           86           -          717         4         999          12       109        104          39         97           85        12,083

        FINANCIAL EXPENSES                     (132,644)   (105,522)   (221,251)   (265,014)    (41,671)     (31,303)    (12,556)     (16,744)    (745)     (89,165)   (21,776)   (23,041)   (23,581)    (24,386)   (43,584)    (50,754)   (1,103,737)
        Interest on Deposits                   (118,872)    (54,879)   (182,174)   (167,969)    (18,151)     (21,870)    (11,235)     (11,381)    (226)     (48,437)   (17,931)    (7,359)   (12,618)    (12,919)   (18,680)    (24,138)     (728,839)
        Ints.& Fees on Borrowed Funds            (7,261)    (40,213)    (22,812)    (84,405)    (21,561)      (9,104)       (351)      (4,530)    (433)     (36,420)    (3,398)   (14,688)   (10,472)     (9,743)   (23,219)    (25,607)     (314,216)
        Exchange Losses                            (163)     (3,384)          -        (693)          -            -        (902)           -      (86)        (240)       (34)      (929)       (66)          -     (1,230)       (100)       (7,825)
        Deposits Indexed to Inflation              (120)     (1,106)     (2,036)       (463)          -            -           -         (754)       -            0          -          -        (72)          -          -           -        (4,552)
        Deposits' Insurance + Others             (6,228)     (5,939)    (14,229)    (11,484)     (1,959)        (329)        (68)         (79)      (1)      (4,068)      (412)       (65)      (354)     (1,725)      (456)       (909)      (48,305)

        GROSS FINANCIAL RESULT                 211,880       76,534     421,657    198,527      35,295       57,500       9,000       10,697     1,178     106,237      24,141    18,497     17,156      20,523     25,576       32,618     1,267,016

        - Loan Loss Provision                  (114,276)     (8,078)   (153,202)    (45,806)     (7,511)      (8,972)     (3,392)       (903)     (139)     (23,207)    (8,413)    (7,693)    (3,252)    (12,384)    (5,209)     (4,990)     (407,425)
          - Provision for Loan Losses          (114,276)     (8,078)   (153,202)    (45,806)     (7,511)      (8,972)     (3,392)       (903)     (139)     (23,207)    (8,413)    (7,693)    (3,252)    (12,384)    (5,209)     (4,990)     (407,425)

        NET FINANCIAL RESULT                    97,604       68,456     268,455    152,720      27,784       48,529       5,608        9,794     1,039      83,030      15,729    10,804     13,904       8,139     20,368       27,628      859,591

        Other Income                            83,268       19,828      46,838     79,553       3,311        8,706       8,946          808           3    36,510       2,573     4,462      2,373      23,051      9,072       20,475      349,776

        Other Expenses                         (170,084)    (86,938)   (288,618)   (224,223)    (27,360)     (46,450)    (12,541)     (11,216)   (2,824)   (113,607)   (17,516)   (14,774)   (15,518)    (32,034)   (31,200)    (45,194)   (1,140,095)
        Personnel & Board                       (56,667)    (26,102)   (117,559)    (68,959)    (10,739)     (19,086)     (5,982)      (7,273)   (1,735)    (33,119)    (6,172)    (5,132)    (6,175)    (11,375)   (10,328)    (12,792)     (399,193)
        General & Administrative Expenses       (63,172)    (35,464)   (129,836)    (94,282)    (11,507)     (20,449)     (4,039)      (3,223)     (828)    (46,724)    (8,957)    (6,945)    (7,562)    (13,472)   (13,391)    (16,965)     (476,816)
        Depreciation & Amortization             (17,707)    (12,368)    (29,869)    (35,488)     (2,966)      (2,987)     (1,065)        (613)     (220)    (10,207)    (1,127)    (1,389)    (1,351)     (4,701)    (4,071)     (7,065)     (133,195)
        Miscellaneous                           (32,538)    (13,004)    (11,355)    (25,494)     (2,147)      (3,928)     (1,455)        (107)      (41)    (23,557)    (1,261)    (1,308)      (430)     (2,486)    (3,409)     (8,372)     (130,892)

        E.B.I.Tx.                               10,788        1,347      26,675       8,050      3,736       10,785       2,013         (614)    (1,782)      5,933        785       493        759        (843)     (1,760)      2,908        69,272
        Income Taxes                                 -            -        (964)          -       (716)      (3,638)         (2)        (284)        (6)       (267)         -         -          -           -           -           -        (5,877)
        Result on Inflationary Exposure REI     (4,293)        (391)     (5,772)      2,588       (360)       2,068        (470)          24       (241)     (3,675)      (658)     (263)      (537)       (145)        176        (417)      (12,366)
        Extraordinary Income/ (Charge)               -            -           -           -          -            -           -            -          -           -          -         -          -           -           -           -             -

        NET PROFIT/(LOSS)                         6,494        956       19,939     10,638       2,660        9,215       1,541         (874)    (2,028)      1,990       127        230        222        (988)     (1,584)      2,491       51,029

        NET PROFIT/(LOSS) -REI                    6,494        956       19,939       8,050      2,660        7,146       1,541         (898)    (2,028)      1,990       127        230        222        (988)     (1,760)      2,491       51,029


Jorge Romani                                                                                                                                                                                                                                             Page 2
Phone (511) 919-8252 romani@terra.com.pe                                                                                 1/29/2011                                                                                                            SFN-1200 $SFN1200
Souce:                                                                                                                       PERU                                                                                                                      December 31, 2000
The Peruvian Bank Insurance Superintendency                                                                                                                                                                                                                     US $000
                                                                                                                    COMMERCIAL BANKING SYSTEM


        FINANCIAL RATIOS                               CONTNT       INTBNK       CRDTO        WIESE        SUDAM      CITIBANK     STDCHT       BOSTON     BNP         BSCH       COMER          BIF       FINAN    LATINO      NBK      NVOMDO      TOTAL
           PERCENTUAL STRUCTURE                                                                                                          ESTRUCTURA PORCENTUAL
        Quick Assets/ Total Assets                        36.0%        12.8%        31.0%          7.7%       18.4%       28.0%       27.6%       16.2%     45.9%         17.5%       15.4%      12.5%       8.5%     18.3%       8.4%     12.5%         21.1%
        Marketable Securities/ Total Assets                6.0%         0.6%         3.3%        (8.8%)        3.1%        2.4%        9.5%        2.1%      3.6%          1.8%        2.2%       0.0%       0.8%     10.8%       2.6%      1.8%          0.7%
        Net Loans/ Total Assets                           49.1%        55.9%        50.6%        45.6%        69.5%       54.2%       47.1%       55.4%     44.7%         54.7%       67.0%      72.8%      63.7%     46.7%      60.9%     62.2%         52.1%
        Gross Loans/ Total Assets                         54.2%        62.1%        56.6%        51.6%        72.8%       56.8%       51.3%       56.0%     45.2%         62.0%       73.4%      80.0%      72.5%     56.1%      65.3%     66.1%         57.8%
        Overdrafts/ Gross Loans                            2.1%         3.8%         5.4%          8.2%        7.5%       14.3%        1.1%        0.3%      6.2%          2.4%       11.7%       7.4%       2.9%     11.0%       3.8%      5.8%          5.6%
        Bills, Disc.& Loans/ Gross Loans                  65.6%        65.6%        66.5%        69.3%        55.0%       69.6%       70.8%       65.9%     60.5%         20.6%       52.7%      47.7%      39.1%     20.2%      45.8%     38.3%         58.6%
        Net Fixed Assets/ Total Assets                     2.6%         3.5%         3.3%          4.3%        2.6%        1.1%        5.1%        0.6%      7.3%          4.3%        3.9%       5.0%       3.7%      4.3%       4.2%      6.0%          3.6%
        Deposits/ (Liabilities + Capital Funds)           80.1%        55.5%        75.3%        55.9%        46.8%       47.3%       59.7%       36.2%      8.4%         48.7%       66.3%      30.7%      37.2%     48.8%      40.4%     34.1%         60.9%
        Savings/ Deposits                                 19.6%        28.3%        36.0%        26.8%        21.2%       21.6%       12.1%        0.0%      0.0%         22.9%       16.2%       6.8%      25.4%     32.0%      18.8%     11.5%         26.6%
        Time Deposits/ Deposits                           66.5%        47.4%        44.1%        52.1%        64.7%       39.1%       69.9%       84.6%     38.6%         53.8%       66.9%      71.9%      61.4%     48.7%      59.8%     72.1%         53.6%
        Placements/ Deposits                               0.0%         0.0%         0.0%          0.0%        0.0%        0.0%        0.0%        0.0%      0.0%          0.0%        0.0%       0.0%       0.0%      0.0%       0.0%      0.0%          0.0%
        Borrowed Funds/Liab.+ Capital Funds                2.9%        25.2%         4.8%        25.1%        39.8%       22.9%        7.2%       27.5%     50.0%         26.8%       12.8%      50.9%      29.3%     15.2%      35.3%     40.3%         18.0%
        Bonds & Mrtge.Bills/Liab.+ Cap.Funds               0.0%         0.0%         0.2%          0.0%        0.1%        0.0%        0.0%        0.0%      0.0%          0.0%        0.0%       0.0%       0.0%      0.0%       0.0%      7.1%          0.3%
        Cap.Funds/ Liab.+ Capital Funds                    8.3%         8.6%         9.9%          9.6%        7.2%       13.1%       16.6%        7.9%     35.2%          8.2%       10.3%       8.2%      10.7%     13.1%      11.6%      9.7%          9.6%

               OPERATIONAL RATIOS                                                                                              COEFICIENTES OPERATIVOS Y DE RENTABILIDAD
        Return on Equity (ROE)                             2.5%         0.8%        4.0%          1.8%         5.7%        6.4%    5.1%   (3.5%) (20.5%)                   1.5%     0.5%    0.8%    0.7%              (1.5%)     (2.6%)      3.4%        2.6%
        Return on Assets (ROA)                             0.2%         0.1%        0.4%          0.2%         0.4%        0.8%    0.9%   (0.3%)  (7.2%)                   0.1%     0.1%    0.1%    0.1%              (0.2%)     (0.3%)      0.3%        0.3%
        Net Profit (Loss)/ Total Deposits                  0.3%         0.1%        0.5%          0.3%         0.9%        1.8%    1.4%   (0.8%) (85.8%)                   0.3%     0.1%    0.2%    0.2%              (0.4%)     (0.8%)      1.0%        0.4%
        Net Profits/ Earning Assets                       13.4%        19.4%       15.9%         13.4%        14.1%       13.0%   15.7%   11.9%     7.7%                  17.1%    23.9%   15.8%   21.8%              20.2%      19.1%      16.1%       15.3%
        Return on Risk Assets-RORA                         0.3%         0.1%        0.6%          0.2%         0.5%        1.2%    1.2%   (0.3%) (13.3%)                   0.2%     0.1%    0.1%    0.1%              (0.2%)     (0.3%)      0.4%        0.3%
        Risk Assets (US$MM)                        $      1,984 $      1,178 $     3,456 $       4,174 $       526 $       610 $   131 $    272 $     15 $                1,295 $   213 $   291 $   260 $               402 $      531 $     653 $     15,991
        Operating Cost/ Net Financial Result             140.9%       108.0%      103.3%        130.1%        90.7%       87.6%  197.7%  113.4% 267.8%                   108.5%   103.4%  124.6%  108.5%             363.0%     136.4%     133.3%      117.4%
        Operating Cost/ Total Assets                       4.4%         5.5%        5.5%          4.4%         3.9%        5.0%    6.1%     3.4%    9.9%                   5.7%     6.5%    4.1%    5.3%                6.0%       4.8%      4.9%        5.0%
        Personnel/ Total Deposits                          2.3%         3.5%        3.1%          2.7%         3.6%        4.8%    5.5%     6.2%   73.4%                   4.3%     3.7%    5.0%    5.8%                4.7%       4.4%      5.0%        3.2%
        Personnel/ Total Asssets                           1.8%         1.9%        2.3%          1.5%         1.7%        2.3%    3.3%     2.2%    6.2%                   2.1%     2.4%    1.5%    2.2%                2.3%       1.8%      1.7%        2.0%
        Operating Cost/ Earning Assets                     5.3%         7.9%        6.8%          5.7%         4.6%        6.2%    8.1%     4.8%   11.2%                   7.9%     8.5%    5.1%    8.1%              13.3%        7.7%      7.1%        6.5%
        Market Share-Deposits                             20.1%         6.1%       30.6%         20.5%         2.4%        3.2%    0.9%     1.0%    0.0%                   6.2%     1.4%    0.8%    0.9%                1.9%       1.9%      2.1%      100.0%
        Market Share-Loans                                14.4%         7.2%       24.0%         19.5%         4.2%        4.3%    0.8%     1.7%    0.1%                   8.1%     1.6%    2.3%    1.7%                2.2%       3.3%      4.4%      100.0%

                  ASSETS QUALITY                                                                                                                CALIDAD DE ACTIVOS
         Doubtful & PD Loans/ Gross Loans                  8.7%         11.7%         11.2%           9.9%         5.2%      4.7%         8.7%      0.7%   0.0%           13.4%     10.1%       5.3%      7.1%      21.9%       9.0%       7.7%            9.9%
         Doubt.+ Refinanc Loans/ Gross Loans              14.1%         19.8%         16.4%         15.9%          8.6%      5.2%         9.5%      0.7%   0.0%           24.8%     18.3%     15.8%     21.0%       55.2%      17.9%     13.2%           16.8%
         Loan Loss Rsve/Doubt & Refincd.Loans             66.5%         50.6%         65.3%         72.9%        53.5%      85.3%        86.2%    160.0% #DIV/0!          47.6%     48.0%     57.0%     58.4%       30.1%      37.6%     44.3%           58.6%
         Loan Loss Reserve/ Gross Loans                    9.4%         10.0%         10.7%         11.6%          4.6%      4.5%         8.2%      1.1%   1.1%           11.8%       8.8%      9.0%    12.2%       16.7%       6.7%       5.9%            9.8%
         Loan Loss Reserve/ Net Loans                     10.3%         11.2%         12.0%         13.1%          4.8%      4.7%         8.9%      1.1%   1.1%           13.4%       9.6%      9.9%    14.0%       20.0%       7.2%       6.2%          10.9%
         Earning Assets (-) Expensive Liabilities   $     7,013 $ (150,504) $        38,025 $ (201,385) $ (12,288) $ 88,729 $ 16,143 $ 24,349 $ 8,430 $                 (40,331) $ (7,114) $ (8,273) $ (2,089) $ (93,795) $ (77,250) $ (38,080) $     (448,418)
         Net Earning Assets/ Total Assets                  0.2%       (11.1%)          0.8%         (4.5%)       (1.9%)     10.5%         8.9%      7.5%  30.0%           (2.6%)    (2.8%)    (2.5%)    (0.7%)    (19.0%)    (13.3%)     (5.1%)          (2.2%)
         Gross Loans/ Total Deposits                      67.7%       111.8%          75.2%         92.1%       155.6%     120.1%        85.9%    154.8% 537.0%          127.3%    110.9%    261.0%    195.2%     114.8%     161.6%     193.7%           94.9%
         Fixed Assets/ Capital Funds                      31.1%         41.0%         33.5%         44.7%        36.0%       8.6%        30.9%      7.1%  20.9%           52.2%     38.0%     60.6%     34.6%       33.0%      36.6%     61.9%           37.2%
     (*) (*) Total Deposits includes: Demand Deposits, Savings, Time Deposits (plus Fgn Cy. CD´s3rd. Parties Severance Indemnities) and Pledged Deposits
         Total Deposits includes: Demand Deposits, Savings, Time Deposits (plus Fgn Cy. CD´s & & 3rd. Parties Severance Indemnities) and Pledged Deposits

                       LIQUIDITY                                                                                                                      LIQUIDEZ
         Quick Assets/ Total Deposits                    44.9%         23.1%        41.2%         13.8%         39.3%        59.2%     46.3%         44.7% 545.1%             36.0%       23.2%    40.8%    22.8%     37.6%      20.9%     36.8%         34.7%
         Borrowed Funds/ Gross Loans (**)                 5.4%         40.5%         8.5%         48.6%         54.7%        40.3%     14.0%         49.2% 110.6%             43.2%       17.4%    63.5%    40.4%     27.2%      54.0%     60.9%         31.2%
         Demand Deposits/ Total Deposits                 12.8%         10.7%        17.8%         14.3%         12.0%        34.5%     17.3%          9.7%    58.7%           14.8%       12.9%    17.5%     6.1%     13.6%      13.0%      6.6%         15.2%
         Call Loans/ Total Deposits                       3.6%         45.3%         6.1%         44.8%         84.8%        48.4%     12.1%         76.1% 594.2%             55.0%       19.3%   165.8%    78.9%     31.2%      87.2%     97.3%         29.1%
         Call Loans/ Gross Loans                          5.4%         40.5%         8.1%         48.6%         54.5%        40.3%     14.0%         49.2% 110.6%             43.2%       17.4%    63.5%    40.4%     27.2%      54.0%     50.2%         30.7%
         Due From Banks/ Total Assets                     1.5%          0.0%         0.1%          0.0%          1.0%         0.5%       6.0%         3.1%     0.0%             0.1%       0.9%     0.7%     0.4%      0.2%       0.0%      0.0%          0.4%
         Financial Cost/ Borrowed Funds                   8.1%         11.8%         9.5%          7.4%          8.4%         4.7%       2.7%         5.1%     3.1%             8.7%      10.5%     8.7%    12.6%     13.0%      11.4%      8.5%          8.6%
     (**)(**) Borrowed Funds includes: Call Loans owed, Deposits from Banks (placements), Loans and other financing received from domestic/ foreign banksBonds/bills issued to finance loans & WK
          Borrowed Funds includes: Call Loans owed, Deposits from Banks (placements), Loans and other financing received from domestic/ foreign banks & & Bonds/bills issued to finance loans & WK

                   CAPITALIZATION                                                                                                                 CAPITALIZACION
        Capital Funds/ Total Assets                         8.3%        8.6%         9.9%         9.6%         7.2%       13.1%       16.6%        7.9%     35.2%          8.2%       10.3%       8.2%      10.7%     13.1%      11.6%      9.7%          9.6%
        Capital Funds/ Risk Assets(***)                    13.0%        9.9%        14.3%        10.5%         8.9%       18.2%       22.9%        9.4%     65.0%         10.0%       12.2%       9.4%      11.7%     16.1%      12.7%     11.1%         12.2%
        Capital Funds/ Gross Loans                         15.4%       13.9%        17.4%        18.7%         9.9%       23.1%       32.3%       14.1%     77.8%         13.2%       14.1%      10.3%      14.8%     23.4%      17.8%     14.7%         16.6%
        Capital Funds/ Total Deposits                      10.4%       15.5%        13.1%        17.2%        15.5%       27.7%       27.7%       21.8%    417.8%         16.8%       15.6%      26.8%      28.8%     26.9%      28.7%     28.4%         15.8%
        Risk Weighted Ratio                                 8.40        8.00         8.10         7.60         9.10        5.30        5.20        4.50      1.90          8.60        9.00       7.60       7.10      7.20       8.00     10.80          7.95
     (***) Risk Assets = Total Assets less Quick Assets
        (***) Risk Assets = Total Assets less Quick Assets


Jorge Romani                                                                                                                                                                                                                                                      Page 3
Phone (511) 919-8252 romani@terra.com.pe                                                                                            1/29/2011                                                                                                          SFN-1200 $SFN1200

More Related Content

What's hot

qwest communications Q_2Q07_histres
qwest communications Q_2Q07_histresqwest communications Q_2Q07_histres
qwest communications Q_2Q07_histresfinance19
 
qwest communications Historical Quarterly Results1Q 06_3Q08
qwest communications Historical Quarterly Results1Q 06_3Q08qwest communications Historical Quarterly Results1Q 06_3Q08
qwest communications Historical Quarterly Results1Q 06_3Q08finance19
 
qwest communications Q_1q08_profile_v2
qwest communications Q_1q08_profile_v2qwest communications Q_1q08_profile_v2
qwest communications Q_1q08_profile_v2finance19
 
Financial Statement Analysis
Financial Statement AnalysisFinancial Statement Analysis
Financial Statement AnalysisVivek Gupta
 
CHRSA P&L
CHRSA P&LCHRSA P&L
CHRSA P&Lmmazner
 
qwest communications Q_4Q07_profile
qwest communications Q_4Q07_profileqwest communications Q_4Q07_profile
qwest communications Q_4Q07_profilefinance19
 
slm 2Qtr2006SupplementalFinancialInfoFinal
slm 2Qtr2006SupplementalFinancialInfoFinalslm 2Qtr2006SupplementalFinancialInfoFinal
slm 2Qtr2006SupplementalFinancialInfoFinalfinance42
 
Villa Alhambra Financials July 2012
Villa Alhambra Financials July 2012Villa Alhambra Financials July 2012
Villa Alhambra Financials July 2012VillaAlhambra
 
car max ar99
 car max ar99 car max ar99
car max ar99finance30
 
qwest communications Q_3Q07_Historical_v2
qwest communications Q_3Q07_Historical_v2qwest communications Q_3Q07_Historical_v2
qwest communications Q_3Q07_Historical_v2finance19
 
qwest communications QProfile_1q07
qwest communications QProfile_1q07qwest communications QProfile_1q07
qwest communications QProfile_1q07finance19
 
2012 hcs영문감사보고서
2012 hcs영문감사보고서2012 hcs영문감사보고서
2012 hcs영문감사보고서Hyundai Finance
 
coventry health care annual reports 2004
coventry health care annual reports 2004coventry health care annual reports 2004
coventry health care annual reports 2004finance27
 
Villa Alhambra Financials May 2012
Villa Alhambra Financials May 2012Villa Alhambra Financials May 2012
Villa Alhambra Financials May 2012VillaAlhambra
 
regions SUPP3Q/07.v6
regions SUPP3Q/07.v6regions SUPP3Q/07.v6
regions SUPP3Q/07.v6finance25
 
Unitus Community Credit Union - Addendum to the 2008 Annual Report
Unitus Community Credit Union - Addendum to the 2008 Annual ReportUnitus Community Credit Union - Addendum to the 2008 Annual Report
Unitus Community Credit Union - Addendum to the 2008 Annual ReportUnitus Community Credit Union
 

What's hot (19)

qwest communications Q_2Q07_histres
qwest communications Q_2Q07_histresqwest communications Q_2Q07_histres
qwest communications Q_2Q07_histres
 
qwest communications Historical Quarterly Results1Q 06_3Q08
qwest communications Historical Quarterly Results1Q 06_3Q08qwest communications Historical Quarterly Results1Q 06_3Q08
qwest communications Historical Quarterly Results1Q 06_3Q08
 
qwest communications Q_1q08_profile_v2
qwest communications Q_1q08_profile_v2qwest communications Q_1q08_profile_v2
qwest communications Q_1q08_profile_v2
 
Financial Statement Analysis
Financial Statement AnalysisFinancial Statement Analysis
Financial Statement Analysis
 
CHRSA P&L
CHRSA P&LCHRSA P&L
CHRSA P&L
 
qwest communications Q_4Q07_profile
qwest communications Q_4Q07_profileqwest communications Q_4Q07_profile
qwest communications Q_4Q07_profile
 
Balance comprobación-diciembre-2011
Balance comprobación-diciembre-2011Balance comprobación-diciembre-2011
Balance comprobación-diciembre-2011
 
Pass Thru Pay
Pass Thru PayPass Thru Pay
Pass Thru Pay
 
slm 2Qtr2006SupplementalFinancialInfoFinal
slm 2Qtr2006SupplementalFinancialInfoFinalslm 2Qtr2006SupplementalFinancialInfoFinal
slm 2Qtr2006SupplementalFinancialInfoFinal
 
Villa Alhambra Financials July 2012
Villa Alhambra Financials July 2012Villa Alhambra Financials July 2012
Villa Alhambra Financials July 2012
 
car max ar99
 car max ar99 car max ar99
car max ar99
 
qwest communications Q_3Q07_Historical_v2
qwest communications Q_3Q07_Historical_v2qwest communications Q_3Q07_Historical_v2
qwest communications Q_3Q07_Historical_v2
 
qwest communications QProfile_1q07
qwest communications QProfile_1q07qwest communications QProfile_1q07
qwest communications QProfile_1q07
 
2012 hcs영문감사보고서
2012 hcs영문감사보고서2012 hcs영문감사보고서
2012 hcs영문감사보고서
 
coventry health care annual reports 2004
coventry health care annual reports 2004coventry health care annual reports 2004
coventry health care annual reports 2004
 
Villa Alhambra Financials May 2012
Villa Alhambra Financials May 2012Villa Alhambra Financials May 2012
Villa Alhambra Financials May 2012
 
regions SUPP3Q/07.v6
regions SUPP3Q/07.v6regions SUPP3Q/07.v6
regions SUPP3Q/07.v6
 
Unitus Community Credit Union - Addendum to the 2008 Annual Report
Unitus Community Credit Union - Addendum to the 2008 Annual ReportUnitus Community Credit Union - Addendum to the 2008 Annual Report
Unitus Community Credit Union - Addendum to the 2008 Annual Report
 
Anexo 1
Anexo 1Anexo 1
Anexo 1
 

Viewers also liked

Banco Nuevo Mundo Opinion técnica sobre Resolucion SBS-775-2001
Banco Nuevo Mundo Opinion técnica sobre Resolucion SBS-775-2001Banco Nuevo Mundo Opinion técnica sobre Resolucion SBS-775-2001
Banco Nuevo Mundo Opinion técnica sobre Resolucion SBS-775-2001gonzaloromani
 
Representaciones graficas estadisticas
Representaciones graficas estadisticasRepresentaciones graficas estadisticas
Representaciones graficas estadisticasdavid rojas
 
Bnm valoracion crediticia del grupo levy
Bnm   valoracion crediticia del grupo levyBnm   valoracion crediticia del grupo levy
Bnm valoracion crediticia del grupo levygonzaloromani
 
Bnm comentarios sobre presentacion SBS ate congress
Bnm   comentarios sobre presentacion SBS ate congressBnm   comentarios sobre presentacion SBS ate congress
Bnm comentarios sobre presentacion SBS ate congressgonzaloromani
 
Bnm ayuda memoria financiera sobre proceso judicial 1
Bnm   ayuda memoria financiera sobre proceso judicial 1Bnm   ayuda memoria financiera sobre proceso judicial 1
Bnm ayuda memoria financiera sobre proceso judicial 1gonzaloromani
 
Banco Nuevo Mundo - Presentación ante Congreso Peru
Banco Nuevo Mundo - Presentación ante Congreso PeruBanco Nuevo Mundo - Presentación ante Congreso Peru
Banco Nuevo Mundo - Presentación ante Congreso Perugonzaloromani
 
Inadecuado Proceso de Liquidación del Banco Nuevo Mundo
Inadecuado Proceso de Liquidación del Banco Nuevo MundoInadecuado Proceso de Liquidación del Banco Nuevo Mundo
Inadecuado Proceso de Liquidación del Banco Nuevo Mundogonzaloromani
 

Viewers also liked (7)

Banco Nuevo Mundo Opinion técnica sobre Resolucion SBS-775-2001
Banco Nuevo Mundo Opinion técnica sobre Resolucion SBS-775-2001Banco Nuevo Mundo Opinion técnica sobre Resolucion SBS-775-2001
Banco Nuevo Mundo Opinion técnica sobre Resolucion SBS-775-2001
 
Representaciones graficas estadisticas
Representaciones graficas estadisticasRepresentaciones graficas estadisticas
Representaciones graficas estadisticas
 
Bnm valoracion crediticia del grupo levy
Bnm   valoracion crediticia del grupo levyBnm   valoracion crediticia del grupo levy
Bnm valoracion crediticia del grupo levy
 
Bnm comentarios sobre presentacion SBS ate congress
Bnm   comentarios sobre presentacion SBS ate congressBnm   comentarios sobre presentacion SBS ate congress
Bnm comentarios sobre presentacion SBS ate congress
 
Bnm ayuda memoria financiera sobre proceso judicial 1
Bnm   ayuda memoria financiera sobre proceso judicial 1Bnm   ayuda memoria financiera sobre proceso judicial 1
Bnm ayuda memoria financiera sobre proceso judicial 1
 
Banco Nuevo Mundo - Presentación ante Congreso Peru
Banco Nuevo Mundo - Presentación ante Congreso PeruBanco Nuevo Mundo - Presentación ante Congreso Peru
Banco Nuevo Mundo - Presentación ante Congreso Peru
 
Inadecuado Proceso de Liquidación del Banco Nuevo Mundo
Inadecuado Proceso de Liquidación del Banco Nuevo MundoInadecuado Proceso de Liquidación del Banco Nuevo Mundo
Inadecuado Proceso de Liquidación del Banco Nuevo Mundo
 

Similar to Banco Nuevo Mundo - Analisis Financiero Sistema Banca Comercial Peru dec 2000

Impacto de solucion financiera propuesta por accionistas del Banco Nuevo Mundo
Impacto de solucion financiera propuesta por accionistas del Banco Nuevo MundoImpacto de solucion financiera propuesta por accionistas del Banco Nuevo Mundo
Impacto de solucion financiera propuesta por accionistas del Banco Nuevo Mundogonzaloromani
 
Banco Nuevo Mundo - Activos Rentables Sistema Banca Comercial Peru nov 2000 o...
Banco Nuevo Mundo - Activos Rentables Sistema Banca Comercial Peru nov 2000 o...Banco Nuevo Mundo - Activos Rentables Sistema Banca Comercial Peru nov 2000 o...
Banco Nuevo Mundo - Activos Rentables Sistema Banca Comercial Peru nov 2000 o...gonzaloromani
 
Abch group results booklet 2010
Abch group results booklet 2010Abch group results booklet 2010
Abch group results booklet 2010wgjlubbe
 
Government of Belize Budget 2012-2013: P. M.'s Presentation
Government of Belize Budget 2012-2013: P. M.'s PresentationGovernment of Belize Budget 2012-2013: P. M.'s Presentation
Government of Belize Budget 2012-2013: P. M.'s Presentationpupbelize
 
regions SUPP 1Q 07 FINAL
regions SUPP 1Q 07 FINALregions SUPP 1Q 07 FINAL
regions SUPP 1Q 07 FINALfinance25
 
regions SUPP 1Q 07 FINAL
regions SUPP 1Q 07 FINALregions SUPP 1Q 07 FINAL
regions SUPP 1Q 07 FINALfinance25
 
regions SUPP 1Q 07FINAL
regions SUPP 1Q 07FINALregions SUPP 1Q 07FINAL
regions SUPP 1Q 07FINALfinance25
 
regions SUPP 1Q 07FINAL
regions SUPP 1Q 07FINALregions SUPP 1Q 07FINAL
regions SUPP 1Q 07FINALfinance25
 
regions SUPP 3Q 07.v6
regions SUPP 3Q 07.v6regions SUPP 3Q 07.v6
regions SUPP 3Q 07.v6finance25
 
Prophecy Coal 2012 Q3 MD&A & Interim Financial Statements
Prophecy Coal 2012 Q3 MD&A & Interim Financial StatementsProphecy Coal 2012 Q3 MD&A & Interim Financial Statements
Prophecy Coal 2012 Q3 MD&A & Interim Financial StatementsWellgreen Platinum
 
regions SUPP 2Q 07.FINAL
regions SUPP 2Q 07.FINALregions SUPP 2Q 07.FINAL
regions SUPP 2Q 07.FINALfinance25
 
regions SUPP 2Q 07.FINAL-rev
regions SUPP 2Q 07.FINAL-revregions SUPP 2Q 07.FINAL-rev
regions SUPP 2Q 07.FINAL-revfinance25
 
SUPP2Q07.FINAL
SUPP2Q07.FINALSUPP2Q07.FINAL
SUPP2Q07.FINALfinance25
 
regions SUPP 2Q 07.FINAL-rev
regions SUPP 2Q 07.FINAL-revregions SUPP 2Q 07.FINAL-rev
regions SUPP 2Q 07.FINAL-revfinance25
 
Harley Davidson Annual Income Statement 1986 2007
Harley Davidson Annual Income Statement 1986 2007Harley Davidson Annual Income Statement 1986 2007
Harley Davidson Annual Income Statement 1986 2007earningsreport
 
Balance sheet of state bank of india (1)
Balance sheet of state bank of india (1)Balance sheet of state bank of india (1)
Balance sheet of state bank of india (1)shikha20102347
 
alltel 1Q06_Supplement
alltel  1Q06_Supplementalltel  1Q06_Supplement
alltel 1Q06_Supplementfinance27
 
alltel 2Q06_Supplement
alltel  2Q06_Supplementalltel  2Q06_Supplement
alltel 2Q06_Supplementfinance27
 
alltel 4Q04_Supplemental
alltel  4Q04_Supplementalalltel  4Q04_Supplemental
alltel 4Q04_Supplementalfinance27
 

Similar to Banco Nuevo Mundo - Analisis Financiero Sistema Banca Comercial Peru dec 2000 (20)

Impacto de solucion financiera propuesta por accionistas del Banco Nuevo Mundo
Impacto de solucion financiera propuesta por accionistas del Banco Nuevo MundoImpacto de solucion financiera propuesta por accionistas del Banco Nuevo Mundo
Impacto de solucion financiera propuesta por accionistas del Banco Nuevo Mundo
 
Banco Nuevo Mundo - Activos Rentables Sistema Banca Comercial Peru nov 2000 o...
Banco Nuevo Mundo - Activos Rentables Sistema Banca Comercial Peru nov 2000 o...Banco Nuevo Mundo - Activos Rentables Sistema Banca Comercial Peru nov 2000 o...
Banco Nuevo Mundo - Activos Rentables Sistema Banca Comercial Peru nov 2000 o...
 
Abch group results booklet 2010
Abch group results booklet 2010Abch group results booklet 2010
Abch group results booklet 2010
 
Government of Belize Budget 2012-2013: P. M.'s Presentation
Government of Belize Budget 2012-2013: P. M.'s PresentationGovernment of Belize Budget 2012-2013: P. M.'s Presentation
Government of Belize Budget 2012-2013: P. M.'s Presentation
 
regions SUPP 1Q 07 FINAL
regions SUPP 1Q 07 FINALregions SUPP 1Q 07 FINAL
regions SUPP 1Q 07 FINAL
 
regions SUPP 1Q 07 FINAL
regions SUPP 1Q 07 FINALregions SUPP 1Q 07 FINAL
regions SUPP 1Q 07 FINAL
 
regions SUPP 1Q 07FINAL
regions SUPP 1Q 07FINALregions SUPP 1Q 07FINAL
regions SUPP 1Q 07FINAL
 
regions SUPP 1Q 07FINAL
regions SUPP 1Q 07FINALregions SUPP 1Q 07FINAL
regions SUPP 1Q 07FINAL
 
regions SUPP 3Q 07.v6
regions SUPP 3Q 07.v6regions SUPP 3Q 07.v6
regions SUPP 3Q 07.v6
 
Prophecy Coal 2012 Q3 MD&A & Interim Financial Statements
Prophecy Coal 2012 Q3 MD&A & Interim Financial StatementsProphecy Coal 2012 Q3 MD&A & Interim Financial Statements
Prophecy Coal 2012 Q3 MD&A & Interim Financial Statements
 
regions SUPP 2Q 07.FINAL
regions SUPP 2Q 07.FINALregions SUPP 2Q 07.FINAL
regions SUPP 2Q 07.FINAL
 
regions SUPP 2Q 07.FINAL-rev
regions SUPP 2Q 07.FINAL-revregions SUPP 2Q 07.FINAL-rev
regions SUPP 2Q 07.FINAL-rev
 
SUPP2Q07.FINAL
SUPP2Q07.FINALSUPP2Q07.FINAL
SUPP2Q07.FINAL
 
regions SUPP 2Q 07.FINAL-rev
regions SUPP 2Q 07.FINAL-revregions SUPP 2Q 07.FINAL-rev
regions SUPP 2Q 07.FINAL-rev
 
Harley Davidson Annual Income Statement 1986 2007
Harley Davidson Annual Income Statement 1986 2007Harley Davidson Annual Income Statement 1986 2007
Harley Davidson Annual Income Statement 1986 2007
 
Balance sheet of state bank of india (1)
Balance sheet of state bank of india (1)Balance sheet of state bank of india (1)
Balance sheet of state bank of india (1)
 
Egresos 2012
Egresos 2012Egresos 2012
Egresos 2012
 
alltel 1Q06_Supplement
alltel  1Q06_Supplementalltel  1Q06_Supplement
alltel 1Q06_Supplement
 
alltel 2Q06_Supplement
alltel  2Q06_Supplementalltel  2Q06_Supplement
alltel 2Q06_Supplement
 
alltel 4Q04_Supplemental
alltel  4Q04_Supplementalalltel  4Q04_Supplemental
alltel 4Q04_Supplemental
 

More from gonzaloromani

The role of greed in america's meltdown
The role of greed in america's meltdownThe role of greed in america's meltdown
The role of greed in america's meltdowngonzaloromani
 
Banco Nuevo Mundo Subasta depositos sector publico -dec1998-sep2001
Banco Nuevo Mundo Subasta depositos sector publico -dec1998-sep2001Banco Nuevo Mundo Subasta depositos sector publico -dec1998-sep2001
Banco Nuevo Mundo Subasta depositos sector publico -dec1998-sep2001gonzaloromani
 
Banco Nuevo Mundo - subasta de depositos 1998-2001
Banco Nuevo Mundo - subasta de depositos 1998-2001Banco Nuevo Mundo - subasta de depositos 1998-2001
Banco Nuevo Mundo - subasta de depositos 1998-2001gonzaloromani
 
Banco Nuevo Mundo - Documentos pendiente de entrega por la SBS al Congreso Perú
Banco Nuevo Mundo - Documentos pendiente de entrega por la SBS al Congreso PerúBanco Nuevo Mundo - Documentos pendiente de entrega por la SBS al Congreso Perú
Banco Nuevo Mundo - Documentos pendiente de entrega por la SBS al Congreso Perúgonzaloromani
 
Carta al MEF con Propuesta de Solución - Caso Banco Nuevo Mundo
Carta al MEF con Propuesta de Solución - Caso Banco Nuevo MundoCarta al MEF con Propuesta de Solución - Caso Banco Nuevo Mundo
Carta al MEF con Propuesta de Solución - Caso Banco Nuevo Mundogonzaloromani
 
Banco Nuevo Mundo - Bases Técnicas para contestacion a la demanda presentada ...
Banco Nuevo Mundo - Bases Técnicas para contestacion a la demanda presentada ...Banco Nuevo Mundo - Bases Técnicas para contestacion a la demanda presentada ...
Banco Nuevo Mundo - Bases Técnicas para contestacion a la demanda presentada ...gonzaloromani
 
Banco Nuevo Mundo - Cometarios Técnicos sobre el proceso judicial
Banco Nuevo Mundo - Cometarios Técnicos sobre el proceso judicialBanco Nuevo Mundo - Cometarios Técnicos sobre el proceso judicial
Banco Nuevo Mundo - Cometarios Técnicos sobre el proceso judicialgonzaloromani
 
Banco Nuevo Mundo - Comentarios técnicos sobre Resolucion sbs-775-2001
Banco Nuevo Mundo - Comentarios técnicos sobre Resolucion sbs-775-2001Banco Nuevo Mundo - Comentarios técnicos sobre Resolucion sbs-775-2001
Banco Nuevo Mundo - Comentarios técnicos sobre Resolucion sbs-775-2001gonzaloromani
 
Banco Nuevo Mundo - Resumen de evaluacion de auditorias externas
Banco Nuevo Mundo - Resumen de evaluacion de auditorias externasBanco Nuevo Mundo - Resumen de evaluacion de auditorias externas
Banco Nuevo Mundo - Resumen de evaluacion de auditorias externasgonzaloromani
 
Banco Nuevo Mundo - Resumen de evaluacion efectuada por administradores judic...
Banco Nuevo Mundo - Resumen de evaluacion efectuada por administradores judic...Banco Nuevo Mundo - Resumen de evaluacion efectuada por administradores judic...
Banco Nuevo Mundo - Resumen de evaluacion efectuada por administradores judic...gonzaloromani
 
Banco Nuevo Mundo - Remuneraciones a Interventores SBS - comparativo
Banco Nuevo Mundo - Remuneraciones a Interventores SBS - comparativoBanco Nuevo Mundo - Remuneraciones a Interventores SBS - comparativo
Banco Nuevo Mundo - Remuneraciones a Interventores SBS - comparativogonzaloromani
 
Banco Nuevo Mundo - Remuneraciones pagadas a Interventores SBS dec00-sep01
Banco Nuevo Mundo - Remuneraciones pagadas a Interventores SBS dec00-sep01Banco Nuevo Mundo - Remuneraciones pagadas a Interventores SBS dec00-sep01
Banco Nuevo Mundo - Remuneraciones pagadas a Interventores SBS dec00-sep01gonzaloromani
 
Banco Nuevo Mundo provisiones al 30 nov2000
Banco Nuevo Mundo  provisiones al 30 nov2000Banco Nuevo Mundo  provisiones al 30 nov2000
Banco Nuevo Mundo provisiones al 30 nov2000gonzaloromani
 
Banco Nuevo Mundo - Provisiones al 30 nov2000
Banco Nuevo Mundo - Provisiones al 30 nov2000Banco Nuevo Mundo - Provisiones al 30 nov2000
Banco Nuevo Mundo - Provisiones al 30 nov2000gonzaloromani
 
Pesentacion sobre el caso Banco Nuevo Mundo
Pesentacion sobre el caso Banco Nuevo MundoPesentacion sobre el caso Banco Nuevo Mundo
Pesentacion sobre el caso Banco Nuevo Mundogonzaloromani
 
Banco Nuevo Mundo - Propuesta de solucion
Banco Nuevo Mundo - Propuesta de solucionBanco Nuevo Mundo - Propuesta de solucion
Banco Nuevo Mundo - Propuesta de soluciongonzaloromani
 
Banco Nuevo Mundo - Evoluci>n comparativa depositos estatales
Banco Nuevo Mundo - Evoluci>n comparativa depositos estatalesBanco Nuevo Mundo - Evoluci>n comparativa depositos estatales
Banco Nuevo Mundo - Evoluci>n comparativa depositos estatalesgonzaloromani
 
Banco Nuevo Mundo - Portafolio de creditos por categoría riesgo 11302000
Banco Nuevo Mundo - Portafolio de creditos por categoría riesgo 11302000Banco Nuevo Mundo - Portafolio de creditos por categoría riesgo 11302000
Banco Nuevo Mundo - Portafolio de creditos por categoría riesgo 11302000gonzaloromani
 
Porque no debe liquidarse el Banco Nuevo Mundo
Porque no debe liquidarse el Banco Nuevo MundoPorque no debe liquidarse el Banco Nuevo Mundo
Porque no debe liquidarse el Banco Nuevo Mundogonzaloromani
 
Reporte a accionistas sobre caso Banco Nuevo Mundo - Nuevo Mundo Holding
Reporte a accionistas sobre caso Banco Nuevo Mundo - Nuevo Mundo HoldingReporte a accionistas sobre caso Banco Nuevo Mundo - Nuevo Mundo Holding
Reporte a accionistas sobre caso Banco Nuevo Mundo - Nuevo Mundo Holdinggonzaloromani
 

More from gonzaloromani (20)

The role of greed in america's meltdown
The role of greed in america's meltdownThe role of greed in america's meltdown
The role of greed in america's meltdown
 
Banco Nuevo Mundo Subasta depositos sector publico -dec1998-sep2001
Banco Nuevo Mundo Subasta depositos sector publico -dec1998-sep2001Banco Nuevo Mundo Subasta depositos sector publico -dec1998-sep2001
Banco Nuevo Mundo Subasta depositos sector publico -dec1998-sep2001
 
Banco Nuevo Mundo - subasta de depositos 1998-2001
Banco Nuevo Mundo - subasta de depositos 1998-2001Banco Nuevo Mundo - subasta de depositos 1998-2001
Banco Nuevo Mundo - subasta de depositos 1998-2001
 
Banco Nuevo Mundo - Documentos pendiente de entrega por la SBS al Congreso Perú
Banco Nuevo Mundo - Documentos pendiente de entrega por la SBS al Congreso PerúBanco Nuevo Mundo - Documentos pendiente de entrega por la SBS al Congreso Perú
Banco Nuevo Mundo - Documentos pendiente de entrega por la SBS al Congreso Perú
 
Carta al MEF con Propuesta de Solución - Caso Banco Nuevo Mundo
Carta al MEF con Propuesta de Solución - Caso Banco Nuevo MundoCarta al MEF con Propuesta de Solución - Caso Banco Nuevo Mundo
Carta al MEF con Propuesta de Solución - Caso Banco Nuevo Mundo
 
Banco Nuevo Mundo - Bases Técnicas para contestacion a la demanda presentada ...
Banco Nuevo Mundo - Bases Técnicas para contestacion a la demanda presentada ...Banco Nuevo Mundo - Bases Técnicas para contestacion a la demanda presentada ...
Banco Nuevo Mundo - Bases Técnicas para contestacion a la demanda presentada ...
 
Banco Nuevo Mundo - Cometarios Técnicos sobre el proceso judicial
Banco Nuevo Mundo - Cometarios Técnicos sobre el proceso judicialBanco Nuevo Mundo - Cometarios Técnicos sobre el proceso judicial
Banco Nuevo Mundo - Cometarios Técnicos sobre el proceso judicial
 
Banco Nuevo Mundo - Comentarios técnicos sobre Resolucion sbs-775-2001
Banco Nuevo Mundo - Comentarios técnicos sobre Resolucion sbs-775-2001Banco Nuevo Mundo - Comentarios técnicos sobre Resolucion sbs-775-2001
Banco Nuevo Mundo - Comentarios técnicos sobre Resolucion sbs-775-2001
 
Banco Nuevo Mundo - Resumen de evaluacion de auditorias externas
Banco Nuevo Mundo - Resumen de evaluacion de auditorias externasBanco Nuevo Mundo - Resumen de evaluacion de auditorias externas
Banco Nuevo Mundo - Resumen de evaluacion de auditorias externas
 
Banco Nuevo Mundo - Resumen de evaluacion efectuada por administradores judic...
Banco Nuevo Mundo - Resumen de evaluacion efectuada por administradores judic...Banco Nuevo Mundo - Resumen de evaluacion efectuada por administradores judic...
Banco Nuevo Mundo - Resumen de evaluacion efectuada por administradores judic...
 
Banco Nuevo Mundo - Remuneraciones a Interventores SBS - comparativo
Banco Nuevo Mundo - Remuneraciones a Interventores SBS - comparativoBanco Nuevo Mundo - Remuneraciones a Interventores SBS - comparativo
Banco Nuevo Mundo - Remuneraciones a Interventores SBS - comparativo
 
Banco Nuevo Mundo - Remuneraciones pagadas a Interventores SBS dec00-sep01
Banco Nuevo Mundo - Remuneraciones pagadas a Interventores SBS dec00-sep01Banco Nuevo Mundo - Remuneraciones pagadas a Interventores SBS dec00-sep01
Banco Nuevo Mundo - Remuneraciones pagadas a Interventores SBS dec00-sep01
 
Banco Nuevo Mundo provisiones al 30 nov2000
Banco Nuevo Mundo  provisiones al 30 nov2000Banco Nuevo Mundo  provisiones al 30 nov2000
Banco Nuevo Mundo provisiones al 30 nov2000
 
Banco Nuevo Mundo - Provisiones al 30 nov2000
Banco Nuevo Mundo - Provisiones al 30 nov2000Banco Nuevo Mundo - Provisiones al 30 nov2000
Banco Nuevo Mundo - Provisiones al 30 nov2000
 
Pesentacion sobre el caso Banco Nuevo Mundo
Pesentacion sobre el caso Banco Nuevo MundoPesentacion sobre el caso Banco Nuevo Mundo
Pesentacion sobre el caso Banco Nuevo Mundo
 
Banco Nuevo Mundo - Propuesta de solucion
Banco Nuevo Mundo - Propuesta de solucionBanco Nuevo Mundo - Propuesta de solucion
Banco Nuevo Mundo - Propuesta de solucion
 
Banco Nuevo Mundo - Evoluci>n comparativa depositos estatales
Banco Nuevo Mundo - Evoluci>n comparativa depositos estatalesBanco Nuevo Mundo - Evoluci>n comparativa depositos estatales
Banco Nuevo Mundo - Evoluci>n comparativa depositos estatales
 
Banco Nuevo Mundo - Portafolio de creditos por categoría riesgo 11302000
Banco Nuevo Mundo - Portafolio de creditos por categoría riesgo 11302000Banco Nuevo Mundo - Portafolio de creditos por categoría riesgo 11302000
Banco Nuevo Mundo - Portafolio de creditos por categoría riesgo 11302000
 
Porque no debe liquidarse el Banco Nuevo Mundo
Porque no debe liquidarse el Banco Nuevo MundoPorque no debe liquidarse el Banco Nuevo Mundo
Porque no debe liquidarse el Banco Nuevo Mundo
 
Reporte a accionistas sobre caso Banco Nuevo Mundo - Nuevo Mundo Holding
Reporte a accionistas sobre caso Banco Nuevo Mundo - Nuevo Mundo HoldingReporte a accionistas sobre caso Banco Nuevo Mundo - Nuevo Mundo Holding
Reporte a accionistas sobre caso Banco Nuevo Mundo - Nuevo Mundo Holding
 

Recently uploaded

Lundin Gold April 2024 Corporate Presentation v4.pdf
Lundin Gold April 2024 Corporate Presentation v4.pdfLundin Gold April 2024 Corporate Presentation v4.pdf
Lundin Gold April 2024 Corporate Presentation v4.pdfAdnet Communications
 
(办理原版一样)QUT毕业证昆士兰科技大学毕业证学位证留信学历认证成绩单补办
(办理原版一样)QUT毕业证昆士兰科技大学毕业证学位证留信学历认证成绩单补办(办理原版一样)QUT毕业证昆士兰科技大学毕业证学位证留信学历认证成绩单补办
(办理原版一样)QUT毕业证昆士兰科技大学毕业证学位证留信学历认证成绩单补办fqiuho152
 
Unveiling the Top Chartered Accountants in India and Their Staggering Net Worth
Unveiling the Top Chartered Accountants in India and Their Staggering Net WorthUnveiling the Top Chartered Accountants in India and Their Staggering Net Worth
Unveiling the Top Chartered Accountants in India and Their Staggering Net WorthShaheen Kumar
 
Q3 2024 Earnings Conference Call and Webcast Slides
Q3 2024 Earnings Conference Call and Webcast SlidesQ3 2024 Earnings Conference Call and Webcast Slides
Q3 2024 Earnings Conference Call and Webcast SlidesMarketing847413
 
VIP Call Girls Service Begumpet Hyderabad Call +91-8250192130
VIP Call Girls Service Begumpet Hyderabad Call +91-8250192130VIP Call Girls Service Begumpet Hyderabad Call +91-8250192130
VIP Call Girls Service Begumpet Hyderabad Call +91-8250192130Suhani Kapoor
 
VIP Kolkata Call Girl Serampore 👉 8250192130 Available With Room
VIP Kolkata Call Girl Serampore 👉 8250192130  Available With RoomVIP Kolkata Call Girl Serampore 👉 8250192130  Available With Room
VIP Kolkata Call Girl Serampore 👉 8250192130 Available With Roomdivyansh0kumar0
 
House of Commons ; CDC schemes overview document
House of Commons ; CDC schemes overview documentHouse of Commons ; CDC schemes overview document
House of Commons ; CDC schemes overview documentHenry Tapper
 
SBP-Market-Operations and market managment
SBP-Market-Operations and market managmentSBP-Market-Operations and market managment
SBP-Market-Operations and market managmentfactical
 
VIP High Class Call Girls Saharanpur Anushka 8250192130 Independent Escort Se...
VIP High Class Call Girls Saharanpur Anushka 8250192130 Independent Escort Se...VIP High Class Call Girls Saharanpur Anushka 8250192130 Independent Escort Se...
VIP High Class Call Girls Saharanpur Anushka 8250192130 Independent Escort Se...Suhani Kapoor
 
Andheri Call Girls In 9825968104 Mumbai Hot Models
Andheri Call Girls In 9825968104 Mumbai Hot ModelsAndheri Call Girls In 9825968104 Mumbai Hot Models
Andheri Call Girls In 9825968104 Mumbai Hot Modelshematsharma006
 
Call Girls In Yusuf Sarai Women Seeking Men 9654467111
Call Girls In Yusuf Sarai Women Seeking Men 9654467111Call Girls In Yusuf Sarai Women Seeking Men 9654467111
Call Girls In Yusuf Sarai Women Seeking Men 9654467111Sapana Sha
 
Log your LOA pain with Pension Lab's brilliant campaign
Log your LOA pain with Pension Lab's brilliant campaignLog your LOA pain with Pension Lab's brilliant campaign
Log your LOA pain with Pension Lab's brilliant campaignHenry Tapper
 
OAT_RI_Ep19 WeighingTheRisks_Apr24_TheYellowMetal.pptx
OAT_RI_Ep19 WeighingTheRisks_Apr24_TheYellowMetal.pptxOAT_RI_Ep19 WeighingTheRisks_Apr24_TheYellowMetal.pptx
OAT_RI_Ep19 WeighingTheRisks_Apr24_TheYellowMetal.pptxhiddenlevers
 
VIP Call Girls Service Dilsukhnagar Hyderabad Call +91-8250192130
VIP Call Girls Service Dilsukhnagar Hyderabad Call +91-8250192130VIP Call Girls Service Dilsukhnagar Hyderabad Call +91-8250192130
VIP Call Girls Service Dilsukhnagar Hyderabad Call +91-8250192130Suhani Kapoor
 
Authentic No 1 Amil Baba In Pakistan Authentic No 1 Amil Baba In Karachi No 1...
Authentic No 1 Amil Baba In Pakistan Authentic No 1 Amil Baba In Karachi No 1...Authentic No 1 Amil Baba In Pakistan Authentic No 1 Amil Baba In Karachi No 1...
Authentic No 1 Amil Baba In Pakistan Authentic No 1 Amil Baba In Karachi No 1...First NO1 World Amil baba in Faisalabad
 
Financial institutions facilitate financing, economic transactions, issue fun...
Financial institutions facilitate financing, economic transactions, issue fun...Financial institutions facilitate financing, economic transactions, issue fun...
Financial institutions facilitate financing, economic transactions, issue fun...Avanish Goel
 
(DIYA) Bhumkar Chowk Call Girls Just Call 7001035870 [ Cash on Delivery ] Pun...
(DIYA) Bhumkar Chowk Call Girls Just Call 7001035870 [ Cash on Delivery ] Pun...(DIYA) Bhumkar Chowk Call Girls Just Call 7001035870 [ Cash on Delivery ] Pun...
(DIYA) Bhumkar Chowk Call Girls Just Call 7001035870 [ Cash on Delivery ] Pun...ranjana rawat
 
Chapter 2.ppt of macroeconomics by mankiw 9th edition
Chapter 2.ppt of macroeconomics by mankiw 9th editionChapter 2.ppt of macroeconomics by mankiw 9th edition
Chapter 2.ppt of macroeconomics by mankiw 9th editionMuhammadHusnain82237
 
20240417-Calibre-April-2024-Investor-Presentation.pdf
20240417-Calibre-April-2024-Investor-Presentation.pdf20240417-Calibre-April-2024-Investor-Presentation.pdf
20240417-Calibre-April-2024-Investor-Presentation.pdfAdnet Communications
 
BPPG response - Options for Defined Benefit schemes - 19Apr24.pdf
BPPG response - Options for Defined Benefit schemes - 19Apr24.pdfBPPG response - Options for Defined Benefit schemes - 19Apr24.pdf
BPPG response - Options for Defined Benefit schemes - 19Apr24.pdfHenry Tapper
 

Recently uploaded (20)

Lundin Gold April 2024 Corporate Presentation v4.pdf
Lundin Gold April 2024 Corporate Presentation v4.pdfLundin Gold April 2024 Corporate Presentation v4.pdf
Lundin Gold April 2024 Corporate Presentation v4.pdf
 
(办理原版一样)QUT毕业证昆士兰科技大学毕业证学位证留信学历认证成绩单补办
(办理原版一样)QUT毕业证昆士兰科技大学毕业证学位证留信学历认证成绩单补办(办理原版一样)QUT毕业证昆士兰科技大学毕业证学位证留信学历认证成绩单补办
(办理原版一样)QUT毕业证昆士兰科技大学毕业证学位证留信学历认证成绩单补办
 
Unveiling the Top Chartered Accountants in India and Their Staggering Net Worth
Unveiling the Top Chartered Accountants in India and Their Staggering Net WorthUnveiling the Top Chartered Accountants in India and Their Staggering Net Worth
Unveiling the Top Chartered Accountants in India and Their Staggering Net Worth
 
Q3 2024 Earnings Conference Call and Webcast Slides
Q3 2024 Earnings Conference Call and Webcast SlidesQ3 2024 Earnings Conference Call and Webcast Slides
Q3 2024 Earnings Conference Call and Webcast Slides
 
VIP Call Girls Service Begumpet Hyderabad Call +91-8250192130
VIP Call Girls Service Begumpet Hyderabad Call +91-8250192130VIP Call Girls Service Begumpet Hyderabad Call +91-8250192130
VIP Call Girls Service Begumpet Hyderabad Call +91-8250192130
 
VIP Kolkata Call Girl Serampore 👉 8250192130 Available With Room
VIP Kolkata Call Girl Serampore 👉 8250192130  Available With RoomVIP Kolkata Call Girl Serampore 👉 8250192130  Available With Room
VIP Kolkata Call Girl Serampore 👉 8250192130 Available With Room
 
House of Commons ; CDC schemes overview document
House of Commons ; CDC schemes overview documentHouse of Commons ; CDC schemes overview document
House of Commons ; CDC schemes overview document
 
SBP-Market-Operations and market managment
SBP-Market-Operations and market managmentSBP-Market-Operations and market managment
SBP-Market-Operations and market managment
 
VIP High Class Call Girls Saharanpur Anushka 8250192130 Independent Escort Se...
VIP High Class Call Girls Saharanpur Anushka 8250192130 Independent Escort Se...VIP High Class Call Girls Saharanpur Anushka 8250192130 Independent Escort Se...
VIP High Class Call Girls Saharanpur Anushka 8250192130 Independent Escort Se...
 
Andheri Call Girls In 9825968104 Mumbai Hot Models
Andheri Call Girls In 9825968104 Mumbai Hot ModelsAndheri Call Girls In 9825968104 Mumbai Hot Models
Andheri Call Girls In 9825968104 Mumbai Hot Models
 
Call Girls In Yusuf Sarai Women Seeking Men 9654467111
Call Girls In Yusuf Sarai Women Seeking Men 9654467111Call Girls In Yusuf Sarai Women Seeking Men 9654467111
Call Girls In Yusuf Sarai Women Seeking Men 9654467111
 
Log your LOA pain with Pension Lab's brilliant campaign
Log your LOA pain with Pension Lab's brilliant campaignLog your LOA pain with Pension Lab's brilliant campaign
Log your LOA pain with Pension Lab's brilliant campaign
 
OAT_RI_Ep19 WeighingTheRisks_Apr24_TheYellowMetal.pptx
OAT_RI_Ep19 WeighingTheRisks_Apr24_TheYellowMetal.pptxOAT_RI_Ep19 WeighingTheRisks_Apr24_TheYellowMetal.pptx
OAT_RI_Ep19 WeighingTheRisks_Apr24_TheYellowMetal.pptx
 
VIP Call Girls Service Dilsukhnagar Hyderabad Call +91-8250192130
VIP Call Girls Service Dilsukhnagar Hyderabad Call +91-8250192130VIP Call Girls Service Dilsukhnagar Hyderabad Call +91-8250192130
VIP Call Girls Service Dilsukhnagar Hyderabad Call +91-8250192130
 
Authentic No 1 Amil Baba In Pakistan Authentic No 1 Amil Baba In Karachi No 1...
Authentic No 1 Amil Baba In Pakistan Authentic No 1 Amil Baba In Karachi No 1...Authentic No 1 Amil Baba In Pakistan Authentic No 1 Amil Baba In Karachi No 1...
Authentic No 1 Amil Baba In Pakistan Authentic No 1 Amil Baba In Karachi No 1...
 
Financial institutions facilitate financing, economic transactions, issue fun...
Financial institutions facilitate financing, economic transactions, issue fun...Financial institutions facilitate financing, economic transactions, issue fun...
Financial institutions facilitate financing, economic transactions, issue fun...
 
(DIYA) Bhumkar Chowk Call Girls Just Call 7001035870 [ Cash on Delivery ] Pun...
(DIYA) Bhumkar Chowk Call Girls Just Call 7001035870 [ Cash on Delivery ] Pun...(DIYA) Bhumkar Chowk Call Girls Just Call 7001035870 [ Cash on Delivery ] Pun...
(DIYA) Bhumkar Chowk Call Girls Just Call 7001035870 [ Cash on Delivery ] Pun...
 
Chapter 2.ppt of macroeconomics by mankiw 9th edition
Chapter 2.ppt of macroeconomics by mankiw 9th editionChapter 2.ppt of macroeconomics by mankiw 9th edition
Chapter 2.ppt of macroeconomics by mankiw 9th edition
 
20240417-Calibre-April-2024-Investor-Presentation.pdf
20240417-Calibre-April-2024-Investor-Presentation.pdf20240417-Calibre-April-2024-Investor-Presentation.pdf
20240417-Calibre-April-2024-Investor-Presentation.pdf
 
BPPG response - Options for Defined Benefit schemes - 19Apr24.pdf
BPPG response - Options for Defined Benefit schemes - 19Apr24.pdfBPPG response - Options for Defined Benefit schemes - 19Apr24.pdf
BPPG response - Options for Defined Benefit schemes - 19Apr24.pdf
 

Banco Nuevo Mundo - Analisis Financiero Sistema Banca Comercial Peru dec 2000

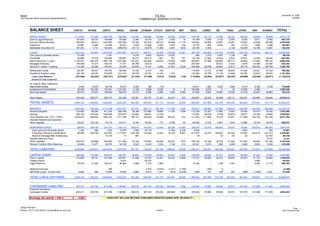
  • 1. Souce: PERU December 31, 2000 The Peruvian Bank Insurance Superintendency US $000 COMMERCIAL BANKING SYSTEM BALANCE SHEET CONTNT INTBNK CRDTO WIESE SUDAM CITIBANK STDCHT BOSTON BNP BSCH COMER BIF FINAN LATINO NBK NVOMDO TOTAL QUICK ASSETS 1,113,976 173,200 1,553,780 350,388 118,362 236,990 50,060 52,524 12,893 275,105 38,719 41,582 24,101 90,348 48,986 93,695 4,274,710 Cash & Legal Reserves 107,844 56,161 145,888 87,858 6,394 18,415 2,414 7,439 16 34,168 5,836 4,743 6,408 8,293 8,911 6,580 507,370 Due from Banks-Demand 795,943 99,813 1,200,500 639,768 87,328 183,353 28,315 36,369 11,119 194,581 25,826 33,907 15,361 25,942 23,628 69,086 3,470,840 Clearance 22,887 9,489 43,558 22,672 4,528 14,944 2,063 1,878 754 18,187 1,464 2,932 183 2,704 1,656 4,368 154,267 Marketable Securities S/T 187,302 7,737 163,835 (399,910) 20,112 20,278 17,268 6,837 1,003 28,169 5,593 - 2,149 53,409 14,790 13,661 142,232 LOANS 1,521,513 754,854 2,533,644 2,061,683 447,578 458,911 85,366 179,849 12,567 858,709 168,808 241,923 181,009 230,155 353,324 464,747 10,554,638 Call Loans to Domestic Banks 47,459 - 3,151 - 6,274 4,000 10,814 10,227 - 852 2,273 2,301 1,136 991 - - 89,478 Overdrafts 35,898 31,819 152,505 190,567 35,371 68,713 1,051 521 791 23,155 21,563 19,544 6,043 30,241 14,454 28,847 661,083 Bills & Discounts + Loans 1,100,973 550,376 1,887,108 1,615,464 257,837 334,552 65,874 119,920 7,684 200,891 97,506 126,692 80,717 55,664 173,645 189,142 6,864,046 Mortgage Financing 144,939 37,273 185,415 71,727 66,789 32,812 - 18,876 - 204,364 - 28,512 2,522 6,976 14,556 20,590 835,352 Other & LT Loans + Leasing 112,766 53,084 144,051 83,525 62,645 15,137 6,409 31,067 4,226 302,868 29,838 46,823 72,614 29,719 108,244 189,764 1,292,780 Refinanced Credits 90,787 68,337 145,787 139,509 15,728 2,474 708 - - 110,956 15,133 27,858 28,625 91,994 34,021 27,353 799,268 Doubtful & Problem Loans 146,155 98,187 318,808 231,515 24,378 22,722 8,124 1,270 - 130,686 18,760 14,120 14,608 60,559 33,942 38,022 1,161,854 - Loan Loss Reserve (157,464) (84,223) (303,181) (270,623) (21,444) (21,498) (7,612) (2,032) (134) (115,064) (16,264) (23,927) (25,257) (45,990) (25,540) (28,971) (1,149,224) -Interest & Fees-Unearned - - - - - - - - - - - - - - - - - Int. Fees & Other Collections - - - - - - - - - - - - - - - - - Adjudicated Assets 2,546 12,076 26,730 19,276 8,224 189 (14) - - 22,811 1,362 3,534 1,946 4,214 8,766 4,189 115,849 Investments & Subsidiaries 45,228 103,783 170,341 1,174,400 3,108 5,098 5,239 10 9 155,906 3,672 11 32 10,550 3,460 - 1,680,846 Net Fixed Assets 80,473 47,631 165,620 195,079 16,772 9,585 9,280 1,833 2,062 67,264 9,905 16,567 10,528 21,316 24,637 44,863 723,415 - - - - - - - - - - - - - - - - - Other Assets 334,409 259,377 559,747 723,399 50,351 135,757 31,247 90,475 555 189,857 29,532 28,568 66,714 136,061 140,684 139,680 2,916,414 TOTAL ASSETS 3,098,144 1,350,922 5,009,863 4,524,224 644,395 846,530 181,179 324,691 28,086 1,569,652 251,999 332,185 284,329 492,644 579,857 747,174 20,265,872 DEPOSITS 2,481,420 750,403 3,773,499 2,531,071 301,472 400,112 108,196 117,489 2,365 764,811 166,950 101,864 105,644 240,499 234,428 254,898 12,335,122 Demand Deposits 318,420 80,505 671,254 360,798 36,186 137,882 18,695 11,350 1,389 113,109 21,557 17,863 6,423 32,654 30,414 16,793 1,875,292 Savings 485,135 212,242 1,358,288 679,575 63,952 86,561 13,138 - - 175,003 26,976 6,938 26,878 76,877 44,168 29,362 3,285,093 Time Deposits (Incl. CTS + FCBC) 1,649,523 355,550 1,664,783 1,317,788 195,151 156,634 75,588 99,433 914 411,632 111,695 73,216 64,901 117,088 140,102 183,768 6,617,764 Deposits Retained as Guarantee - - - - - - - - - - - - - - - - - Other Deposits 28,341 102,106 79,174 172,911 6,184 19,035 774 6,706 63 65,068 6,722 3,847 7,443 13,880 19,744 24,975 556,973 BORROWED FUNDS 89,919 340,148 241,270 1,133,712 256,674 193,516 13,044 89,428 14,053 420,475 32,270 168,943 83,427 75,082 204,512 300,852 3,657,324 - Call Loans from Domestic Banks 1,420 980 1,420 15,767 2,068 20,170 - 11,245 5,196 8,523 - - - 4,957 - 852 72,601 - Financing f/ Banks & Central Bank 88,498 339,168 227,633 1,117,927 253,708 173,346 13,044 78,183 8,857 411,873 32,270 168,891 83,363 70,081 204,512 247,213 3,518,567 - Bonds & Mortgage Bills Outstanding - - 12,216 17 897 - - - - 79 - 52 63 43 - 52,787 66,156 Payable Interest & Fees - - - - - - - - - - - - - - - 8,147 8,147 Other Liabilities 245,512 130,686 445,509 371,056 33,126 133,653 28,028 85,021 1,575 235,180 23,158 32,072 61,522 107,693 66,803 101,446 2,102,038 Pension Funds & Other Reserves 22,838 13,377 55,767 52,139 6,520 8,342 1,918 7,106 212 20,347 3,573 1,959 3,299 4,685 6,832 9,346 218,259 TOTAL LIABILITIES 2,839,689 1,234,614 4,516,044 4,087,978 597,791 735,624 151,186 299,044 18,206 1,440,813 225,951 304,838 253,891 427,959 512,574 674,689 18,320,890 CAPITAL FUNDS 258,456 116,309 493,818 436,247 46,603 110,906 29,993 25,647 9,880 128,838 26,048 27,347 30,438 64,685 67,283 72,485 1,944,982 Paid-in Capital 216,686 88,101 291,568 320,601 41,848 43,320 24,401 28,332 13,668 116,512 26,685 25,913 28,890 65,673 61,753 52,884 1,446,835 Capital Surplus - - - 8,341 - 52,219 - - - - - - - - 3,064 - 63,624 Legal Reserves 35,276 27,252 182,017 96,666 2,096 1,776 7,684 - - 10,336 - 1,195 1,325 - 4,049 17,110 386,782 - - - - - - - - - - - - - - - - - Retained Earnings - - 295 - - 4,375 (3,633) (1,811) (1,760) - (763) 9 - - - - (3,288) Net Profit/ (Loss) - Current Year 6,494 956 19,939 10,638 2,660 9,215 1,541 (874) (2,028) 1,990 127 230 222 (988) (1,584) 2,491 51,029 TOTAL LIAB.& CAP.FUNDS 3,098,144 1,350,922 5,009,863 4,524,224 644,395 846,530 181,179 324,691 28,086 1,569,652 251,999 332,185 284,329 492,644 579,857 747,174 20,265,872 CONTINGENT LIABILITIES 602,411 235,793 673,786 1,148,861 168,016 387,332 100,432 206,804 7,859 478,204 70,996 49,638 93,572 157,819 141,006 171,093 4,693,623 Financial Derivatives - - - - - - - - - - - - - - - - - Contingent Credits 602,411 235,793 673,786 1,148,861 168,016 387,332 100,432 206,804 7,859 478,204 70,996 49,638 93,572 157,819 141,006 171,093 4,693,623 - - - - - - - - - - - - - - - - - Exchange rate used (S/. = US$ 1) $ 0.284 ---DOES NOT INCLUDE NEITHER CONSUMER ORIENTED BANKS NOR "MI BANCO"--- Jorge Romani Page 1 Phone (511) 919-8252 romani@terra.com.pe 1/29/2011 SFN-1200 $SFN1200
  • 2. Souce: PERU December 31, 2000 The Peruvian Bank Insurance Superintendency US $000 COMMERCIAL BANKING SYSTEM PROFIT & LOSS STAT. CONTNT INTBNK CRDTO WIESE SUDAM CITIBANK STDCHT BOSTON BNP BSCH COMER BIF FINAN LATINO NBK NVOMDO TOTAL FINANCIAL INCOME 344,524 182,055 642,908 463,541 76,966 88,804 21,556 27,441 1,923 195,402 45,917 41,538 40,737 44,909 69,160 83,372 2,370,753 Ints.& Fees/ Loans 205,243 125,950 360,972 289,039 60,567 64,527 11,055 14,517 949 128,273 38,158 32,932 33,526 30,282 55,209 68,832 1,520,032 Ints.& Fees/ Loans to Banks-Demand 41,343 10,527 71,301 41,939 4,133 7,762 1,994 3,134 604 13,704 2,353 2,466 1,918 2,569 3,443 4,238 213,426 Ints.& Fees/ Due from Banks 2,504 1,203 7,764 1,176 1,182 1,718 777 330 139 977 316 289 365 161 204 262 19,368 Fees from Contingent Liabilities 52,992 18,361 123,981 53,258 5,321 10,686 2,207 5,459 186 23,277 3,049 3,553 3,602 9,506 5,281 6,449 327,166 Trustees & Adm. Fees - 158 495 499 19 - - - 0 - - - - 35 2 215 1,422 Exchange Gain 17,897 8,404 19,724 17,340 3,442 983 4,337 2,335 105 16,068 1,692 2,197 1,539 1,442 3,130 2,812 103,447 Gain/ (Loss) on Equities Portfolio 23,458 16,122 51,503 60,189 2,157 3,041 1,186 949 (64) 12,104 339 (7) (316) 875 1,794 480 173,810 Other Financial Income 1,087 1,332 7,168 100 145 86 - 717 4 999 12 109 104 39 97 85 12,083 FINANCIAL EXPENSES (132,644) (105,522) (221,251) (265,014) (41,671) (31,303) (12,556) (16,744) (745) (89,165) (21,776) (23,041) (23,581) (24,386) (43,584) (50,754) (1,103,737) Interest on Deposits (118,872) (54,879) (182,174) (167,969) (18,151) (21,870) (11,235) (11,381) (226) (48,437) (17,931) (7,359) (12,618) (12,919) (18,680) (24,138) (728,839) Ints.& Fees on Borrowed Funds (7,261) (40,213) (22,812) (84,405) (21,561) (9,104) (351) (4,530) (433) (36,420) (3,398) (14,688) (10,472) (9,743) (23,219) (25,607) (314,216) Exchange Losses (163) (3,384) - (693) - - (902) - (86) (240) (34) (929) (66) - (1,230) (100) (7,825) Deposits Indexed to Inflation (120) (1,106) (2,036) (463) - - - (754) - 0 - - (72) - - - (4,552) Deposits' Insurance + Others (6,228) (5,939) (14,229) (11,484) (1,959) (329) (68) (79) (1) (4,068) (412) (65) (354) (1,725) (456) (909) (48,305) GROSS FINANCIAL RESULT 211,880 76,534 421,657 198,527 35,295 57,500 9,000 10,697 1,178 106,237 24,141 18,497 17,156 20,523 25,576 32,618 1,267,016 - Loan Loss Provision (114,276) (8,078) (153,202) (45,806) (7,511) (8,972) (3,392) (903) (139) (23,207) (8,413) (7,693) (3,252) (12,384) (5,209) (4,990) (407,425) - Provision for Loan Losses (114,276) (8,078) (153,202) (45,806) (7,511) (8,972) (3,392) (903) (139) (23,207) (8,413) (7,693) (3,252) (12,384) (5,209) (4,990) (407,425) NET FINANCIAL RESULT 97,604 68,456 268,455 152,720 27,784 48,529 5,608 9,794 1,039 83,030 15,729 10,804 13,904 8,139 20,368 27,628 859,591 Other Income 83,268 19,828 46,838 79,553 3,311 8,706 8,946 808 3 36,510 2,573 4,462 2,373 23,051 9,072 20,475 349,776 Other Expenses (170,084) (86,938) (288,618) (224,223) (27,360) (46,450) (12,541) (11,216) (2,824) (113,607) (17,516) (14,774) (15,518) (32,034) (31,200) (45,194) (1,140,095) Personnel & Board (56,667) (26,102) (117,559) (68,959) (10,739) (19,086) (5,982) (7,273) (1,735) (33,119) (6,172) (5,132) (6,175) (11,375) (10,328) (12,792) (399,193) General & Administrative Expenses (63,172) (35,464) (129,836) (94,282) (11,507) (20,449) (4,039) (3,223) (828) (46,724) (8,957) (6,945) (7,562) (13,472) (13,391) (16,965) (476,816) Depreciation & Amortization (17,707) (12,368) (29,869) (35,488) (2,966) (2,987) (1,065) (613) (220) (10,207) (1,127) (1,389) (1,351) (4,701) (4,071) (7,065) (133,195) Miscellaneous (32,538) (13,004) (11,355) (25,494) (2,147) (3,928) (1,455) (107) (41) (23,557) (1,261) (1,308) (430) (2,486) (3,409) (8,372) (130,892) E.B.I.Tx. 10,788 1,347 26,675 8,050 3,736 10,785 2,013 (614) (1,782) 5,933 785 493 759 (843) (1,760) 2,908 69,272 Income Taxes - - (964) - (716) (3,638) (2) (284) (6) (267) - - - - - - (5,877) Result on Inflationary Exposure REI (4,293) (391) (5,772) 2,588 (360) 2,068 (470) 24 (241) (3,675) (658) (263) (537) (145) 176 (417) (12,366) Extraordinary Income/ (Charge) - - - - - - - - - - - - - - - - - NET PROFIT/(LOSS) 6,494 956 19,939 10,638 2,660 9,215 1,541 (874) (2,028) 1,990 127 230 222 (988) (1,584) 2,491 51,029 NET PROFIT/(LOSS) -REI 6,494 956 19,939 8,050 2,660 7,146 1,541 (898) (2,028) 1,990 127 230 222 (988) (1,760) 2,491 51,029 Jorge Romani Page 2 Phone (511) 919-8252 romani@terra.com.pe 1/29/2011 SFN-1200 $SFN1200
  • 3. Souce: PERU December 31, 2000 The Peruvian Bank Insurance Superintendency US $000 COMMERCIAL BANKING SYSTEM FINANCIAL RATIOS CONTNT INTBNK CRDTO WIESE SUDAM CITIBANK STDCHT BOSTON BNP BSCH COMER BIF FINAN LATINO NBK NVOMDO TOTAL PERCENTUAL STRUCTURE ESTRUCTURA PORCENTUAL Quick Assets/ Total Assets 36.0% 12.8% 31.0% 7.7% 18.4% 28.0% 27.6% 16.2% 45.9% 17.5% 15.4% 12.5% 8.5% 18.3% 8.4% 12.5% 21.1% Marketable Securities/ Total Assets 6.0% 0.6% 3.3% (8.8%) 3.1% 2.4% 9.5% 2.1% 3.6% 1.8% 2.2% 0.0% 0.8% 10.8% 2.6% 1.8% 0.7% Net Loans/ Total Assets 49.1% 55.9% 50.6% 45.6% 69.5% 54.2% 47.1% 55.4% 44.7% 54.7% 67.0% 72.8% 63.7% 46.7% 60.9% 62.2% 52.1% Gross Loans/ Total Assets 54.2% 62.1% 56.6% 51.6% 72.8% 56.8% 51.3% 56.0% 45.2% 62.0% 73.4% 80.0% 72.5% 56.1% 65.3% 66.1% 57.8% Overdrafts/ Gross Loans 2.1% 3.8% 5.4% 8.2% 7.5% 14.3% 1.1% 0.3% 6.2% 2.4% 11.7% 7.4% 2.9% 11.0% 3.8% 5.8% 5.6% Bills, Disc.& Loans/ Gross Loans 65.6% 65.6% 66.5% 69.3% 55.0% 69.6% 70.8% 65.9% 60.5% 20.6% 52.7% 47.7% 39.1% 20.2% 45.8% 38.3% 58.6% Net Fixed Assets/ Total Assets 2.6% 3.5% 3.3% 4.3% 2.6% 1.1% 5.1% 0.6% 7.3% 4.3% 3.9% 5.0% 3.7% 4.3% 4.2% 6.0% 3.6% Deposits/ (Liabilities + Capital Funds) 80.1% 55.5% 75.3% 55.9% 46.8% 47.3% 59.7% 36.2% 8.4% 48.7% 66.3% 30.7% 37.2% 48.8% 40.4% 34.1% 60.9% Savings/ Deposits 19.6% 28.3% 36.0% 26.8% 21.2% 21.6% 12.1% 0.0% 0.0% 22.9% 16.2% 6.8% 25.4% 32.0% 18.8% 11.5% 26.6% Time Deposits/ Deposits 66.5% 47.4% 44.1% 52.1% 64.7% 39.1% 69.9% 84.6% 38.6% 53.8% 66.9% 71.9% 61.4% 48.7% 59.8% 72.1% 53.6% Placements/ Deposits 0.0% 0.0% 0.0% 0.0% 0.0% 0.0% 0.0% 0.0% 0.0% 0.0% 0.0% 0.0% 0.0% 0.0% 0.0% 0.0% 0.0% Borrowed Funds/Liab.+ Capital Funds 2.9% 25.2% 4.8% 25.1% 39.8% 22.9% 7.2% 27.5% 50.0% 26.8% 12.8% 50.9% 29.3% 15.2% 35.3% 40.3% 18.0% Bonds & Mrtge.Bills/Liab.+ Cap.Funds 0.0% 0.0% 0.2% 0.0% 0.1% 0.0% 0.0% 0.0% 0.0% 0.0% 0.0% 0.0% 0.0% 0.0% 0.0% 7.1% 0.3% Cap.Funds/ Liab.+ Capital Funds 8.3% 8.6% 9.9% 9.6% 7.2% 13.1% 16.6% 7.9% 35.2% 8.2% 10.3% 8.2% 10.7% 13.1% 11.6% 9.7% 9.6% OPERATIONAL RATIOS COEFICIENTES OPERATIVOS Y DE RENTABILIDAD Return on Equity (ROE) 2.5% 0.8% 4.0% 1.8% 5.7% 6.4% 5.1% (3.5%) (20.5%) 1.5% 0.5% 0.8% 0.7% (1.5%) (2.6%) 3.4% 2.6% Return on Assets (ROA) 0.2% 0.1% 0.4% 0.2% 0.4% 0.8% 0.9% (0.3%) (7.2%) 0.1% 0.1% 0.1% 0.1% (0.2%) (0.3%) 0.3% 0.3% Net Profit (Loss)/ Total Deposits 0.3% 0.1% 0.5% 0.3% 0.9% 1.8% 1.4% (0.8%) (85.8%) 0.3% 0.1% 0.2% 0.2% (0.4%) (0.8%) 1.0% 0.4% Net Profits/ Earning Assets 13.4% 19.4% 15.9% 13.4% 14.1% 13.0% 15.7% 11.9% 7.7% 17.1% 23.9% 15.8% 21.8% 20.2% 19.1% 16.1% 15.3% Return on Risk Assets-RORA 0.3% 0.1% 0.6% 0.2% 0.5% 1.2% 1.2% (0.3%) (13.3%) 0.2% 0.1% 0.1% 0.1% (0.2%) (0.3%) 0.4% 0.3% Risk Assets (US$MM) $ 1,984 $ 1,178 $ 3,456 $ 4,174 $ 526 $ 610 $ 131 $ 272 $ 15 $ 1,295 $ 213 $ 291 $ 260 $ 402 $ 531 $ 653 $ 15,991 Operating Cost/ Net Financial Result 140.9% 108.0% 103.3% 130.1% 90.7% 87.6% 197.7% 113.4% 267.8% 108.5% 103.4% 124.6% 108.5% 363.0% 136.4% 133.3% 117.4% Operating Cost/ Total Assets 4.4% 5.5% 5.5% 4.4% 3.9% 5.0% 6.1% 3.4% 9.9% 5.7% 6.5% 4.1% 5.3% 6.0% 4.8% 4.9% 5.0% Personnel/ Total Deposits 2.3% 3.5% 3.1% 2.7% 3.6% 4.8% 5.5% 6.2% 73.4% 4.3% 3.7% 5.0% 5.8% 4.7% 4.4% 5.0% 3.2% Personnel/ Total Asssets 1.8% 1.9% 2.3% 1.5% 1.7% 2.3% 3.3% 2.2% 6.2% 2.1% 2.4% 1.5% 2.2% 2.3% 1.8% 1.7% 2.0% Operating Cost/ Earning Assets 5.3% 7.9% 6.8% 5.7% 4.6% 6.2% 8.1% 4.8% 11.2% 7.9% 8.5% 5.1% 8.1% 13.3% 7.7% 7.1% 6.5% Market Share-Deposits 20.1% 6.1% 30.6% 20.5% 2.4% 3.2% 0.9% 1.0% 0.0% 6.2% 1.4% 0.8% 0.9% 1.9% 1.9% 2.1% 100.0% Market Share-Loans 14.4% 7.2% 24.0% 19.5% 4.2% 4.3% 0.8% 1.7% 0.1% 8.1% 1.6% 2.3% 1.7% 2.2% 3.3% 4.4% 100.0% ASSETS QUALITY CALIDAD DE ACTIVOS Doubtful & PD Loans/ Gross Loans 8.7% 11.7% 11.2% 9.9% 5.2% 4.7% 8.7% 0.7% 0.0% 13.4% 10.1% 5.3% 7.1% 21.9% 9.0% 7.7% 9.9% Doubt.+ Refinanc Loans/ Gross Loans 14.1% 19.8% 16.4% 15.9% 8.6% 5.2% 9.5% 0.7% 0.0% 24.8% 18.3% 15.8% 21.0% 55.2% 17.9% 13.2% 16.8% Loan Loss Rsve/Doubt & Refincd.Loans 66.5% 50.6% 65.3% 72.9% 53.5% 85.3% 86.2% 160.0% #DIV/0! 47.6% 48.0% 57.0% 58.4% 30.1% 37.6% 44.3% 58.6% Loan Loss Reserve/ Gross Loans 9.4% 10.0% 10.7% 11.6% 4.6% 4.5% 8.2% 1.1% 1.1% 11.8% 8.8% 9.0% 12.2% 16.7% 6.7% 5.9% 9.8% Loan Loss Reserve/ Net Loans 10.3% 11.2% 12.0% 13.1% 4.8% 4.7% 8.9% 1.1% 1.1% 13.4% 9.6% 9.9% 14.0% 20.0% 7.2% 6.2% 10.9% Earning Assets (-) Expensive Liabilities $ 7,013 $ (150,504) $ 38,025 $ (201,385) $ (12,288) $ 88,729 $ 16,143 $ 24,349 $ 8,430 $ (40,331) $ (7,114) $ (8,273) $ (2,089) $ (93,795) $ (77,250) $ (38,080) $ (448,418) Net Earning Assets/ Total Assets 0.2% (11.1%) 0.8% (4.5%) (1.9%) 10.5% 8.9% 7.5% 30.0% (2.6%) (2.8%) (2.5%) (0.7%) (19.0%) (13.3%) (5.1%) (2.2%) Gross Loans/ Total Deposits 67.7% 111.8% 75.2% 92.1% 155.6% 120.1% 85.9% 154.8% 537.0% 127.3% 110.9% 261.0% 195.2% 114.8% 161.6% 193.7% 94.9% Fixed Assets/ Capital Funds 31.1% 41.0% 33.5% 44.7% 36.0% 8.6% 30.9% 7.1% 20.9% 52.2% 38.0% 60.6% 34.6% 33.0% 36.6% 61.9% 37.2% (*) (*) Total Deposits includes: Demand Deposits, Savings, Time Deposits (plus Fgn Cy. CD´s3rd. Parties Severance Indemnities) and Pledged Deposits Total Deposits includes: Demand Deposits, Savings, Time Deposits (plus Fgn Cy. CD´s & & 3rd. Parties Severance Indemnities) and Pledged Deposits LIQUIDITY LIQUIDEZ Quick Assets/ Total Deposits 44.9% 23.1% 41.2% 13.8% 39.3% 59.2% 46.3% 44.7% 545.1% 36.0% 23.2% 40.8% 22.8% 37.6% 20.9% 36.8% 34.7% Borrowed Funds/ Gross Loans (**) 5.4% 40.5% 8.5% 48.6% 54.7% 40.3% 14.0% 49.2% 110.6% 43.2% 17.4% 63.5% 40.4% 27.2% 54.0% 60.9% 31.2% Demand Deposits/ Total Deposits 12.8% 10.7% 17.8% 14.3% 12.0% 34.5% 17.3% 9.7% 58.7% 14.8% 12.9% 17.5% 6.1% 13.6% 13.0% 6.6% 15.2% Call Loans/ Total Deposits 3.6% 45.3% 6.1% 44.8% 84.8% 48.4% 12.1% 76.1% 594.2% 55.0% 19.3% 165.8% 78.9% 31.2% 87.2% 97.3% 29.1% Call Loans/ Gross Loans 5.4% 40.5% 8.1% 48.6% 54.5% 40.3% 14.0% 49.2% 110.6% 43.2% 17.4% 63.5% 40.4% 27.2% 54.0% 50.2% 30.7% Due From Banks/ Total Assets 1.5% 0.0% 0.1% 0.0% 1.0% 0.5% 6.0% 3.1% 0.0% 0.1% 0.9% 0.7% 0.4% 0.2% 0.0% 0.0% 0.4% Financial Cost/ Borrowed Funds 8.1% 11.8% 9.5% 7.4% 8.4% 4.7% 2.7% 5.1% 3.1% 8.7% 10.5% 8.7% 12.6% 13.0% 11.4% 8.5% 8.6% (**)(**) Borrowed Funds includes: Call Loans owed, Deposits from Banks (placements), Loans and other financing received from domestic/ foreign banksBonds/bills issued to finance loans & WK Borrowed Funds includes: Call Loans owed, Deposits from Banks (placements), Loans and other financing received from domestic/ foreign banks & & Bonds/bills issued to finance loans & WK CAPITALIZATION CAPITALIZACION Capital Funds/ Total Assets 8.3% 8.6% 9.9% 9.6% 7.2% 13.1% 16.6% 7.9% 35.2% 8.2% 10.3% 8.2% 10.7% 13.1% 11.6% 9.7% 9.6% Capital Funds/ Risk Assets(***) 13.0% 9.9% 14.3% 10.5% 8.9% 18.2% 22.9% 9.4% 65.0% 10.0% 12.2% 9.4% 11.7% 16.1% 12.7% 11.1% 12.2% Capital Funds/ Gross Loans 15.4% 13.9% 17.4% 18.7% 9.9% 23.1% 32.3% 14.1% 77.8% 13.2% 14.1% 10.3% 14.8% 23.4% 17.8% 14.7% 16.6% Capital Funds/ Total Deposits 10.4% 15.5% 13.1% 17.2% 15.5% 27.7% 27.7% 21.8% 417.8% 16.8% 15.6% 26.8% 28.8% 26.9% 28.7% 28.4% 15.8% Risk Weighted Ratio 8.40 8.00 8.10 7.60 9.10 5.30 5.20 4.50 1.90 8.60 9.00 7.60 7.10 7.20 8.00 10.80 7.95 (***) Risk Assets = Total Assets less Quick Assets (***) Risk Assets = Total Assets less Quick Assets Jorge Romani Page 3 Phone (511) 919-8252 romani@terra.com.pe 1/29/2011 SFN-1200 $SFN1200