1. Manage your
FMEA better p. 23
Is CAPA
evil? p. 38
Plus:
QUALITY
P
www.qualityprogress.com | January 2015Putting Best Practices to Work
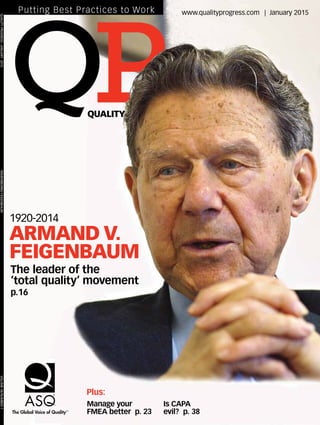
1920-2014
ARMAND V.
FEIGENBAUM
The leader of the
‘total quality’ movement
p.16
The Global Voice of QualityTM
QUALITYPROGRESS|JANUARY2015 REMEMBERINGFEIGENBAUM VOLUME48/NUMBER1
2.
3. What’s Online in the
ASQ Knowledge Center?
Access this month’s featured content and moreWeb exclusives in the
ASQ Knowledge Center at asq.org/knowledge-center/featured.html.
CASE STUDY
Forensic Techniques Reveal Conclusive
Evidence in Pipeline Construction Dispute
Learn how data collection through forensic
intelligence and forensic interviews helped
resolve a dispute about the extent of a
contractor’s implementation of a project’s
quality management system.
WEBCAST
Corrective Action—A Practical and Effective
Approach for ISO 9001:2008
This webcast explores common misunderstandings
about corrective action related to ISO 9001:2008
requirements and presents a practical approach to a
well-organized corrective action process.
The Global Voice of QualityTM
CERTIFICATION MEMBERSHIP PUBLICATIONSTRAINING CONFERENCES
BENCHMARKING
Key Contact Center Benchmarks
See benchmarking data collected from
contact centers in a variety of industries.
Data are included for metrics such as agent
schedule adherence, response time for
inbound requests coming from email,
average agent salary, and more.
4. ASQ certification is a cornerstone of your career growth.You immediately establish yourself as a
recognized expert in your field, resulting in promotions, higher salaries, greater demand for your
services, and an advantage over your competition. Invest in your career and your future with an
ASQ certification. Apply for the upcoming June 2015 exam!
Upcoming Application Deadline: April 17, 2015
Exam Date: June 6, 2015
Get Your ASQ Certification
For more information or to apply for an exam, visit asq.org/cert.
The Global Voice of QualityTM
CERTIFICATION MEMBERSHIP PUBLICATIONSTRAINING CONFERENCES
5. FEATURES
• More on a Legend
Sidebars on the influences
and environment surrounding
Armand V. Feigenbaum when
he developed the concept of
total quality, the focus of this
month’s cover story, “Total
Quality’s Leader,” pp. 16-22.
• CUSUM Complements
Additional figures to illustrate the
cumulative sum (CUSUM) technique
using Excel, the topic of this month’s
One Good Idea column, p. 63.
• Back to Basics
Translated into Spanish.
• Free Advice
Check out QP’s archive of
the Expert Answers questions
and answers.
www.qualityprogress.com
ONLY @
TRIBUTE
Total Quality’s Leader
Remembering the pioneer who integrated quality into organizational
management: Armand V. Feigenbaum.
by Gregory H. Watson
FMEA
Narrow(er) Focus
Realize the true value, power and utility of FMEAs when you apply this
new method that helps deselect inappropriate failure modes.
by James R. Kotterman
STANDARDS
Dissecting the Differences
Sorting out changes in the latest version of EN ISO 14971:2012 and the
implications they have on medical devices and risk management.
by Bob Mehta
RISK
Separate Steps
Know the differences between corrective and preventive action
to avoid mistakes and make your CAPAs shine.
by Dennis Arter
16
23
30
Contents
Putting Best Practices to Work | January 2015 | www.qualityprogress.com
38
16
30
Cover photo of Armand V. Feigenbaum courtesy of the
Berkshire Eagle (Pittsfield, MA)
7. UPFRONT
Total Commitment
The leader of ‘total quality management’
IN HIS THOUGHTFUL tribute to the recently deceased quality forefather, author and
friend Greg Watson said of Armand “Val” Feigenbaum: “In reflection, Feigenbaum’s life
serves as a role model of total commitment to quality.”
It’s always fascinating to look back on the origins of what we now call “quality” and
realize how relevant those concepts remain today. Watson recaps Feigenbaum’s early
work and the contributions of other thought leaders of that time, whose combined works
culminated in Feigenbaum’s esteemed tome, Total Quality Control.
In the book’s third edition, Feigenbaum’s preface states:
“Quality is in its essence a way of managing the organization.” And he firmly believed
in the premise that quality had to be built into every facet of an organization to reap the
most significant benefits.
Read more in “Total Quality’s Leader,” p. 16. A special thank you to Watson for craft-
ing this fine remembrance.
Sure, quality tools are great and we all rely on them to help us succeed in our work.
But what if they can be improved upon? In “Narrow(er) Focus,” p. 23, author James R.
Kotterman reveals a new way to make traditional failure modes and effects analysis feel
less painful—7PFM, a technique the author modified from the original created by John
Lindland. The tool is designed to narrow down potential failures from the seemingly
infinite to a manageable seven, helping to arrive at a conclusion much sooner. Give it a
try, and let me know how it works for you.
In another article, learn how to use corrective action or preventive action—CAPA—
correctly. Commonly lumped together, they must be pulled apart and the differences
understood, writes author Dennis Arter. In “Separate Steps,” p. 38, he explains the
definitions, some of the most common mistakes, and how to apply the steps correctly to
minimize risk.
This month’s Standards Outlook column focuses on counterfeit products. Dale K.
Gordon explains in “Fake Out,” p. 54, the serious consequences of this growing problem.
It’s much more serious than having to return a knock-off bottle of perfume (and yes, I
learned my lesson).
Happy New Year! QP
Seiche Sanders
Editor
EXECUTIVE EDITOR AND
ASSOCIATE PUBLISHER
Seiche Sanders
ASSOCIATE EDITOR
Mark Edmund
ASSISTANT EDITOR
Amanda Hankel
MANUSCRIPT COORDINATOR
Valerie Ellifson
COPY EDITOR
Susan E. Daniels
ART DIRECTOR
Mary Uttech
GRAPHIC DESIGNER
Sandy Wyss
PRODUCTION
Cathy Milquet
ADVERTISING PRODUCTION
Barbara Mitrovic
DIGITAL PRODUCTION SPECIALISTS
Julie Stroik
Julie Wagner
MEDIA SALES
Naylor LLC
Lou Brandow
Krys D’Antonio
Norbert Musial
MEDIA SALES ADMINISTRATOR
Kathy Thomas
MARKETING ADMINISTRATOR
Matt Meinholz
EDITORIAL OFFICES
Phone: 414-272-8575
Fax: 414-272-1734
ADVERTISING OFFICES
Phone: 866-277-5666
ASQ ADMINISTRATION
CEO
William J. Troy
Managing Directors
Ajoy Bose
Julie Gabelmann
Brian J. LeHouillier
Laurel Nelson-Rowe
To promote discussion of issues in the field of quality and
ensure coverage of all responsible points of view, Quality
Progress publishes articles representing conflicting and minor-
ity views. Opinions expressed are those of the authors and not
necessarily of ASQ or Quality Progress. Use of the ASQ logo in
advertisements does not necessarily constitute endorsement of
that particular product or service by ASQ.
QUALITY PROGRESS
QP
January 2015 • QP 5
I was lucky to meet Feigenbaum and his brother
Donald (right) in 2009 at ASQ’s World Conference
on Quality and Improvement.
8. QP • www.qualityprogress.com6
LOGON
Grandma’s influence
Thank you to author Yvonne Simmons
Howze for the delightful article about your
grandmother and her impact on you, “Qual-
ity in the First Person: Lasting Impression”
(December 2014, p. 64).
These lessons in humility, service and
struggle that we are exposed to when we
are young, often from parents or relatives,
are so important. It sounds like your grand-
mother was a fantastic person.
It is always a pleasure for me when I see
examples of the human, interpersonal side
of our profession discussed in the press. I
am convinced there is a wealth of produc-
tivity waiting to be released by understand-
ing the effects of true leadership and how
we can work together better. I am grateful
for your latest contribution.
David Ledwig
Brevard, NC
Defining, creating quality
In response to “Finding Harmony” (November
2014, pp. 16-20): Defining quality is not that
complicated. Creating it is another matter
entirely.
Quality can be defined as the customer’s
perception of the product. If the customer
thinks the product has low quality, it does.
Conversely, if the customer thinks that the
product has high quality, it does. It does not
really matter what you think, or how hard
you tried. The customer’s perception is all
that matters.
Creating quality is the sum the process
parts, from marketing to shipping and all
functions in between. For expediency, an
imaginary line is drawn between product
reliability (design) and quality (manufactur-
ing). But in the end, the customer only sees
Seen&Heard
StayConnected
Find the latest news, quips and targeted
content from QP staff.
Executive Editor & Associate
Publisher Seiche Sanders:
@ASQ_Seiche
Associate Editor Mark Edmund:
@ASQ_Mark
Assistant Editor Amanda Hankel:
@ASQ_Amanda
editor@asq.org
www.facebook.com/
groups/43461176682
www.linkedin.com/groups/quality-
progress-magazine-asq-1878386
a product that is cost efficient and either
performs its mission or doesn’t. A product
that fails to perform its mission in any way
is a low-quality product. Therefore, quality is
the customer’s perception of the product.
John L. Dalrymple
Westlake Village, CA
Business excellence and Baldrige
Congratulations to the authors on
recognizing the need for a multipronged
approach to business excellence in the
article, “Multipronged Approach” (Novem-
ber 2014, pp. 22-29). I was delighted to
note that, by the end of the article, they
had included almost all of the elements
covered in the Baldrige Performance
Excellence Program. Perhaps that’s why it
worked so well for them.
Diane Schmalensee
Boston
Cooperation, not competition
“The System Is the Solution” (November
2014, pp. 38-43) is an excellent article on
how a system perspective leads to the
conclusion that cooperation instead of
competition is the key to attaining the
goals set by any organization.
Eleazar Chacon
Miami
Inspiring story
I just got around to reading Brian
Csikos’ story, “Will to Live” (March 2014,
pp. 32-37), and I’m glad I did. It was
fabulously inspiring and very well written.
Congratulations to you, Brian, and your
beautiful family. Keep hanging in there.
Larry Jenkins
Westminster, MD
Tune In
The latest episode of ASQ TV
focuses on careers in quality. In the
episode, hear about the stages in
a quality career, evolving respon-
sibilities of a quality professional
and what quality professionals wish
their colleagues would stop saying.
Watch for an episode dedicated to
those new to qual-
ity on Jan. 20. Visit
http://videos.asq.
org to access the
full video library.
9. January 2015 • QP 7
QPQUALITY PROGRESS
PAST CHAIR
Stephen K. Hacker, Transformation Systems Interna-
tional, LLC
CHAIR
Cecilia Kimberlin, Kimberlin LLC (retired – Abbott)
CHAIR-ELECT
Patricia La Londe, CareFusion
TREASURER
Eric Hayler, BMW Manufacturing
SECRETARY
William J. Troy, ASQ
PARLIAMENTARIAN
Sue Campbell, ASQ
DIRECTORS
Donald Brecken, Ferris State University
Heather L. Crawford, Apollo Endosurgery
Raymond R. Crawford, Parsons Brinckerhoff
Ha C. Dao, Emerson Climate Technologies, Inc.
Benito Flores, Universidad de Monterrey
Julia K. Gabaldón, Quality New Mexico
Edwin G. Landauer, Clackamas Community College
David B. Levy, Tekni-Plex Flexibles Division
Sylvester (Bud) M. Newton, Jr., Alcoa
Daniella A. Picciotti, Bechtel
Steven J. Schuelka, SJS Consulting
Kush K. Shah, General Motors
James B. Shore, Quality Lean Solutions, LLC
Jason Spiegler, Camstar Systems, Inc.
Joal Teitelbaum, Joal Teitelbaum Escritório de
Engenharia
G. Geoffrey Vining, Virginia Tech, Department of
Statistics
QP EDITORIAL REVIEW BOARD
Randy Brull, chair
Administrative Committee
Brady Boggs, Randy Brull, Jane Campanizzi,
Larry Haugh, Jim Jaquess, Gary MacLean,
R. Dan Reid, Richard Stump
Technical reviewers
Andy Barnett, Matthew Barsalou, David Bonyuet, Da-
vid Burger, Bernie Carpenter, L.N. Prabhu Chandrasek-
aran, Ken Cogan, Linda Cubalchini-Travis, Ahmad
Elshennawy, Mark Gavoor, Kunita Gear, Daniel Gold,
T. Gourishankar, Roberto Guzman, Ellen Hardy, Lynne
Hare, Ray Klotz, Tom Kubiak, William LaFollette, Pradip
Mehta, Larry Picciano, Gene Placzkowski, Tony Polito,
Peter Pylipow, Imran Ahmad Rana, John Richards,
James Rooney, Brian Scullin, Amitava Sengupta, Mohit
Sharma, A.V. Srinivas, Joe Tunner, Manu Vora, Keith
Wagoner, Jack Westfall, Doron Zilbershtein
QUICK POLL RESULTS
Each month at www.qualityprogress.com, visitors can take an informal survey. Here are
the numbers from last month‘s Quick Poll:
Which of these definitions of quality do you most agree with?
42.1% Implementing changes to prevent future issues.
32.8% Having a recall process in place in advance of quality problems.
21.8% Apologizing publicly and maintaining transparency while rectifying the issue.
3.1% Performing customer outreach methods to prevent recall notices from being
ignored.
Visit www.qualityprogress.com for the latest question:
What technology-related amenities would you most like to see at sports venues?
• Apps for food service.
• Apps for restroom wait times.
• Bigger, brighter video boards.
• Free, fast Wi-Fi service.
QP
QualityNewsTODAY
Recent headlines from ASQ’s global news service
Amazon’s New Robot Army is Ready to Ship
The e-commerce giant boasts that it has boosted efficiency by deploying more than 15,000
wheeled robots to crisscross the floors of its biggest warehouses and deliver stacks of toys,
books and other products to employees. (bit.ly/amazonrobotarmy)
Learning Together, From Others
A school district in Wisconsin opened its doors to more than 100 visitors from all over the
country to learn tactics and strategies used to build continuous improvement processes
throughout their respective school districts. (bit.ly/schoolslearntogether)
• Watch more on risk management
Looking for more on this month‘s featured topic? Check out an episode of ASQ TV by
visiting http://videos.asq.org/risk-management-and-quality. In the episode, learn the
ways organizations think about risk management, how risk management is evolving
and why the quality community is essential to organizations’ risk management
functions.
• Resource guides and directories
QP often publishes guides to vendors, providers and suppliers. View an archive
of these guides by visiting http://asq.org/qualityprogress/tools-resources/
resource-guides-directories/index.html.
• We want to hear you
Send comments about recent QP articles to editor@asq.org or comment on the
article’s webpage. Your comment could appear in the LogOn section of QP.
www.qualityprogress.com
ONLINE
EXTRAS@
WANT THE LATEST QUALITY-RELATED NEWS AND ANALYSIS? The QNT Weekly
enewsletter, available exclusively to ASQ members, delivers it every Friday.
Subscribe now at http://email.asq.org/subscribe/qntwk.
10. QP • www.qualityprogress.com8
Understanding control charts
Q: I have about 10 paper testing instru-
ments that my organization uses to
measure paper standards. Every different
location (there are eight total) uses the
same type of instrument, test procedure
and the same paper standard out of the
same lot. This reduces the variability as
much as possible.
The labs collect 10 test data points and
send me the results. I am new and hate to
admit that I am lost. I need to know which
statistical process control chart to use
that I can dump the data into and, at the
same time, save time. I would like to see
the center line, upper and lower limit lines,
and when a test or instrument result is out
of the limits. The last person also showed
the limit lines of the 10 data points from
each instrument. This was his designed
program. When he left, he took the pro-
gram with him. I also have a low budget
and don’t want to be reprimanded for both
problems. I would appreciate all the help
you could possibly provide.
A: Control charts would be an excellent
tool to determine when a test or instru-
ment result is outside limits. One approach
would be to chart the data in three differ-
ent ways:
1. For each instrument, use an individual
values/moving range (I-MR) chart to
quickly determine if any individual data
point is outside limits.
2. For each instrument, use an average/
standard deviation (X-bar-S) chart with
the subgroup size of 10 test data points
to determine if each particular instru-
ment is performing as it should on that
particular day.
3. Take the averages from each subgroup
from each instrument on a given day,
and use another X-bar-S chart to deter-
mine if the instruments as a whole are
performing as usual.
To demonstrate, electrical sensitiv-
ity data in millivolts were obtained on a
device and analyzed as an example of the
proposed techniques.
1. I-MR chart on each measurement.
Plot all the points obtained on each
instrument on separate charts for each
EXPERTANSWE
I-MR chart of instrument No. 10 / FIGURE 1
Observation
IndividualvalueMovingrange
UCL = 2.916
UCL = 1.467
UCL = upper control limit
LCL = lower control limit
I-MR = individual values/moving range
LCL = 0.527
LCL = 0
X = 1.721
MR = 0.449
0.0
0.4
0.8
1.2
1.6
3
2
1
1 11 21 31 41 51 61 71 81 91
Observation
1 11 21 31 41 51 61 71 81 91
−
−
11
1
X-bar-S chart of instrument No. 10 / FIGURE 2
Sample
SamplemeanSampleStDev
UCL = 2.1263
UCL = 0.7125
UCL = upper control limit
LCL = lower control limit
StDev = standard deviation
X-bar-S = average/standard deviation
LCL = 1.3165
LCL = 0.1178
S = 0.4151
0.2
0.4
0.6
0.8
2.2
2.0
1.4
1.6
1.8
1
1
2 3 4 5 106 7 8 9
Sample
2 3 4 5 106 7 8 91
−
X = 1.7214
−−
11. January 2015 • QP 9
instrument. Figure 1 shows a couple
slightly outside-of-limits points that
were discovered for instrument No. 10.
2. X-bar-S chart on each subgroup
of 10 measurements.
When plotted in subgroups, how-
ever, the process for instrument No. 10
appears to be in control. Sample 1 in Fig-
ure 2 represents an average of the first
10 observations; sample 2 is the second
10 observations and so on.
3. X-bar-S chart on averages from
all instruments over time
In Figure 3, the point for test day
one represents the average of all the
average values from each instrument on
the first day. This chart could be used to
determine if there are any gross changes
over time in the paper standard itself, or
if there is generally a change in variation
over time between all the instruments’
results taken collectively.
Through the use of this set of control
charts, an analyst will be able to see
data points and data sets outside his-
torical limits. In addition, control charts
are a nice way to detect trends even
before going outside limits.
Scott A. Laman
Senior manager, quality engineering and
risk management
Teleflex Inc.
Reading, PA
ISO 9001:2015 impact
Q: With the upcoming revision to ISO
9001, how will ISO/TS 16949, the techni-
cal specification containing quality
management system requirements for
the application of ISO 9001:2008 in the
automotive sector, be affected? Will
it also be revised in 2015 because it
includes all of the ISO 9001 clauses?
Danny Elmore
San Luis Obispo, CA
Q: The International Automotive Task
Force (IATF) had requested and received
a waiver in 2012 from the ISO Techni-
cal Management Board allowing it to
continue to use the current version of
the ISO 9001 standard in ISO/TS 16949
indefinitely after the release of ISO
9001:2015.
However, in December 2014, the IATF
announced it has formed a team to de-
velop a design specification for the revi-
sion of ISO/TS 16949 to align with the ISO
9001:2015 structure and requirements.
R. Dan Reid
Director of consulting
Omnex Engineering and Management
First delegation leader of IATF
Ann Arbor, MI
RS
Control charts are a nice way
to detect trends even before
going outside limits.
X-bar-S chart across all instruments
over time / FIGURE 3
Test day
SamplemeanSampleStDev
UCL = 1.9317
UCL = 0.3247
UCL = upper control limit
LCL = lower control limit
StDev = standard deviation
X-bar-S = average/standard deviation
LCL = 1.5627
LCL = 0.0537
S = 0.1892
0.1
0.2
0.3
1.9
1.6
1.7
1.8
1
1
2 3 4 5 106 7 8 9
Test day
2 3 4 5 106 7 8 91
−
X = 1.7472
−−
12. QUALITY COUNCIL OF INDIANA
Our Primers contain study material for the current ASQ bodies of
knowledge plus sample questions and answers. The Primers may be
taken into the exam. The completeness of our materials makes them
the most widely used texts for Certification Training.
CQIA
PRIMER
C
CSSBB
PRIMER
C
CQE
PRIMER
C
CQT
PRIMER
C
CSQE
PRIMER
C
CBA
PRIMER
C
CRE
PRIMER
C
CMQ
PRIMER
CQI
PRIMER
C
CCT
PRIMER
C
CQA
PRIMER
C
CQPA
PRIMER
C
CSSGB
PRIMER
CC
PRIMERS
NewCBA
SOLUTIONTEXTSQuality Council of Indiana offers detailed solutions to all
questions presented in the corresponding Primer.
CD-ROMSQCI offers user-friendly interactive software to assist students preparing
for ASQ examinations. Each CD contains 1000 total questions.
Examinations are timed and summarized graphically. A help file provides
explanations and references. The CDs run on Windows XP and newer.
Mail Orders
Quality Council
of Indiana
Order Department
602 W. Paris Ave.
W. Terre Haute, IN 47885-1124
CQE
CQA
CSSGB
Information
812-533-4215
Telephone Orders
800-660-4215
Internet Orders
www.qualitycouncil.com
Fax Orders
812-533-4216
14. P
QP • www.qualityprogress.com12
CUSTOMER EXPERIENCE
In-Person Improvements
NFL looks to technology to delight customers and keep stadium turnstiles moving
KEEPINGCURRE
Professional sports throughout the world—
especially the NFL—are enjoying billions of
dollars in profits, in large part from lucrative
TV contracts.
Advertisers pay top dollar to show com-
mercials to the captive audience the NFL at-
tracts on TV, especially as the league enters
its wildly popular playoff season this month.
The average price tag for a 30-second com-
mercial at this last year’s Super Bowl, for
example, was $4 million.1
DirecTV pays the
NFL $1 billion a season for the rights to all
Sunday afternoon games under an exclusive
deal that runs through the
2015 season.2
Not only does the NFL
want to keep fans’ eyeballs
glued to TV screens, but it
also wants fans’ backsides
sitting in stadium seats. With
fans enjoying built-in creature
comforts at home, including
reliable internet connection
to stay apprised of fantasy
football statistics, NFL teams
know they must evolve
stadiums’ technology-related
offerings to delight customers
and keep that in-stadium revenue flowing.
“TV viewing experience of our games is
so good with the NFL channel, and the Red
Zone, and HD televisions and other options,”
said New York Giants’ owner John Mara.
“We have to give people reasons to want
to come to our games. So, making the in-
stadium experience special and different is
a priority.”3
Ramped-up Wi-Fi infrastructure is an obvi-
ous upgrade for teams to tackle at stadiums.
Many already have addressed infrastructure
issues to accommodate fans’ tweeting, post-
ing on Facebook and Instagram, watching
video, checking fantasy stats and browsing
during time outs and between plays.
Ten of the NFL’s 32 teams, however,
including Green Bay, Baltimore, Cleveland,
Buffalo, Houston, Oakland, San Diego, Wash-
ington, Minnesota and St. Louis, still have no
fan-facing Wi-Fi services at stadiums.
Late last year, the league named Extreme
Networks as its “first official Wi-Fi solutions
provider” to work with teams to deploy the
needed infrastructure to upgrade stadium
Wi-Fi capabilities. “We’ve given all our clubs
a goal of the 2015 season to be up to par
with Wi-Fi in the bowl areas as well as
upgrading their mobile carrier networks.
Most are on track to do that,” said NFL CIO
Michelle McKenna-Doyle.4
Bold boards and more
Other teams have gone further to elicit that
customer “wow” by upgrading and enlarg-
ing stadium video boards. Maybe not to
the extent the Dallas Cowboys did in 2009,
when the team installed the world’s largest
high-definition LED video display at AT&T
Stadium,5
still many teams have invested in
what stadium visitors have come to expect:
high-definition, big-screen boards that
provide more than just statistics and score
updates, but high-quality game replays and
other entertainment.
Just a few examples of other recent tech-
nology upgrades teams have implemented
in an attempt to delight NFL customers
include:
• The San Francisco 49ers introduced a new
team app that offers exclusive replays, as
well as food ordering and delivery to all
seats for fans who visit its stadium.6
• The Miami Dolphins offer an app for fans
to receive location-based notifications to
direct them to their seats from the en-
trance of the stadium, locate the closest
food and beverage options and alert them
if a concession line is shorter at another
location.7
Other teams are investigating
how to apply this technology to help fans
find nearby restrooms with short lines.
• The Cowboys unveiled a new fan experi-
ence board (separate from its mega video
display mentioned earlier) that rotates 360
degrees and connects fans in the stadium
through an app. By pressing the team logo
on their mobile devices, fans can activate
the scoreboard to flash and vibrate, which
culminates in a big boom. This gives fans
another way to create noise and believe
they are influencing the game.8
Improvements at Wembley
NFL teams may want to take note of what’s
happening at London’s famed Wembley
Stadium, which just signed a multiyear deal
with Britain’s largest digital communications
company to provide the venue the world’s
fastest mobile data network. Wembley also
15. January 2015 • QP 13
NT
has made major technological advancements in mobile ticketing
and contactless payments devices that use radio-frequency identifi-
cation for making secure payments at all concession and merchan-
dise stands. High-tech terminals also are already being installed
throughout the stadium to support mobile payments.9
In addition, an innovative lighting system in the stadium’s arch
was recently unveiled and features the world’s fastest interactive LED
lighting system. It’s equipped to respond at unparalleled speeds to
event noise, crowd reaction and points scored inside the stadium.10
“Certainly a full stadium is the best fan and game experience so
we do need to focus on making sure that happens,” McKenna-Doyle
said. “Keeping it compelling and special will help us sell tickets.”11
“We need to make sure our content is fresh, relevant and avail-
able on multiple platforms” to keep fans coming in through the
turnstiles, she said.12
Without adequate “people” resources behind the scenes to pro-
vide service to customers, however, any technology can fall flat and
backfire.
“We stress that it’s not about the technology, but about the fan ex-
perience,” McKenna-Doyle said. “It has to be operationally sound, and
it has to be integrated with being at the game. If it’s not something
that’s operationally sound, you might be better off not doing it.”13
—compiled by Mark Edmund, associate editor
REFERENCES
1. Brett Schrotenboer, “NFL Takes Aim at $25 Billion, But at What Price?” USA Today, Feb. 5,
2014, www.usatoday.com/story/sports/nfl/super/2014/01/30/super-bowl-nfl-revenue-denver-
broncos-seattle-seahawks/5061197.
2. Joe Flint, NFL TV Package May Be Fair Game,” Los Angeles Times, Jan. 1, 2014, http://articles.
latimes.com/2014/jan/01/business/la-fi-ct-nfl-sunday-ticket-20140101.
3. Louie Lozano, “The 4 NFL Stadiums With the Most Advanced Technological Amenities,” Sport
Techie, Sept. 14, 2014, www.sporttechie.com/2014/09/14/the-4-nfl-stadiums-with-the-best-
technological-amenities.
4. Edward C. Baig, NFL Goal: Better Wi-Fi in Stadiums,” USA Today, Nov. 19, 2014, www.usatoday.
com/story/tech/columnist/baig/2014/11/19/nfl-hopes-to-boost-wifi-in-stadiums-via-extreme-
networks/19285451.
5. Lozano, “The 4 NFL Stadiums With the Most Advanced Technological Amenities,” see refer-
ence 3.
6. Paul Kapustka, “Stadium Tech Report—NFL Stadium Technology Reports—NFC West,” Mobile
Sports Report, Nov. 17, 2014, www.mobilesportsreport.com/2014/11/stadium-tech-report-nfl-
stadium-technology-reports-nfc-west.
7. Darrin Heitner, “Miami Dolphins Lose on Field But Win With New Qualcomm Location-Driven
Partnership,” Forbes, Dec. 13, 2013, www.forbes.com/sites/darrenheitner/2013/12/30/miami-
dolphins-lose-on-field-but-win-with-new-qualcomm-location-driven-partnership.
8. Lozano, “The 4 NFL Stadiums With the Most Advanced Technological Amenities,” see refer-
ence 3.
9. Kate Cahill, Wembley Introduces New Era of Stadium Technology With High-Tech Makeover,”
Sport Techie, Nov. 27, 2014, www.sporttechie.com/2014/11/27/wembley-introduces-new-era-
of-stadium-technology-with-high-tech-makeover.
10. Ibid
11. Todd R. Weiss, “The NFL is Urging Teams to Use Technology to Improve the Fan Experience
at Games,” CITEWorld, Jan. 16, 2014, www.citeworld.com/article/2115685/mobile-byod/nfl-
cio-michelle-mckenna-doyle.html.
12. Ibid.
13. Paul Kapustka, “NFL’s CIO Says Teams Need to Share Technology Know-how,” Nov. 20, 2014,
Mobile Sports Report, www.mobilesportsreport.com/2014/11/nfls-cio-says-teams-need-to-
share-technology-know-how.
BALDRIGE AWARD
2014 BALDRIGE AWARD
RECIPIENTS NAMED
Four organizations from three different categories have been
named recipients of the 2014 Malcolm Baldrige National Qual-
ity Award.
The recipients, announced in mid-November, are:
• PricewaterhouseCoopers Public Sector Practice, McLean,
VA (service category).
• Hill Country Memorial Hospital, Fredericksburg, TX (health-
care category).
• St. David’s HealthCare, Austin, TX (healthcare category).
• Elevations Credit Union, Boulder, CO (nonprofit category).
“The Baldrige Program is one of the key ways that the U.S.
Commerce Department is helping to recognize U.S. organiza-
tions that strive to have world-class operations,” U.S. Com-
merce Secretary Penny Pritzker said while announcing the
2014 recipients.
“These honorees are the role models of innovation, sound
management, employee and customer satisfaction, and re-
sults. I encourage organizations in every sector to follow their
lead.”
A ceremony honoring the organizations will take place
during the 27th Quest for Excellence Conference in April in
Baltimore. For more background on this year’s recipients, visit
www.nist.gov/baldrige/baldrige-award-111214.cfm.
Eye on 2015 award
For next year’s awards, Baldrige organizers have begun solicit-
ing applications for program examiners. Baldrige examiners are
part a group of more than 400 professionals who help evaluate
award applicants.
Those selected will be trained on the Baldrige criteria at
sessions in May. Applications to become an examiner are due
Jan. 8. For more information, visit www.nist.gov/baldrige/
examiners/index.cfm.
There are several deadlines approaching that are related to
applying for the award itself. An eligibility certification pack-
age—with or without a nomination to the board of examin-
ers—is due Feb. 23. The award application package is due April
28, and 25 copies of the application material are due May 12.
For more details about the application process and related
fees, visit www.nist.gov/baldrige/enter/how_to_apply.cfm.
16. QP • www.qualityprogress.com14
KEEPINGCURRENT
ASQNEWS
ASQ ACCEPTS AWARD ASQ ac-
cepted the Wisconsin Forward
Award at a ceremony last month in
Madison. The state quality award is
modeled on the Malcolm Baldrige
National Quality Award frame-
work, process and criteria. Three
other Wisconsin organizations were
recognized along with ASQ, which
achieved the excellence level of
achievement—the state award’s top recognition. For more informa-
tion about the award, visit www.wisquality.org.
NEW BLOGGERS Three new bloggers joined ASQ’s Influential
Voices group, quality professionals and online influencers who regu-
larly comment and share information on quality-related topics and
ideas in a collection of personal blogs. The new bloggers are Sunil
Kaushik, Luciana Paulise and Pam Schodt. See their profiles and find
links to their respective blogs at http://asq.org/voice-of-quality.
ITEA CHANNEL ADDED ASQ TV recently launched the Interna-
tional Team Excellence Award channel, which includes 30 video
recordings from sessions at the 2014 ASQ World Conference on
Quality and Improvement. Visit http://videos.asq.org/main/shop for
more details.
ANAB REBRANDING The ANSI-ASQ National Accreditation Board
(ANAB) is moving to the single brand ANAB from the current three
brands: ANAB, ACLASS, and FQS. The ANAB rebranding will take
place over an extended period to avoid confusion as customers
move from using the current accreditation symbols to the new
ANAB accreditation symbols. The ANSI-ASQ National Accreditation
Board made the change internally effective on Jan. 1. For more
information, visit www.anab.org/news/2014/ansi-asq-national-
accreditation-board-to-move-to-single-anab-brand.
NEW CASE STUDY ASQ’s Knowledge Center released a new case
study that showcases a mining company in Brazil using the define,
measure, analyze, improve and control method and a variety of
quality tools to cut inefficiencies and save $8 million. Read the case
study at http://asq.org/knowledge-center/case-studies-
production-cost-efficiency-mining.html.
NAME: Abhijit Sengupta.
RESIDENCE: Alpharetta, GA.
EDUCATION: Doctorate in engineering.
FIRST JOB RELATED TO QUALITY: Sengupta worked
as a supplier quality engineer at Ford Motor Co.
CURRENT JOB: Regulator for the U.S. Nuclear Regula-
tory Commission (USNRC).
PREVIOUS JOB: Sengupta
has worked as a qual-
ity manager at Black and
Veatch, a senior project
engineer at General Motors,
and as a design engineer
and Six Sigma Black Belt at
Ford Motor Co.
ASQ ACTIVITIES: Sengupta is a past treasurer for the
Detroit Section and currently is membership chair for
the Energy and Environmental Division. For more than
a decade, he has proctored ASQ exams for the Detroit
and Atlanta chapters. He is an ASQ-certified quality
engineer, auditor, reliability engineer and Six Sigma
Black Belt.
OTHER ACTIVITIES/ACHIEVEMENTS: Sengupta has
been published in several engineering magazines. He
is also involved in other professional organizations
such as the American Society of Mechanical Engi-
neers and the American Nuclear Society.
RECENT HONORS: Sengupta has received a perfor-
mance award from the USNRC.
FAVORITE WAYS TO RELAX: Tennis, running and
traveling.
QUALITY QUOTE: Quality is part of our daily personal
and professional lives.
Disclaimer: This does not represent any USNRC position and it is in no
way related to USNRC.
QWho’s Who in
2 0 1 4
ASQ Receives
Excellence Level of Achievement
17. January 2015 • QP 15
Mr. Pareto Head BY MIKE CROSSEN
DATEINQUALITY
HISTORY
QP occasionally looks back on an event or
person that made a difference in the history
of quality.
Jan. 15, 1987
Bob Galvin, long-time CEO and board
chairman of Motorola, launched a long-term
quality program called “The Six Sigma Qual-
ity Program” on this date. The program was
billed as a corporate program that estab-
lished Six Sigma as the required capabil-
ity level to approach the standard of 3.4
defects per million opportunities (DPMO).
The 3.4 DPMO standard was intended
to be used in every function at Motorola:
products, processes, services and adminis-
tration. Motorola’s corporate policy commit-
tee updated its quality goal to reflect this
standard:
Everyone was responsible for each other
and to each other regarding this objective.
The goal also affirmed that no one could
assume he or she had done enough until
the entire goal of Six Sigma was achieved
companywide.
SOURCE
Process Quality Associates, www.pqa.net/ProdServices/
sixsigma/W06002009.html (case sensitive).
EDUCATION
10 TEAMS HONORED AT NQEC
Universidad Tecnológica Nacional in Buenos Aires, Argentina, received the highest
honor at the ASQ Education Team Excellence Recognition Awards late last year for us-
ing quality improvement tools to make a positive impact on its staff.
The awards highlight best practices in education quality improvement and were an-
nounced at the 22nd annual National Quality Education Conference (NQEC) in Milwau-
kee. Other award recipients recognized at the event include:
• Chicago Public School District.
• Deer Valley Unified School District, Phoenix.
• Denver Public Schools (two awards).
• Kimberly Area School District, Kimberly, WI.
• Ingenium Charter Elementary and Middle School, Canoga Park, CA.
• Ribbaschool, Gränna, Sweden.
• Siegrist Elementary, Platte City, MO.
• University of Wisconsin-Stout, Menomonie.
To read more about the recipients and their projects, visit http://tinyurl.com/pnbdugg.
The number of people elected as fellows by the
American Association for the Advancement of Sci-
ence (AAAS) council. They will be recognized for
their contributions to science and technology
next month at the fellows forum during the AAAS
annual meeting in San Jose, CA. For a complete
roster of new AAAS fellows, visit www.aaas.org/
news/new-aaas-fellows-recognized-their-contribu-
tions-advancing-science.
401
BYTHENUMBERS
18. Remembering
Armand V. Feigenbaum,
integrator of quality into
organizational management
by Gregory H. Watson
Total
Quality’s
Leader
FEIGENBAUM WAS presented with the National Medal of
Technology and Innovation by President George W. Bush
at a 2008 ceremony at the East Wing of the White House.
The National Medal is the highest honor of technological
achievement for America’s leading innovators.
19. QP • www.qualityprogress.com2
Headline Goes
In This Area
FIRST THREE WORDS are Vectora Bold 18 pt all
cap. Ullamet iustrud dipit nulla alit nonsecte modolenibh eum
at, quat. Ibh eui ea faccumsan henim atue magna faccum quat.
Odolortio odo dolor alit ipis at, con utatuer ad tat luptatumsan
enissecte molendrem iriure er acil eu feum eummolobor iurem
er sim quatet illa facidunt wisi.
Gait nullam quat. Ut inibh ero ex exerostrud tat nos autet ex
ea feugiat iusto consed tatie dolorper iril utat etueraessis ex
eugiamc onulpute modoloreet lum augueril dit vulputem venit,
sit nulput ut voloborper illa feum vendrer cincipi sisit, conse
erciduis dolorperos nulputpatum dolor iusto odolore rciniat,
se venis ad dunt lum ip ea facidunt ea am, veleniam volortinit
In 50 Words
Or Less
• Text for 50 words or
less is Vectora Roman
9 on 11 with hanging
indents.
• Text for 50 words or
less is Vectora Roman
9 on 11 with hanging
indents.
• Text for 50 words or
less is Vectora Roman
9 on 11 with hanging
indents.
• Text for 50 words or
less is Vectora Roman
9 on 11 with hanging
indents.
Deck goes here
by Author Name
January 2015 • QP 17
ARMAND VALLIN FEIGENBAUM, or “Val” to his
many friends, was born in a different era. In his youth, he worked
as a toolmaker for General Electric (GE), and he took advantage of
GE’s exceptional educational benefits to earn a bachelor’s degree
in engineering from Union College in Schenectady, NY, followed
by a master’s degree and doctorate in engineering economics from
Massachusetts Institute of Technology in Cambridge.
TRIBUTE
Photo courtesy of the Berkshire Eagle (Pittsfield, MA)
20. QP • www.qualityprogress.com18
His early career was spurred by the shortage
of engineers during World War II, and he rose rap-
idly in the GE management structure to become
director of manufacturing and quality, a position
he held for 10 years prior to founding General Sys-
tems with his brother, Donald.
Feigenbaum is best known for the multiple edi-
tions of his classic book Total Quality Control,1
which was an expansion of an article he wrote for
Harvard Business Review in 1956.2
Feigenbaum
passed away on Nov. 13 at the age of 94.
Quality pioneer
Among his major recognitions are bestowal of
the National Medal of Technology by President
George W. Bush, election to the National Acad-
emy of Engineering, three honorary doctorates,
and selection as an honorary member by ASQ and
the International Academy for Quality (IAQ).
Feigenbaum contributed his energy to the
quality movement from its beginning. He was a
pioneering member of ASQ and the only individual who
has served as its president for two terms. As GE sought
to reconstruct its European operations following the
World War II, Feigenbaum focused his effort on rebuild-
ing the manufacturing and quality competence of Eu-
rope, where he was a
catalyst in establish-
ing the European Or-
ganization for Qual-
ity (EOQ).
Along with his
international qual-
ity colleagues, Kaoru
Ishikawa (represent-
ing the Union of Jap-
anese Scientists and
Engineers [JUSE]
and Walter A. Mas-
ing (representing the
EOQ), Feigenbaum
was one of three individuals who are credited as found-
ers of IAQ. In reflection, Feigenbaum’s life serves as a
role model of total commitment to quality.
GE: A stimulating intellectual environment
Early in his career, Feigenbaum was privileged to work
for a company that not only respected education, but
also strongly encouraged it. At that time, GE was an ex-
ceptionally rich environment where the pursuit of con-
tinual improvement pervaded everything. This culture
stimulated innovation centered on development of engi-
neering methods for production and its related support-
ing systems.
Following his project management work, Feigen-
baum was a key executive in the development of the GE
internal learning center at Crotonville, NY. In this highly
inspiring environment, Feigenbaum’s contemporaries
also contributed ideas that merged into his total quality
perspective:
Ralph E. Wareham (1914-2006) considered him-
self a quality engineer. After receiving a bachelor’s de-
gree in mathematics from the University of Iowa, Ware-
ham joined GE and worked in quality. He studied under
Walter A. Shewhart through an exchange program that
GE maintained with AT&T Bell Laboratories.
Wareham authored the chapters on statistics that
are included in Feigenbaum’s 1951 book Quality Con-
trol3
(this book provided the core of Feigenbaum’s later
book, Total Quality Control, first published in 1961).4
Wareham was one of the six instructors for the course in
statistical process control that was developed by Eugene
L. Grant for manufacturing sites across American during
the war years.
Wareham was the second president of ASQ and ran
FEIGENBAUM IS best known for his book, Total
Quality Control.
IN 1968, Feigenbaum and his brother, Donald (left), founded General
Systems, an engineering firm that designed and installed operational
systems for corporations.
21. January 2015 • QP 19
the young society from his kitchen table. He demon-
strated total commitment to quality by remaining active
in ASQ until his death. Wareham’s emphasis on statisti-
cal methods to control quality provided a key element of
Feigenbaum’s approach to total quality.
Harry A. Hopf (1882-1949) considered himself a
management engineer. He applied the principles of sci-
entific management to white-collar work, and in 1953,
GE published a collection of the papers that he wrote in
the decades of the 1930s and 1940s as New Perspectives
in Management.5
The collection of Hopf’s papers illustrates the ap-
plication of scientific management principles to GE’s
life insurance business. It’s interesting to note how he
emphasized building a sound measurement system and
participative management to guide the processes of or-
ganizations, as statistical methods and human relations
are cornerstones of the modern quality movement.
“The power of decision making should be placed as
closely as possible to the point where action originates,”
Hopf wrote.6
In this emphasis, he echoes Mary Parker
Follett (author of The Creative Experience)7
and Chester
I. Barnard (author of The Functions of the Executive).8
Hopf’s extension of the principles of scientific manage-
ment and integration with participative ideas contributed
two elements to Feigenbaum’s approach to total quality.
Lawrence D. Miles (1904-1985) considered him-
self a value engineer. He worked in GE purchasing to
improve productivity and cost of supplied material, and
described his method in Techniques of Value Analysis.9
Miles’ approach to value engineering applied creativity
tools such as brainstorming, as first popularized by Alex
F. Osborne (author of Applied Imagination)10
to develop
alternative, lower-cost ways to provide the same function-
ality in products through different material use or design
changes. Currently, value engineering is required in all
major procurements by the U.S. Department of Defense.
Miles’ emphasis on cost effectiveness of operations
and materials also enriched Feigenbaum’s idea of total
quality. In a 2006 QP interview,11
Feigenbaum acknowl-
edged that value engineering was making a major contri-
bution to the tool kit used for total quality improvement.
Blending a coherent systems approach
Feigenbaum’s ideas also were stimulated by a variety of
peers within the original post-World War II quality com-
munity. Many were pioneers in establishing the Ameri-
can Society for Quality Control (ASQC, ASQ’s original
name), and several engaged in the creation of the IAQ.
These individuals included: Leon Bass, Charles A.
Bicking, Paul C. Clifford, Simon Collier, W. Edwards
Deming, George D. Edwards, C. Eugene Fisher, Joseph
M. Juran, E. Jack Lancaster, Sebastian B. Littauer, Julius
Y. McClure, Thomas C. McDermott, Ellis R. Ott, William
R. Pabst, Leslie Simon and Shewhart.
These individuals were actively engaged in develop-
ing the core of the modern quality body of knowledge
(QBoK), and their engagement evolved out of activities
that were related to the support of wartime industries.
Prior to Feigenbaum’s development of the concept of
total quality, there were two dominant schools of quality
thinking:
1. During the first half of the last century, Deming, Har-
old F. Dodge, Grant, Ott, Harry Romig and Shewhart
focused on using statistical methods to achieve high-
quality products through a combination of acceptance
testing and statistical process control.
2. In the early 1950s, Deming, Juran and Peter Drucker
emphasized management-based systems for improv-
ing manufacturing performance and business practic-
es with stronger emphasis placed on human relations
aspects.
TRIBUTE
MODEL TRAINS were a hobby Armand and Donald began as children.
22. QP • www.qualityprogress.com20
Feigenbaum served as an intellectual systems integra-
tor for quality thinking. He advanced technology man-
agement by defining a new approach to quality based on
economics, industrial engineering, which included the
emerging engineering discipline related to systems, and
management science. He combined this with preexisting
statistical and management knowledge, and the resulting
integration was called total quality.
Personal intellectual contribution
Key contributions by Feigenbaum were documented in
his 1961 book, Total Quality Control, which has under-
gone updates in three editions to maintain its currency
during the past 50 years.12
According to Feigenbaum,
quality must be emphasized because of three factors:
1. Customers keep increasing their requirement for qual-
ity performance of products and services. This greatly
amplifies competition for market-share gains by deliv-
ering perceivably greater value than is available from
other suppliers of similar products or services.
2. Due to the increased demand for higher-quality prod-
ucts, traditional approaches, practices and techniques
for delivering quality results become obsolete, and
quality performance can no longer be considered as
value adding. Rather, it has become a baseline qualifi-
cation in commercial competition.
3. Quality costs are not visible, but hidden in the mana-
gerial financial reports of most organizations. These
costs are often higher than the bottom-line profit
achieved for the products. For some organizations,
these costs may be so high as to undermine their com-
petitive position in the market.
Feigenbaum said that if these are the factors that mo-
tivate management to develop a strong quality capability,
total quality control (TQC) is the answer for ensuring an
organization has a robust system that delivers quality in
all areas of its business operations. So, what did he mean
by TQC?
Total quality control
Feigenbaum defined TQC as: “An effective system for in-
tegrating the quality development, quality maintenance
and quality improvement efforts of the various groups in
an organization so as to enable production and service
at the most economical levels which allow full customer
satisfaction.”13
Consider each word in the phrase “total quality control”
and what it contributes to the overall definition of TQC:
Total: Feigenbaum believed the total engagement of
an organization is required to ensure quality. By this, he
meant everyone, at all layers of the organizational struc-
ture and across all functional areas, has a duty to ensure
the quality of his or her work and the outcome provided
to external customers.
In this way, quality is not merely delegated to factory
workers, with the rest of the organization able to disen-
gage from the work required to deliver the consistently
high value that satisfies customers. Feigenbaum identi-
fied this effort as a “prime responsibility of general man-
agement and of the operations of marketing, engineer-
ing, production, industrial relations, finance and service,
as well as the quality control function itself.”14
Quality: Feigenbaum said that, “Quality is, in its es-
sence, a way of managing the organization.”15
The core
ideology of Feigenbaum’s systematic approach is sum-
marized using the following concepts of quality:
• Quality is an organizationwide process.
• Quality is what the customer says it is.
• Quality and cost are a sum, not a difference.
• Quality requires individual and teamwork zealotry.
• Quality is a way of managing.
• Quality and innovation are mutually dependent.
• Quality is an ethic.
• Quality requires continuous improvement.
• Quality is the most cost-effective, least capital-inten-
sive route to productivity.
• Quality is implemented as a total system connected
to both customers and suppliers.
Feigenbaum’s quality emphasizes the customer-ori-
ented activities of the organization and requires that the
internal activities be conducted in a disciplined way so
control of the outcome quality is maintained at the level
of customer expectation.
Control: Feigenbaum defined control as “a process
for delegating responsibility and authority for a manage-
ment activity while retaining the means of assuring sat-
isfactory results.”16
He described four steps to develop
control in a process:
1. Setting standards.
2. Appraising conformance.
3. Acting when necessary.
4. Planning for improvements.
Feigenbaum’s development of the idea of total quality
was influenced by individual thought leaders, as well as
the post-war atmosphere following World War II. To learn
more about these topics, read the online-only sidebars “In-
23. January 2015 • QP 21
tellectual Precursors to Total Quality,” “Post-War Atmo-
sphere of Collaborative Transformation” and “Evolving
the Concept of Total Quality,” which are available on this
article’s webpage at www.qualityprogress.com.
Consistent results require leadership
Feigenbaum recommended that business leaders ap-
proach quality improvement by using a set of imperatives
for focusing improvement efforts and driving actions—
that they emphasize management innovation based on
the principle that whatever you do to make quality better
makes everything else better.
This view of improvement from a management leader-
ship point of view involves:
• Making quality leadership a business centerpiece for
revenue growth and competitive strength.
• Delivering value to customers as the motivation for
improvement action.
• Achieving complete customer quality satisfaction,
which drives buyer acceptance.
• Developing effective supplier and other business
quality partnerships.
• Maximizing the effectiveness of quality data.
• Accelerating sales and earnings growth through qual-
ity cost management.
• Forming an integrated quality system that builds
customer, producer and supplier relationships.
• Encouraging the use of tools and resources to create
an individual quality improvement emphasis.
• Recognizing that quality is an international business
language.
• Ensuring quality leadership is a foundation for suc-
cessful ethical behavior.
Unfortunately, standard measurement systems often
hide the real impact of quality losses from examination by
management because allocation methods in accounting
practice fail to identify the sources of problems of exces-
sive cost and obscure the causal relationship for actions
that are the results of responses to poor quality.
Total quality requires that everyone take responsibility
for the effect of their work on the level or degree of quality
that is perceived by the customer—emphasizing not only
the quality of a product’s performance, but also the degree
to which it accomplishes the customer’s requirements.
Quality cost
By using the language of finance and introducing the con-
cept of quality cost, Feigenbaum emphasized that quality
must be actively managed and have visibility at the high-
est levels of management. When Shewhart introduced
economic cost in his 1931 book, Economic Control of
Quality of Manufactured Product,17
he was focused on
the cost of scrap and rework that occurred when prod-
ucts were not produced right the first time.
Feigenbaum extended this idea to include the sum
of direct and indirect costs of doing business in a way
that creates customer dissatisfaction. This emphasis was
totally new and not found in the prior works of either
Grant or Shewhart.
Philip B. Crosby later became renowned for his ex-
pansion on the cost of nonconformance and cost of poor
quality, but he credited Feigenbaum with the origination
of this concept. Subsequently, Genichi Taguchi extended
TRIBUTE
BORN IN 1920, Feigenbaum’s early career was spurred by a
shortage of engineers during World War II. He’s shown here
as a boy with his younger brother, Donald (left).
24. QP • www.qualityprogress.com22
Feigenbaum’s concept to include the costs incurred by
society after it is released to society.
Hidden plant
A related contribution from Feigenbaum was his concept
of the “hidden plant,” which generates waste and cost of
quality. This happens when extra work is performed to
correct mistakes in production control and is due to:
• Poorly worded orders that don’t get the customer’s
requirements right.
• Time that is wasted in searching for lost parts or
replacing parts of poor quality.
• Activities required to expedite performance when
schedules are not met for various reasons.
When considering all of these activities, Feigenbaum
estimated that up to 40% of a plant’s ideal production ca-
pacity may be lost because things are not done correctly.
He identified this loss with what he called the “hidden
plant”—a “factory” that loses money within the factory
that produces the products.
The idea of the hidden factory still exists today and
can be observed in the loss of process capacity for pro-
ductive output. In plants in which efforts to reduce waste
through quality and lean methods are not practiced, this
loss may still be as high as 40% of the designed produc-
tion capacity. The concept of the hidden plant helps to
crystallize the loss that occurs when quality is not right
from the viewpoint of the consumer customer and the
shareholder.
Feigenbaum’s legacy
Feigenbaum’s legacy comes from the integration of qual-
ity concepts into a system for management of an organi-
zation. In his book, What is Total Quality Control? The
Japanese Way, Ishikawa credited Feigenbaum’s ideas
with stimulating the Japanese approach to quality.18
The Japanese system for TQC integrated the teachings
of Deming, Drucker and Juran into their concepts along
with the motivational ideas of Frederick I. Herzberg and
Abraham Maslow—all interpreted within the context of
Japanese tradition and culture.
Feigenbaum’s systemic approach also can be observed
in the framework created for criteria of the Malcolm Bal-
drige National Quality Award, which codified his compre-
hensive approach to quality as a business issue.
While no specific tool can be attributed to Feigen-
baum, he delivered to our community something per-
haps richer: a broader way of thinking about our work
and its importance in the activities of mankind. From all
of us, thank you, Val. QP
REFERENCES
1. Armand V. Feigenbaum, Total Quality Control, McGraw-Hill, 1961, 1983 and
1991.
2. Armand V. Feigenbaum, “Total Quality Control,” Harvard Business Review,
November-December 1956, pp. 93-100.
3. Armand V. Feigenbaum, Quality Control, McGraw-Hill, 1951.
4. Feigenbaum, Total Quality Control, see reference 1.
5. Harry A. Hopf, New Perspectives in Management, Hopf Institute of Manage-
ment/General Electric Co., 1953.
6. Ibid.
7. Mary Parker Follett, The Creative Experience, Longmans, Green and Co., 1924.
8. Chester I. Barnard, The Functions of the Executive, Harvard University Press,
1938.
9. Lawrence G. Miles, Techniques of Value Analysis, third edition, Lawrence G.
Miles Value Foundation, 1989.
10. Alex F. Osborne, Applied Imagination, Bombay, 1961.
11. Thomas M. Kubiak, “Feigenbaum on Quality: Past, Present, and Future,” Qual-
ity Progress, November 2006, pp. 57-62.
12. Feigenbaum, Total Quality Control, see reference 1.
13. Ibid.
14. Ibid.
15. Ibid.
16. Ibid.
17. Walter A. Shewhart, Economic Control of Quality of Manufactured Product,
ASQ Quality Press, 1931.
18. Kaoru Ishikawa, What is Total Quality Control? The Japanese Way, Prentice-
Hall, 1988.
BIBLIOGRAPHY
Feigenbaum, Armand V., “Changing Concepts and Management of Quality
Worldwide,” Quality Progress, December 1997, pp. 45-48.
Feigenbaum, Armand V., “How to Manage for Quality in Today’s Economy,” Qual-
ity Progress, May 2001, pp. 26-27.
Feigenbaum, Armand V., “Is It Any Surprise? World Class Companies Are Re-
markably Similar!” Journal of Quality and Participation, March 1992, pp. 10-12.
Feigenbaum, Armand V., “Raising the Bar,” Quality Progress, July 2008, pp. 22-27.
Feigenbaum, Armand V., “The Power Behind Consumer Buying and Productivity,”
Quality Progress, April 2002, pp. 49-50.
Feigenbaum Armand V. and Donald S. Feigenbaum, “The Future of Quality:
Customer Value,” Quality Progress, November 2004, pp. 24-29.
Stratton, Brad, “Connecting With Customers and Other Sage Advice,” Quality
Progress, February 1996, pp. 58-61.
Watson, Gregory H., “Feigenbaum’s Enduring Influence,” Quality Progress,
November 2006, pp. 51-55.
Watson, Gregory H., “Total Quality—Total Commitment,” Quality Progress,
November 2008, pp. 20-26.
TRIBUTE
GREGORY H. WATSON is chairman of Business Excellence
Solutions Ltd. in Finland. He is an ASQ past chair and fel-
low, and a past-president and honorary member of the
International Academy for Quality.
A LEGACY LIVES ON
Feigenbaum’s ideas about total quality control and influence on the
quality world live on in the articles he authored for ASQ publications and
in articles discussing his contributions. Find pieces he wrote for ASQ pub-
lications by visiting bit.ly/ASQauthoredarticles (case sensitive) as well as
those discussing his contributions to quality at bit.ly/qualitycontributions,
and read more about his career by visiting bit.ly/aboutcareer.
25. QP • www.qualityprogress.com1
Headline Goes
In This Area
FIRST THREE WORDS are Vectora Bold 18 pt all
cap. Ullamet iustrud dipit nulla alit nonsecte modolenibh eum
at, quat. Ibh eui ea faccumsan henim atue magna faccum quat.
Odolortio odo dolor alit ipis at, con utatuer ad tat luptatumsan
enissecte molendrem iriure er acil eu feum eummolobor iurem
er sim quatet illa facidunt wisi.
Gait nullam quat. Ut inibh ero ex exerostrud tat nos autet ex
ea feugiat iusto consed tatie dolorper iril utat etueraessis ex
eugiamc onulpute modoloreet lum augueril dit vulputem venit,
sit nulput ut voloborper illa feum vendrer cincipi sisit, conse
erciduis dolorperos nulputpatum dolor iusto odolore rciniat,
se venis ad dunt lum ip ea facidunt ea am, veleniam volortinit
In 50 Words
Or Less
• Text for 50 words or
less is Vectora Roman
9 on 11 with hanging
indents.
• Text for 50 words or
less is Vectora Roman
9 on 11 with hanging
indents.
• Text for 50 words or
less is Vectora Roman
9 on 11 with hanging
indents.
• Text for 50 words or
less is Vectora Roman
9 on 11 with hanging
indents.
Deck goes here
by Author Name
January 2015 • QP 23
Narrow(er)
FOCUS
WHEN TEACHING failure mode and effects analysis
(FMEA), I start by determining who in the class has participated in
creating one. Typically, more than half of the students raise their
hands. Next, I ask how useful or accurate their FMEAs were. Re-
sponses usually include grumbling, a few shrugged shoulders and
at least one thumbs-down. Rarely do I receive a positive response.
Finally, I ask how much fun the FMEAs were. This question always
produces a round of laughter and more thumbs-downs.
FMEA
Tapping into a powerful
new method to better
identify potential failure modes
by James R. Kotterman
In 50 Words
Or Less
• Failure mode and effects
analysis often falls short
of expectations because
too many potential fail-
ure modes (PFM) are be-
ing explored, sidetracking
teams and their analyses.
• A new approach elimi-
nates inappropriate
failure modes, narrowing
the number of PFMs to
a manageable amount
and helping teams better
manage the FMEA pro-
cess.
26. QP • www.qualityprogress.com24
Virtually everyone recognizes the potential value,
power and utility of FMEAs, but rarely do they see that
potential realized. Frequently, I hear creating an FMEA
is time consuming, torturous and often confrontational,
and the end product never meets expectations. Team
members become tired and frustrated, and the over-
arching goal evolves into simply finishing it. If you feel
an affinity, rejoice. It doesn’t have to be this way.
Three problems
There are three common FMEA problems. The first
two are performing the wrong depth of analysis and
working without a process map. When you correctly
address these first two problems, you can seamlessly
avoid the third problem, which I believe to be the most
serious: identifying the potential failure mode (PFM).
To resolve this third issue, there’s the 7PFM failure
model, a significantly different approach that resolves
failure mode identification issues.
To begin, focus on creating a process map. The
abridged FMEA process map in Figure 1 doesn’t ad-
dress preparation, team selection, customizing sever-
ity, occurrence and detection (SOD) scales or taking
action. These are important, but not the focus of this
article. The steps are predicated on rapidly building a
robust FMEA by resolving the three problems.
First, however, I want to address the debate sur-
rounding construction by row versus by column. I was
taught to use columns, but camps appear to be split
about 50-50. Approaches really should be combined.
The team begins with failure modes, working in
columns. Next, the team populates the effects, causes
and controls columns, working in rows. When a fail-
ure mode has multiple effects, causes or controls,
however, the team completes the effects, causes and
controls in columns for that failure. Next, the team
continues on with the rows or to the next failure mode.
The last thing the team does is score the SOD scales in
columns. Combining approaches will create continuity
within each process step.
Because all FMEA types generally possess the same
structure and problems, the techniques presented in
this article apply to all FMEA types. For example, in
place of a process map, design FMEAs can use a design
document, such as a boundary diagram.
Problem one: depth of analysis
Problem one concerns the depth of analysis the FMEA
must focus on (process map step one). Too often,
teams dig too deeply. The intended use of the FMEA
determines the depth of evaluation. Typically, it is the
FMEA requester or owner who establishes the appro-
priate scope and level of analysis with the help of the
FMEA team leader and a quality leader.
Analysis depth can be defined as system level, sub-
system level or component level. In class, I frequently
describe FMEA focus as analysis at the 10,000-meter
level working down to the molecular-component level.
Often, I encounter an FMEA team that needs its FMEA
to focus at the 10,000-meter level, but the team is deter-
mined to identify actions at the molecular level. This
results in a huge FMEA and much wasted time, effort
and frustration for everyone.
Typically, those who know the process extremely well
feel compelled to take the deep dive and identify every
possible molecular-level problem they have ever seen or
imagined. These subject matter experts (SME) just can’t
stop thinking about part transfers, clamping, coolant and
the limit-switch arm that fell off in 2008. As the team digs
deeper into the process, it begins to experience exponen-
tial increases in failure complexity. This complexity leads
to all sorts of frustration and problems.
When the FMEA is focused on a specific problem
in a specific location, the focus will be at the molecu-
lar level—for example, Six Sigma projects. To find the
FMEA process map / FIGURE 1
1. Identify need,
scope and level of
anaylsis.
2. Develop and
confirm process map.
3. Prepopulate
process steps,
requirements and
failure mode columns.
4. Eliminate potential
failure modes
by column.
5. Populate effects,
causes and controls
columns by row and
by column.
6. Score severity,
occurrence and
detection scales
by column.
FMEA = failure mode and effects analysis
27. January 2015 • QP 25
specific problem location, however, you may need to
start at the 10,000-meter level. If you need to satisfy an
International Organization for Standardization require-
ment or audit, you will probably select a higher-level
system FMEA.
Select logical start and finish locations, and describe
each system-level process step, machine or location as a
black box. Even if multiple operations happen inside, you
just need to know what is supposed to come out.
For example, a part is transferred into a system-
level operation called operation 101. The part is trans-
formed in one or more ways, and then exits. End of
story. One or more quality specifications determine
whether it was a successful transformation.
What goes on inside the black box doesn’t matter
at this level. All that must be described is the transfor-
mations performed inside operation 101 in a verb-noun
format. The verb-noun descriptor is the process goal.
“Drill hole,” “machine face,” “thread hole” or all
three are examples of verb-noun descriptors. On an as-
sembly line, the transformation may be “install turbo.”
In a warehouse, “pick part.” In an office, “complete
Form 200, Part B.” If this is a design or machine FMEA,
the verb-noun rule still applies, but describes functions
instead of operations. All you must know are the goals
as defined by the specifications.
For operation 101, the goal is to drill a hole. Accord-
ing to the specifications, a successful operation will re-
sult in a one-inch hole (+0.005”), drilled one inch deep
(+0.005”) into the exact center of the part (+0.005”). If
any of these requirements are not met, the part is de-
fective. If the part face is also machined, add the verb-
noun descriptor, “machine face,” with specifications.
If defects occur too often, you might be given a new
project to fix operation 101. Then you would create a
new FMEA and probe more deeply into the individual
components and levels of action. Then you focus on
part transfers, clamping, coolant and limit switches.
Problem two: no process map
Start the FMEA by creating a process map (process
map step two). The process map serves as the guiding
document for the FMEA team. It controls the agreed-
on start and finish locations and level of analysis. As
with any good map, it must depict the terrain at the ap-
propriate level with absolute accuracy. Post it and ask
for feedback from operators, maintenance, engineers
and supervisors.
After the team agrees the process map accurately
represents the process or design, FMEA construction
begins. Each process step will have an identifier and
one or more verb-noun descriptors.
Prior to the next FMEA meeting, the leader or
scribe prepopulates the FMEA template step or func-
tion column by following the process map. A one-to-
one relationship exists between the process map and
the step or function column. If your FMEA template
does not already contain a requirements column, add
one. As shown in Table 1, having the requirements vis-
ible keeps the team focused on what is required.
Problem three: infinite potential failures
There is good reason to believe PFM identification
is the most significant, confounding issue hindering
FMEALinenumber
Process
step/
function
Requirements Potential
failure
mode
Potential effect(s)
of failure
Severity
Classification
Potential cause(s)
of failure
Occurrence
Current
process
controls
Prevention
Current
process
controls
Detection
Detection
RPN
1 Drill hole 1”±.005 diameter
1”±.005 deep
Center±.005
Did not
drill hole
Break reamer 6 Broken bit 5 Visual None 8
Limit switch arm 2 None None 9
Hydraulic unit off 3 None Panel light 7
FMEA = failure mode and effects analysis
RPN = risk priority number
FMEA template / TABLE 1
28. QP • www.qualityprogress.com26
FMEA development. Just do one and notice when your
time, frustration and emotions converge.
This problem emerges when the team attempts to se-
lect potential failures from a nearly infinite universe of
real and often hypothetical modes of failure. Predicat-
ed on collective knowledge, a sequestered SME team
attempts to predict everything that could potentially
fail. That task is fraught with problems and frustration.
Now, add job commitments, personality differenc-
es, team dynamics and, often, a lack of leadership. It’s
enough to make any team frustrated and a bit testy.
Fortunately, a powerful tool exists that resolves the
problem.
Enter 7PFM
The tool to use is the 7PFM model. I was originally in-
troduced to 7PFM by its originator, quality consultant
John Lindland. If you’re familiar with Lindland’s work,
you’ll notice I’ve made some of my own modifications.
The magic of the 7PFM is that it intrinsically reduc-
es the near-infinite universe of potential failures to a
manageable and panoptic seven. The 7PFM takes the
approach of asking, “What are the fundamental types
of failure?” as opposed to, “What could potentially
fail?”
7PFM eliminates bizarre failure mode proposals
and ensuing discussions. Like me, you have probably
heard some strange failure modes proposed and de-
bated through the years.
Using 7PFM, “drunken operator” won’t be a failure
mode, only a personal mode of failure at the molecular
level.
The methodological beauty is that the leader or
scribe prepopulates the FMEA template directly from
the process map and 7PFM model before the FMEA
meeting (process map step three). With the failure
mode column prepopulated, the team simply reviews
each PFM’s applicability by column and discards those
that don’t apply (process map step four).
You’ll be surprised how quickly and smoothly this
process goes. It eliminates most arguments and hours
of frustration from the FMEA creation process. If team
members reach an impasse, just leave in the failure
mode: Err on the side of too many, not too few. Dubi-
ous PFMs will get sorted later in the SOD scale scoring
(process map step six).
Working by row and column, the team now identi-
fies and completes the failure mode effects, causes and
controls for each PFM (process map step five). Finally,
the SOD scales are completed by column to maintain
scoring continuity.
Energy/resistance model / FIGURE 2
1. Did not
(no action) Action
or
time
2. Too much
or
4. inaccurate
3. Too little
or
4. inaccurate
5. Inconsistent
(within or between actions)
Target
Capable
process
6. Too fast/early
Lower
specification
limit
Upper
specification
limit
7. Too slow/late
Failure domain PFM Failure description
Quantity Did not No action
Too much Excessive action
Too little Insufficient action
Variation Inaccurate Action off target
Inconsistent Variation in action within or between events
Time Too fast Action happened too quickly or too soon
Too slow Action happened too slowly or too late
PFM = potential failure mode
7PFM = seven potential failure mode model
7PFM model description / TABLE 2
29. January 2015 • QP 27
FMEA
KEY WORDS TO REMEMBER
Analysis depth: ASQ calls this “analysis
scope,” and it refers to the failure mode
and effects analysis (FMEA) and process
map-level of focus. ASQ and I use three
levels of evaluation: system, subsystem
and component. A system is comprised
of subsystems, and subsystems are
comprised of components.
Boundary diagram: A boundary
diagram is an illustration often used as
a design document to show relation-
ships among components, subsystems
and assemblies. When used to construct
a design FMEA, potential relationship
issues between components can be
analyzed. For example, a boundary dia-
gram shows part A bolts to part B. The
design FMEA identifies potential failure
modes preventing that action.
Component level (molecular level):
This level is microscopically focused on
individual transformation steps. From
the subsystem example, step one is the
inbound part transfer. You would evalu-
ate each transfer step: “part placed on
fixture,” “fixture raises,” “fixture rotates”
and “fixture stops in position.”
Failure mode: The Automotive
Industry Action Group (AIAG) defines
a failure mode as ways, or modes, in
which something might fail. Failures are
any errors or defects, especially ones
that affect the customer and can be
potential or actual. AIAG describes a
failure mode as the way a component,
subsystem or system could potentially
fail to meet or deliver the intended
function described in the item column
(see “process step identifier”).
Leader and scribe: When creat-
ing an FMEA, usually one person—the
FMEA team leader—leads the effort and
team of subject matter experts. During
FMEA team meetings, it is often desir-
able to have a second person, a scribe,
populate the FMEA form, document
suggestions and record votes. Often,
resources are slim, and one person may
have to handle both functions.
Process step identifier: When
populating the FMEA worksheet (see
Table 1) the first or second column of
most FMEAs is usually titled, “Item,
process step or function.” When using
the seven potential failure mode (7PFM)
method, this cell is populated with each
transformational action defined by the
process map in a verb-noun format.
System level (10,000-meter
view): This level of evaluation is typi-
cally applied to large systems, such
as an entire manufacturing line. Each
machine or operation on the line is
treated as a black box. A manufactur-
ing line, for example, might be com-
prised of a milling operation, drilling
operation, parts washer, part dryer
and paint operation.
At this level, you are interested
in only the quality outcome of each
operation. Did the milling operation
meet specifications? Did the holes
meet specifications? Did the part
meet cleanliness specifications? Was
the part dry enough to paint? Does the
paint job meet specifications?
Subsystem level (5,000-meter
view): This level is focused on one
machine or operation of the system.
At this level, each part transformation
within the subsystem is evaluated. From
the system example, a milling operation
may look like: “part transfers in,” “part
clamped,” “coolant on,” “surface one
machined,” “coolant off,” “part un-
clamped” and “part transferred out.”
—J.R.K.
7PFM model
The 7PFM model is grouped into three disparate do-
mains of failure: failures of quantity, quality and time.
Each PFM is combined with the process step (or func-
tion) verb-noun descriptor. This creates a clear de-
scription of the failure called a failure mode statement
(for example, “Did not drill hole”). Each PFM then will
have its own assigned effects, causes and controls.
Table 2 summarizes the 7PFM model.
It might be helpful to envision all seven PFMs in
terms of an energy or resistance model, depicted in
Figure 2. The incorrect application of energy or resis-
tance manifests itself as a failed (noncompliant) action
result. An action, for example, may fail due to no ap-
plied energy or infinite resistance. No energy or infi-
nite resistance equates to no action. Conversely, too
much energy or too little resistance may deleteriously
increase an action outcome.
The first failure domain identifies failures of quan-
tity. Quantity is comprised of three failure modes: “did
not,” “too much” and “too little.” From previous exam-
ples, combine “drill hole” with the three failed actions
to form three failure mode statements:
1. Did not drill hole.
2. Drilled hole too much.
3. Drilled hole too little.
Analyze these three failed actions by asking how
each would manifest itself in the real world. If the team
30. QP • www.qualityprogress.com28
FMEA
decides it would be impossible or doesn’t care whether
the hole is drilled too much, discard the failure mode.
When in doubt, keep it.
Next, failures of quality describe how an outcome
deviated from what was planned. They manifest them-
selves as both common and special causes, the arch
enemies of Six Sigma. Failures of quality frequently
combine with other failure modes within the same
operation. This tends to confirm a high probability of
failure.
There are two failure modes of quality. The first,
inaccuracy, is defined as an inaccurate application
of energy or resistance within a single part, event or
application. Inaccuracy could happen to subsequent
parts or events, but you’re only interested in the single
event. Envision energy or resistance being applied to a
transforming operation so inaccurately that it causes
a failed outcome. For example, drilling a hole inaccu-
rately could describe inaccuracy in a starting-point lo-
cation, ending-point location or both.
The second quality failure is inconsistency, which
describes variation that happens during the transfor-
mation or between transformations. There are two
variants:
1. Variant one describes variation during one action in
one part. A drilled hole started out at one inch but
ended smaller.
2. Variant two describes variations between two or
more actions in one part. Part one’s hole one is per-
fect, but part one’s hole two is off location.
Finally, failures of time manifest themselves as “too
fast” or “too slow.” There are two variants of each. “Too
fast” can describe cycle time and timing. Something
happened early, for example. Conversely, “too slow”
can describe a slow cycle time, or the action was com-
pleted late. Frequently, a failure of time will be legiti-
mate but not applicable.
Drilling a hole too slowly may not have an impact on
quality, for example, but it will have a profound impact
on productivity. If the FMEA focus is on only quality,
the failure “too slow” can be discarded. Likewise, “drill
hole too fast” might explain shortened tool life (high
speed or feed), but it’s not relevant to quality. “Too fast”
or “too slow” timing can be legitimate factors contrib-
uting to blocking or starving adjacent operations.
Deselect the inappropriate
Determine scope and depth of analysis, develop a pro-
cess map and use it to guide and build your FMEA.
Use the 7PFM model to deselect inappropriate failure
modes and complete the FMEA using a column and
row approach. Every operation will exhibit one or
more of the seven failures—usually more. Selecting
four or five failure modes is common, and all seven is
not uncommon.
I’ve seen a lot of poor-to-useless FMEAs. Early on, I
helped create some pretty poor ones myself. I eventu-
ally found the 7PFM model to be almost magical when
applied to FMEAs and error-proofing. Add these tech-
niques to your quality toolbox and have more fun. QP
BIBLIOGRAPHY
ASQ, “Failure Mode and Effects Analysis (FMEA),” http://asq.org/learn-about-
quality/process-analysis-tools/overview/fmea.html.
Automotive Industry Action Group, Potential Failure Modes and Effects Analy-
sis, fourth edition, 2008.
Casey, John J., Strategic Error-Proofing, Productivity Press, 2009.
Ebrahimipour, Vahid, Kamran Rezaie and Sam Shokravi, “An Ontology Ap-
proach to Support FMEA Studies,” proceedings from the Annual Reliability
and Maintainability Symposium, February 2009.
Lindland, John, “Mistake-Proofing,” Automotive Excellence newsletter, ASQ,
Summer 2001.
Mikulak, Raymond J., Robin McDermott and Michael Beauregard, The Basics of
FMEA, second edition, CRC Press, 2009.
Ramu, Govind, “FMEA Minus the Pain,” Quality Progress, March 2009, pp.
36-42.
Tague, Nancy R., The Quality Toolbox, second edition, ASQ Quality Press, 2004,
pp. 236–240.
If team members reach an impasse, just
leave in the failure mode: Err on the
side of too many, not too few.
JAMES R. KOTTERMAN is a performance improve-
ment manager at Integrated Healthcare Associates
in Ann Arbor, MI. He holds a doctorate in industrial/
organizational psychology from Capella University in
Minneapolis. A senior ASQ member, Kotterman is an
ASQ-certified Six Sigma Black Belt, quality engineer,
manager of quality/organizational excellence, auditor,
technician and continuous improvement associate. He
is also Six Sigma Qualtech-certified Six Sigma Black Belt and lean practitioner.
31. Elevate From Great to Exceptional
With an Exclusive ASQ Executive
Leadership Experience
This one-year executive leadership development experience for high-
potential quality leaders focuses on establishing a culture of quality and
performance excellence. Emerge with a broader perspective on how to
achieve performance excellence for your organization, stimulate innovation,
and gain the skills needed to lead in the 21st
century.
• Network with other high-potential talent passionate about
driving improvement
• Experience quality while benchmarking Fortune 500 companies during
on-site visits and case studies
• Build meaningful, long-term relationships with executive mentors, thought
leaders, and emerging executives from across diverse industries
• Gain access to and participate in sessions on the latest thought-provoking
executive topics
• Leverage cross-industry best practice sharing on project teams to solve
strategic organizational challenges
• Tap into ASQ’s vast resources and extensive member community
For more information and additional program benefits for
you and your organization, visit emergingqualityleaders.org.
The Global Voice of QualityTM
CERTIFICATION MEMBERSHIP PUBLICATIONSTRAINING CONFERENCES
Emerging Quality
Leaders Program
32. Dissecting
the Details
In 50 Words
Or Less
• EN ISO 14971:2012
Medical Devices. Appli-
cation of risk to medical
devices is the latest
version of a medical
device standard used
throughout the United
States and Europe.
• Compared to the stan-
dard’s 2007 version, the
fundamental application
of risk management
has stayed the same,
but many changes are
important to note.
by Bob Mehta
33. RISK MITIGATION ALWAYS has been a salient re-
quirement for the design, development and manufacture of medi-
cal devices that are safe and effective for their intended use.
The tools employed in the pursuit of effective risk management,
however, have varied significantly.
EN ISO 14971:2012 Medical Devices. Application of risk to medi-
cal devices is categorized as a consensus standard by the U.S. Food
and Drug Administration (FDA). Since July 31, 2012, it’s also been con-
sidered a harmonized standard in Europe.
With the advent of EN ISO 14971:2012, the device industry now has
well-defined guidelines to assist in its pursuit of effective risk manage-
ment. Although the application of risk management tools will vary
depending on organizational structure, the underlying purpose for
applying risk management is patient and user safety, driven by medical
devices that are safe and effective for their intended use.
Risk management implications
in the new version of the
medical device standard
EN ISO 14971:2012
January 2015 • QP 31
STANDARDS
34. QP • www.qualityprogress.com32
One additional concept relevant to understanding
risk management is that the “as low as reasonably
practical” (ALARP) approach is no longer an accept-
able approach to risk management due to financial im-
plications associated with the ALARP concept.
Importance of risk management
It is the goal of medical device manufacturers to de-
sign, develop and introduce medical devices into the
marketplace that are safe and effective for their in-
tended use. One of the most significant influences as-
sociated with safe and effective medical devices is the
identification of risk and the application of risk man-
agement tools to mitigate it.
In the device industry, risk is viewed as having mul-
tiple facets:
• Product risk.
• Patient and user risk.
• Regulatory risk.
ISO 14971 was written to assist medical device man-
ufacturers in understanding and applying tools needed
for effective risk management. In fact, it is an insur-
mountable task to have regulatory bodies approve
device applications without documented evidence of
compliance with ISO 14971.
FDA warning letter
In April 2014, the FDA inspected a manufacturer of
polytetrafluoroethylene (PTFE)-coated guide wires
used in cardiovascular and urological procedures.
PTFE, better known as Teflon, is a synthetic fluo-
ropolymer used in many industrial applications, in-
cluding the manufacture of medical devices.
In the context of the warning letter, the word “risk”
was used six times (see part of the letter in the sidebar
“Warning Letter—Observation 1”).
The first observation noted in the warning letter,
however, criticized this organization’s approach to risk
analysis. In fact, the agency said that the offending or-
ganization’s approach to risk analysis was inadequate.
Changes in 2012 version
One of the most common questions asked by industry
relates to the differences between EN ISO 14971:2007
and the 2012 version. According to the European Asso-
ciation for Medical Devices of Notified Bodies’ (Team-
NB) position paper, there have been no changes to the
normative text of EN ISO 14971.
The Team-NB position paper was written in April
2013 and delineates the way notified bodies in Eu-
rope will verify their clients’ compliance to EN ISO
14971:2012 requirements.
Annex Z has changed, however. Annex Z delineates
gaps associated with EN ISO 14971 and areas in which
EN ISO 14971 fails to comply with the three European
medical device directives:
1. The active implantable medical device direc-
tive—90/385/European Economic Community (EEC).
2. The in-vitro medical device directive—98/79/EC.
3. The medical device directive (MDD)—93/42/EEC.
Consider this an advanced warning: Proposed
changes are going to force the migration of these three
directives into regulations in about three years. Addi-
tionally, notified bodies will be tasked with complying
with EN ISO 14971 during the assessment of a device
manufacturer’s technical files and design dossiers.
It is imperative to understand that when deviations
from the three European medical device directives
(driven by a thorough review of Annex Z requirements
as they relate to finished medical devices) are noted,
formal corrective action will be required to address the
deviations.
Furthermore, the underlying goal of notified body
reviews of EN ISO 14971 compliance will determine
whether clinical benefits outweigh patient and user
risk.
Moreover, many device organizations that have
fully complied with EN ISO 14971:2007 will find their
technical documentation is in excellent shape if a ro-
bust approach to risk management has been pursued.
Finally, the Team-NB position paper recommends
organizations ask four questions to help determine
their overall level of compliance to risk management:
1. Do all design solutions conform to the safety princi-
ples given in the essential requirements and EN ISO
14971 (inherent safe design protection measures
information)?
2. Have manufacturers shown that risks have been re-
duced as much as possible?
3. Have manufacturers conducted a risk-benefit analy-
sis for all risks?
4. Because publication of residual risks in the infor-
mation given to the user doesn’t reduce the risk,
but publication of residual risks and warnings used
as risk-control measures may be beneficial, have
residual risks been correctly placed in the instruc-
35. January 2015 • QP 33
tions for use (IFU) or provided in training? Have
manufacturers evaluated whether those warnings
are effective (refer to International Electrotechni-
cal Commission [IEC] 62366)?
It will be the responsibility of medical device manu-
facturers to ensure these questions are adequately ad-
dressed as part of their design and development pro-
cesses. Failure to do so will result in a delay in device
application approvals in the European Union (EU).
Additionally, failure to bring legacy files into com-
pliance with EN ISO 14971:2012 will result in the is-
suance of nonconformances from notified bodies and
potential Form 483 observations from the FDA.
Prudent path for compliance
It is incumbent on medical device manufacturers to
demonstrate ongoing compliance with essential re-
quirements. In the EU, after all, compliance with har-
monized standards equates to a presumption of con-
formity with the applicable directive.
Employment of harmonized standards, however,
continues to be voluntary and not mandated by regula-
tion in the EU. Pragmatic advice is to simply comply
with the wishes of notified bodies and employ harmo-
nized standards, including EN ISO 14971:2012, when-
ever and wherever possible.
Elements for an effective approach
It is imperative for the management team of each de-
vice organization to be fully committed to the pursuit
of effective risk management and successful imple-
mentation of EN ISO 14971:2012 principles. After all,
it is the management team that will be responsible for:
• Defining the organization’s policies for risk manage-
ment and acceptability of risk.
• Assessing the ongoing effectiveness of the risk man-
agement program.
• Ensuring qualified personnel are on staff to perform
risk management activities.
If the management team is fully committed, the
first thing to keep in mind when writing a standard
operating procedure for risk management is a basic
understanding that any approach to risk management
and compliance with EN ISO 14971:2012 must address
three essential elements:
1. Clause 4—Risk analysis.
2. Clause 5—Risk evaluation.
3. Clause 6—Risk control, including key deliver-
ables such as Clause 3.4—Risk management plan
(RMP); Clause 8—Risk management report (RMR);
and Clause 3.5—Risk management file (RMF).
Clause 4: Risk analysis
For starters, the risk analysis process, in accordance
with EN ISO 14971:2012, shall be documented in the
RMF. Practices currently employed by industry include
creating a standalone RMF or using the design history
file as the receptacle for risk management documenta-
tion.
As part of the risk analysis element, intended use,
identification of hazards and estimation of risk must
occur. With respect to the estimation of risk, informa-
tion necessary for estimating risk can be found in:
• Published standards.
• Scientific data.
• Technical data.
• Field and postmarket surveillance data from
STANDARDS
WARNING LETTER –
OBSERVATION 1
“1. Failure to establish and maintain design validation procedures to
ensure that devices conform to defined user needs and intended uses
and shall include testing of production units under actual or simulated
conditions of use, as required by 21 CFR 820.30(g). Specifically, you have
not validated the design of polytetrafluoroethylene (PTFE)-coated guide
wires under actual or simulated conditions of use and your risk analysis
is inadequate in that it does not assess flaking and delaminating of coat-
ing during use.
We find that your March 27, 2014, response does not adequately ad-
dress these deficiencies. We acknowledge that you have ceased to supply
medical guide wire products that use any post-coated PTFE formula. How-
ever, it appears medical guide wires, manufactured by your firm under
these violative conditions, may still be on the market and available for use
by healthcare practitioners. Your firm should perform a risk assessment
to determine whether correction or removal is necessary for the affected
products. You have not provided us with design control procedures or an
adequate risk analysis. In response to this Warning Letter, we will require
documentation of these procedures when complete and a description of
any corrective action that may be required.”
SOURCE
U.S. Food and Drug Administration, Inspections, Compliance, Enforcement and Criminal Investiga-
tions, April 2014, www.fda.gov/iceci/enforcementactions/warningletters/2014/ucm399011.htm.