1. Avant Garde Wealth Management Pvt. Ltd.
Contents
Emerging market turmoil – Comparing India with its peers
Global macro – What could go wrong?
Portfolio positioning – Cash continues to increase
Stocks in the portfolio – Booked some profits
Portfolio performance – Impacted by defensive posture
Note: This letter is a bit more global macro focused than usual and reads longer due to the large
number of charts
Dear investor,
With QE tapering by the Fed (US Federal Reserve) underway, jitters in emerging markets are back in
focus, leading to a correction in global equities in January after a quarter of strong performance. In
this letter we explore how India stacks up compared to its peers. We also highlight various stress
points in the global economy that could lead to or exacerbate a decline in global equity prices.
Emerging market turmoil – Comparing India with its peers
The summer of 2013 witnessed significant volatility in asset prices as Fed Chairman Bernanke hinted
at reducing the pace of quantitative easing (also referred to as tapering) and subsequently deferred
the decision. With tapering now in place, asset prices and currencies in various emerging markets,
led by Agrentina and Turkey, have come under severe pressure. In his book Code Red economist
John Mauldin notes, “Whenever the Fed hikes rates, bad things happen somewhere. It's that
simple.” Albert Edwards, strategist at Société Générale, elaborates with some examples1 “There has
never been any shadow of doubt in my mind that tapering = tightening, and I marvel that the Fed
convinced anyone otherwise. A Fed tightening cycle inevitably plays a key role in triggering the next
crisis (see below). Plus ça change, hey?
1970 Recession/Penn Central Railroad
1974 Recession/Franklin National Bank
1980 Recession/First Penn/Latin America
1984 Continental Illinois Bank
1987 Black Monday
1990 Recession/S&L and banking crisis
1997 Asian currency collapse/Russian default/LTCM
2007 The Great Recession/Collapse of almost the entire global financial system
2014 Emerging Market collapse/deflation/recession/another banking collapse etc.”
Through a few insightful charts sourced from John Mauldin’s recent newsletter2 we compare how
India has fared relative to its emerging market peers along various dimensions.
1
2
Sourced via www.zerohedge.com
Thoughts from the frontline – Central Banker Throwdown, Feb 1 2014 (www.mauldineconomics.com)
Note: “Portfolio” refers to the weighted average of all client portfolios managed by us over the relevant time period. Any metrics such as
returns or portfolio weighting similarly refer to the weighted average of all portfolios. Individual clients portfolios may defer materially
from the blended “Portfolio” and clients should refer to their portfolio statements for details on their portfolios
2. Avant Garde Wealth Management Pvt. Ltd.
After falling dramatically during the summer of 2013 the Indian Rupee has actually held up in value
relatively well compared to peers.
However, since 2009 inflation in India has been consistently higher than all other emerging markets
and on par with Argentina. We are not in good company!
The increase in government bond yields in India has been marginal compared to peers.
Note: “Portfolio” refers to the weighted average of all client portfolios managed by us over the relevant time period. Any metrics such as
returns or portfolio weighting similarly refer to the weighted average of all portfolios. Individual clients portfolios may defer materially
from the blended “Portfolio” and clients should refer to their portfolio statements for details on their portfolios
3. Avant Garde Wealth Management Pvt. Ltd.
It can be argued that India has managed to bring down its current account deficit and shored up
currency reserves and therefore the outperformance versus peers is well deserved. That may be so.
The idea behind the above charts is simply to highlight how much worse other countries have fared
in recent times. Even as India’s external account dynamics have improved, they are far from pristine,
and the economy remains mired in low growth and high inflation due to declining productivity.
Additionally, at any given point, the narrative surrounding a country (or any asset class for that
matter) tends to dominate the underlying fundamentals and can become self fulfilling in the short
term. In that light, the recent narrative among analysts and investors that the high growth in
emerging markets in the past decade has largely been a product of Fed liquidity and that India is part
of the “Fragile Five” economies (others being Brazil, Turkey, Indonesia, and South Africa) does not
bode too well.
Indian equity markets have received significant foreign capital inflows in the past decade. Also note
that the outflows in 2008 and 2011 coincided with sharp losses in equity markets.
Source: Bloomberg; Deutsche Bank
India has also received a disproportionate share of foreign flows compared to other Asian countries.
Source: Bloomberg; Deutsche Bank
Note: “Portfolio” refers to the weighted average of all client portfolios managed by us over the relevant time period. Any metrics such as
returns or portfolio weighting similarly refer to the weighted average of all portfolios. Individual clients portfolios may defer materially
from the blended “Portfolio” and clients should refer to their portfolio statements for details on their portfolios
4. Avant Garde Wealth Management Pvt. Ltd.
As a result, ownership of foreign institutions in Indian stocks is at an all time high.
Source: Morgan Stanley
In the following section we discuss various risks to the global economy and financial markets. In the
event that any of these risks materialize and there is a material decline in global equity prices, the
weakness is likely to get transmitted to Indian equities via a slowdown or reversal in foreign fund
flows.
In a recent Bloomberg interview RBI (Reserve Bank of India) governor Raghuram Rajan lamented
that cooperation among central banks was breaking down and that the Fed was “attacking"
emerging markets by continuing to shrink its quantitative easing program. He should know better.
Self interest is the guiding principle in all policy making. The Fed is no more likely to set its policy
according to the convenience of emerging markets than India is going to decide how much apparel
to export based on the impact on Bangladesh. So it is naïve to expect the Fed to pre-emptively act to
prevent dislocations in other countries. Expect the Fed only to act reactively to external dislocations
when they significantly impact, or imminently threaten to seriously impact, the US economy and
capital markets.
Global macro – What could go wrong?
As we began 2014 investor sentiment towards equities was very optimistic and complacency about
possible risks was high. The thinking went broadly like this – The US economy is recovering well and
growth will accelerate; EU economies are reviving after bottoming and policy makers there have
shown their commitment to maintain the Euro at any cost so risks of another sovereign debt crisis
are negligible; China’s debt problem is well known and while the growth rate may slow marginally
the central planners there will figure out how to keep chugging along and avoid a credit crisis; while
the Fed has started tapering QE and will probably end it in 2014 they will maintain low rates for a
long time, thus supporting equity prices. With the recent emerging market driven 4-5% decline in
equity prices risk antennae have risen slightly, but the mood is very much that this will be contained
and is an opportunity to buy the dip. We don’t have a strong view on whether this particular sell off
in emerging markets will deepen imminently. However, we do observe that these tremors highlight
the fragility in the global financial architecture. We discuss four potential problem areas for the
global economy which could spring negative surprises in the months and years to come.
Note: “Portfolio” refers to the weighted average of all client portfolios managed by us over the relevant time period. Any metrics such as
returns or portfolio weighting similarly refer to the weighted average of all portfolios. Individual clients portfolios may defer materially
from the blended “Portfolio” and clients should refer to their portfolio statements for details on their portfolios
5. Avant Garde Wealth Management Pvt. Ltd.
(1) Could the upcoming EU parliament elections in May 2014 mark a subtle shift in policymaking in
European countries and lead to a repeat of the sovereign debt crisis?
While one could look at various indicators, the chart above provides basis for optimism about a
bottoming and continued revival in Eurozone economies. However, unemployment has stayed
stubbornly high in 2013 despite the recovery in PMI survey readings and GDP growth rates.
Source: Eurostat via www.zerohedge.com
Note: “Portfolio” refers to the weighted average of all client portfolios managed by us over the relevant time period. Any metrics such as
returns or portfolio weighting similarly refer to the weighted average of all portfolios. Individual clients portfolios may defer materially
from the blended “Portfolio” and clients should refer to their portfolio statements for details on their portfolios
6. Avant Garde Wealth Management Pvt. Ltd.
Particularly worrying is that youth unemployment has reached alarmingly high levels.
The phenomenon of very high and persistent unemployment, especially for the youth, has probably
supported the growing popularity of EU sceptic parties, which are also typically extreme right or left
wing in ideology, across many European countries. The important ones are the UK Independence
Party in UK, Syriza and Golden Dawn in Greece, Front National in France, and Five Star in Italy.
During May 22nd to 25th 2014, elections to the EU parliament will be held. Today most seats are held
by parties that swear by the European project and will do “whatever it takes” to ensure the integrity
of the EU. Current opinion polls are indicating substantial gains for the Euro sceptic parties, and if
this trend persists they could win a substantial number of seats in the upcoming elections3. If this
were to occur, it has the potential to mark a subtle but substantial shift in the tone of policymaking
in the EU. As incumbent governments sense the mood of their electorate, they may be forced to
reconsider policies that are geared towards preservation of the Euro even at the cost of their
domestic economies. Given the still precarious condition of most peripheral EU countries (and
France), this may significantly increase the probability of a debt crisis recurring if investors sense this
weakened resolve on the part of policymakers.
(2) Could China send a deflationary shock into the global economy?
The topic of excessive credit growth and mal investment in China has received a fair amount of
attention lately among economists and participants in financial markets. The charts below highlight
some key points about China’s debt situation.
3
For a more detailed discussion on this topic please read Things That Make You Go Hmmm… by Grant Williams (Feb 27,
2014); available on www.mauldineconomics.com
Note: “Portfolio” refers to the weighted average of all client portfolios managed by us over the relevant time period. Any metrics such as
returns or portfolio weighting similarly refer to the weighted average of all portfolios. Individual clients portfolios may defer materially
from the blended “Portfolio” and clients should refer to their portfolio statements for details on their portfolios
7. Avant Garde Wealth Management Pvt. Ltd.
Source: WIND, CEIC, Leasing Association, ChinaBond.com, Morgan Stanley
Source: CEIC, Morgan Stanley
Source: South China Morning Post; via Acting Man Blog
Total outstanding debt at ~235% of GDP is not abnormally high when compared to the other large
developed countries. More important is that this figure has grown very rapidly from 155% in 2008,
primarily driven by the large stimulus provided during the 2008 global financial crisis, which is
evident from the step jump in money supply during that period. Economic history suggests that very
rapid growth in credit leads to uneconomic investments and bad lending decisions, and it is now
widely accepted among economists that “overinvestment” has been a problem in China, particularly
over the last few years. The fact that shadow banking debt (loans outside the official banking
system) is estimated to have tripled in size relative to GDP over the last five years only serves to
confirm this hypothesis.
There have been a few tremors in China’s financial system recently. The SHIBOR (interbank rate) has
seen very sharp spikes upwards multiple times over the past year but has subsequently stabilized
after the central bank injected liquidity. More recently, in late January 2014, the government
essentially bailed out investors of a wealth management product (part of the shadow banking
system) after they were faced with substantial losses and there was risk of a wider loss of
confidence. China’s closed capital account and tight central control over the economy may mean a
garden variety credit crisis like the ones we have seen in other emerging markets in the past is
unlikely. But the laws of economics are no different for China. In order to fend of a crisis, credit will
need to grow at an ever accelerating pace, in which case the imbalances will only get more
pronounced and an eventual deep crisis will become more likely. If credit growth is slowed down, as
seems to be the intent of the new government, GDP growth will need to slow down sharply due to
the hit to aggregate demand. Either way, this will be deflationary for the Chinese economy. And in
Note: “Portfolio” refers to the weighted average of all client portfolios managed by us over the relevant time period. Any metrics such as
returns or portfolio weighting similarly refer to the weighted average of all portfolios. Individual clients portfolios may defer materially
from the blended “Portfolio” and clients should refer to their portfolio statements for details on their portfolios
8. Avant Garde Wealth Management Pvt. Ltd.
the event that these deflationary tendencies become pronounced and threaten social stability, there
is a possibility that China devalues the Yuan sharply in order to drive demand growth. Such a move
would effectively export their deflation to the rest of the world, which would not be good for global
equities.
(3) Could the correlation of S&P500 with the Fed balance sheet break down and equity prices begin to
reflect poor underlying fundamentals?
In our September 2013 letter we shared a version of the chart below, which shows the strong
correlation between the Fed’s balance sheet and the S&P500 since QE was implemented in 2009.
We also quoted fund manager John Hussman to make the point that historic data does not suggest
any mechanistic link between the two variables. Thus correlation likely does not imply causation and
the link exists only because investors believe it to exist.
Source: Deutsche Bank; Bloomberg
Why is this important? Because beliefs are susceptible to change. We quote Albert Edwards of
SocGen once again as he says it best, “For in the same way as investors believe, axiomatically that
QE will drive up equity prices, they believed exactly the same thing of commodities until 2012.
Commodities are a risk asset and benefited massively from QE1 and QE2, so why has QE3 had
absolutely no effect on commodity prices? Exactly the same thing could happen to equities if a
recession unfolds and profits plunge at the same time as the printing presses are running full pelt.
Do not assume equities MUST benefit from QE.” The following chart accompanies the commentary.
Note: “Portfolio” refers to the weighted average of all client portfolios managed by us over the relevant time period. Any metrics such as
returns or portfolio weighting similarly refer to the weighted average of all portfolios. Individual clients portfolios may defer materially
from the blended “Portfolio” and clients should refer to their portfolio statements for details on their portfolios
9. Avant Garde Wealth Management Pvt. Ltd.
In our June 2013 letter we had pointed out that earnings growth for the S&P500 remained weak and
the rise in equity prices was mostly a result of P/E multiple expansion. After bouncing back from
depressed levels in 2009 the lack of growth in corporate profits is not particularly surprising since
the current economic recovery in the US is the worst on record.
While so-called operating earnings have been growing in high single digits actual reported earnings
(including exceptional items) have shown zero growth recently.
Note: “Portfolio” refers to the weighted average of all client portfolios managed by us over the relevant time period. Any metrics such as
returns or portfolio weighting similarly refer to the weighted average of all portfolios. Individual clients portfolios may defer materially
from the blended “Portfolio” and clients should refer to their portfolio statements for details on their portfolios
10. Avant Garde Wealth Management Pvt. Ltd.
Sales growth has been anaemic, which is in keeping with slow GDP growth. Operating profit or EBIT
(Earnings Before Interest and Taxes) growth has been particularly dismal since late 2012. This
indicates that even the mild EPS (Earnings Per Share) expansion that has been delivered during this
period is only a result of lower interest rates and share buybacks.
Profit growth is likely to continue to remain below sales growth given record high profit margins. In
fact, historic analysis suggests that profits will actually decline over the next few years.
Source: Hussman Funds
Note: “Portfolio” refers to the weighted average of all client portfolios managed by us over the relevant time period. Any metrics such as
returns or portfolio weighting similarly refer to the weighted average of all portfolios. Individual clients portfolios may defer materially
from the blended “Portfolio” and clients should refer to their portfolio statements for details on their portfolios
11. Avant Garde Wealth Management Pvt. Ltd.
The prevailing belief is that US companies have not been investing enough and as they gain the
confidence to invest it will set off a self fulfilling cycle of higher economic growth and in turn higher
corporate profits. The data on the other hand shows that the ratio of capital expenditure to sales is
close to record highs, and change in capex has been broadly tracking change in cash flows, implying
little room for a significant increase in capital investment.
Another common perception is that corporate balance sheets are in excellent shape with corporates
hoarding cash, and as they choose to deploy this money economic growth will get a boost. It is true
that cash balances are at record highs, but that is because companies have been issuing records
amount of debt to raise cash. So net debt has actually not declined and is also at record highs.
Note: “Portfolio” refers to the weighted average of all client portfolios managed by us over the relevant time period. Any metrics such as
returns or portfolio weighting similarly refer to the weighted average of all portfolios. Individual clients portfolios may defer materially
from the blended “Portfolio” and clients should refer to their portfolio statements for details on their portfolios
12. Avant Garde Wealth Management Pvt. Ltd.
So to summarize, this is the weakest economic recovery in the US on record, sales growth has been
weak and is unlikely to get a boost from higher capital expenditure, profits have been flattish on
declining margins and profits are likely to decline over the next few years given mean reversion from
historically high margins, EPS growth has been ahead of profit growth due to issue of low cost debt
to buy back shares, but even this has now run out of steam with EPS growth flat lining. Given such a
weak fundamental backdrop, if investor faith in the efficacy of QE falters, the downside to equity
prices could be substantial. Alternatively, if the Fed does actually follow through on its recent steps
to gradually end QE, the resulting effect on equity prices could be similar.
(4) Could the recent crisis in some emerging markets spread to Central Eastern Europe and cause a
banking crisis in Europe?
So far the emerging market crisis has been dominated by Turkey and countries in Latin America and
Asia. While there is not much talk of emerging countries in CEE (Central Eastern Europe), this region
seems very vulnerable to crisis.
According to McKinsey4 “All of the CEE economies experienced a boom before the global economic
crisis, with GDP growth in the region averaging more than 5 percent a year from 2004 to 2008 and
rapid progress in narrowing income and productivity gaps to Western European standards. And, in
retrospect, it is clear that much of this growth was fuelled by consumption, made possible by
borrowing and capital inflows from the EU‑15.” The graph below provides empirical evidence for
this assertion by showing that CEE countries that grew faster also ran higher current account deficits.
The current account balance and economic growth for the CEE countries, annual data, 1995-2012
Source: University College London SSEES Workshop (25-26 June 2013) “Economic Growth in Central and Eastern Europe. Convergence,
Capital Flows and Crisis”, Karsten Staehr, Tallinn University of Technology
4
McKinsey Global Institute “A new dawn: Reigniting growth in Central and Eastern Europe” Dec 2013
Note: “Portfolio” refers to the weighted average of all client portfolios managed by us over the relevant time period. Any metrics such as
returns or portfolio weighting similarly refer to the weighted average of all portfolios. Individual clients portfolios may defer materially
from the blended “Portfolio” and clients should refer to their portfolio statements for details on their portfolios
13. Avant Garde Wealth Management Pvt. Ltd.
Many CEE countries also run large fiscal deficits, leading to high public debt burdens.
Fiscal Deficit as % of GDP
Public Debt as % of GDP
External debt to GDP is a key indicator of potential risk of a credit crisis in a country. Reinhart and
Rogoff suggest that if a country’s external debt exceeds 30% of GDP, there is material risk of a credit
event. When comparing emerging markets along this dimension, CEE countries dominate the
rankings with the highest debt to GDP ratios, and with significant debt maturities in less than a year.
Country
Argentina
Greece
Hungary*
Latvia*
Slovenia*
Croatia*
Bulgaria*
Estonia*
Georgia*
Slovak Republic*
Moldova*
Ukraine
Poland*
Romania*
Lithuania*
Kazakhstan
Belarus*
Czech Republic*
Turkey
Chile
Uruguay
South Africa
Thailand
Malaysia
Russian Federation
Indonesia
Mexico
Peru
Colombia
India
Philippines
Brazil
Ecuador
Egypt, Arab Rep.
Gross external debt (US$ billion)
134
566
196
42
54
61
51
22
13
79
6
138
377
135
32
148
37
102
373
125
22
137
139
106
714
260
374
55
90
400
59
472
18
47
Gross external debt % of GDP
647%
232%
150%
137%
115%
105%
95%
89%
83%
82%
79%
78%
73%
73%
69%
66%
54%
51%
45%
44%
39%
39%
35%
34%
34%
30%
28%
26%
24%
23%
22%
22%
20%
18%
Short term external debt % of GDP
25%
28%
12%
41%
22%
10%
28%
42%
15%
29%
30%
25%
13%
11%
20%
7%
34%
26%
34%
14%
23%
19%
41%
0%
11%
18%
19%
12%
13%
24%
17%
7%
0%
9%
*Countries in Central Eastern Europe
Note: Debt figures as of quarter end Sep 2013. GDP is for 2013; ST debt data is not available for Malaysia
Source: Joint External Debt Hub (JEDH); IMF
Note: “Portfolio” refers to the weighted average of all client portfolios managed by us over the relevant time period. Any metrics such as
returns or portfolio weighting similarly refer to the weighted average of all portfolios. Individual clients portfolios may defer materially
from the blended “Portfolio” and clients should refer to their portfolio statements for details on their portfolios
14. Avant Garde Wealth Management Pvt. Ltd.
To put the relative size in context, the Fragile Five plus Argentina and Ukraine, which are the focus of
the emerging market crisis in the past year, have total external debt of $1.9 trillion (Q3 2013), which
accounts for 31% of their combined GDP. In comparison, the CEE countries have $1.2 trillion of
external debt accounting for 82% of combined GDP.
In the event that the crisis spreads to the CEE countries and foreigners start redeeming their debt, it
will result in the usual sequence of higher interest rates and currency devaluations, which will be
recessionary for the countries involved. Given the high debt burdens it is quite likely that a material
portion of debt may default. European banks have the largest exposure to this region. They are
much more leveraged than their American peers and are already facing significant problems from
non-performing assets in many EU countries (Spain, France, Greece, Italy, Portugal) and the ongoing
crisis in Turkey (according to BCA Research, banks in the UK, France, Greece, and Spain have a
combined exposure of US$123 billion to short-term, private-sector Turkish bank debt). So a scenario
of defaults by CEE countries may be enough to push the European banking system over the edge and
reignite a banking crisis.
Portfolio positioning – Cash continues to increase
As of quarter end December 2013 we were 26% net long (44% long, 18% short), with 56% of the
portfolio in cash and equivalents (the short positions are via futures). The sharp increase in cash is
due to the sale of DB Corp and Thangamayil shares, and a temporary reduction in our Gold position,
all of which are discussed in more detail later.
We estimate that the long positions in aggregate have about 90% upside to their intrinsic value
under base assumptions. Even under stress scenarios the aggregate intrinsic value is 25% higher
than current prices, indicating limited risk of permanent capital loss. For our short positions we
estimate base case intrinsic values approximately 40% below current prices and believe that the
stocks are currently trading 25% higher than even optimistic estimates of intrinsic value.
Fund Manager Seth Klarman (of the Baupost Group) stated that he “worries top-down but invests
bottom-up”. This is an apt description of our investing strategy as well (although we only hope that
we can even come close to emulating his investing success). Our current defensive positioning, with
limited long exposure and large short positions, is a reflection of our worry about the global macro
environment and the risk that it poses to equity prices in India. We continue to evaluate each
investment idea on its merit and will add to our long portfolio if we find stocks at the right price. Our
uneasiness about the macro environment leads to increased emphasis on the analysis of competitive
advantages and resilience of business models and balance sheets in determining intrinsic value, and
then demanding a higher discount to that intrinsic value than we would otherwise require.
Stocks in the portfolio – Booked some profits
We have booked profits on some positions. We exited the position in DB Corp completely, reduced
the weight in Thangamayil Jewellery, and temporarily sold the bulk of the Gold position. Piramal
Note: “Portfolio” refers to the weighted average of all client portfolios managed by us over the relevant time period. Any metrics such as
returns or portfolio weighting similarly refer to the weighted average of all portfolios. Individual clients portfolios may defer materially
from the blended “Portfolio” and clients should refer to their portfolio statements for details on their portfolios
15. Avant Garde Wealth Management Pvt. Ltd.
Enterprises is now the largest position in the portfolio, followed by Noida Toll Bridge and Blue Star.
The other positions of roughly equivalent size are Manugraph, Thangamayil, and Jagran Prakashan.
Our bullish view on Gold remains unchanged and the reason for the temporary sale of the Gold
position is technical. Our holding was through the GoldBeeS ETF, which began to trade at a
significant premium to gold prices on the commodity exchange during the quarter. In order to
benefit from a reduction in the premium we decided to sell the ETF units. The premium has since
declined and we currently anticipate buying back the entire position during the ongoing quarter at
prices at par or lower than the sale price.
Thangamayil remains a good franchise in our view given their focus on retailing gold jewellery in
semi-urban and rural Tamil Nadu through a hub and spoke model of outlets. However, the recent
RBI curbs on gold imports have hurt gold availability and put organized companies at a disadvantage
by making smuggled gold available at a discount. This has hurt volumes and profits considerably
given the negative operating leverage in the business model. There is low probability that the import
restrictions will remain in place for a very long time and hence the value of the business has
probably not been permanently impaired. But given the large negative impact while the curbs
remain in place, we chose to reduce the size of our position to mitigate the risk to the portfolio from
a potential sharp decline in price.
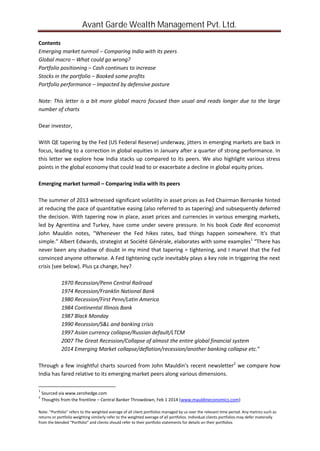
We bought DB Corp when the company’s earnings were under pressure (EPS declined 22% in FY12)
and the outlook for growth remained bleak (FY13 EPS only grew 8%). As a result the stock was out of
favour with investors, resulting in it being available at 15x trailing P/E and 3.5x P/B when we
purchased it. Our focus was always on the quality of the franchise and the fact that the business was
going through a cyclical downturn at the time. While we did not know when the cycle will turn we
were willing to wait as long as the competitive advantages of the business remained intact. With
earnings set to grow in excess of 30% in FY14 and a positive outlook for future growth, the thesis has
played out as expected. We sold the stock at 17x trailing P/E and 4.1x P/B as we believed it was
approaching our base case fair value, and also because in comparison its peer Jagran Prakashan
seems to be trading at a significant discount to intrinsic value. The possibility that we sold too soon
always exists but is something we are willing to live with in pursuit of our investment discipline. This
remains a high quality business and we would be happy to buy in again at the right price.
350
13
12
300
11
10
250
9
200
8
Sold entire position
150
Invested ~3% of the portfolio
100
7
6
5
4
50
3
DB stock price (LHS)
DB Price/Book (RHS)
Note: “Portfolio” refers to the weighted average of all client portfolios managed by us over the relevant time period. Any metrics such as
returns or portfolio weighting similarly refer to the weighted average of all portfolios. Individual clients portfolios may defer materially
from the blended “Portfolio” and clients should refer to their portfolio statements for details on their portfolios
16. Avant Garde Wealth Management Pvt. Ltd.
Portfolio performance – Impacted by defensive posture
From inception in June 2011 till end December 2013 the portfolio is up 11.3% while our benchmark,
the BSE500 index, is up 8.9%. This translates into a CAGR of 4.2% for the portfolio vs. 3.4% for the
benchmark.
Cumulative portfolio returns vs. index
NAV (pre-fee)
6-Dec-13
6-Nov-13
6-Oct-13
6-Sep-13
6-Jul-13
6-Aug-13
6-Jun-13
6-Apr-13
6-May-13
6-Mar-13
6-Jan-13
6-Feb-13
6-Dec-12
6-Nov-12
6-Oct-12
6-Sep-12
6-Aug-12
6-Jul-12
6-Jun-12
6-Apr-12
6-May-12
6-Mar-12
6-Jan-12
6-Feb-12
6-Dec-11
6-Oct-11
6-Nov-11
6-Sep-11
6-Aug-11
6-Jul-11
6-Jun-11
25%
20%
15%
10%
5%
0%
-5%
-10%
-15%
-20%
-25%
BSE500 Index
Given the large cash and short positions in the portfolio it is not surprising that that the NAV has not
moved much in the past quarter despite the sharp up move in the broader indices. We have made a
conscious choice to be positioned very defensively in light of significant risks that we observe and
the hidden ones that we don’t. If we are right, we will have opportunities to deploy capital at much
more attractive prices, setting the portfolio up for high prospective returns. If we determine that we
are not right (and this is something we evaluate constantly), we will choose to reposition our
holdings accordingly. The portfolio returns till date should not be seen as indicative of future
performance. Our expectation that we will deliver significantly higher absolute and relative returns
across market cycles remains unchanged.
Thank you for your confidence and patience.
Gaurav Jalan
February 15, 2014
Note: “Portfolio” refers to the weighted average of all client portfolios managed by us over the relevant time period. Any metrics such as
returns or portfolio weighting similarly refer to the weighted average of all portfolios. Individual clients portfolios may defer materially
from the blended “Portfolio” and clients should refer to their portfolio statements for details on their portfolios