In this article I’ve laid out the timeline and a few top indicators responsible for it and described it in it’s simplest forms for everyone to understand.
Hope you enjoy the read.
Berhampur 70918*19311 CALL GIRLS IN ESCORT SERVICE WE ARE PROVIDING
Reducing Rupee - The Great Depreciation
1. REDUCING ₹UPEE
THE GREAT DEPREssionCIATION
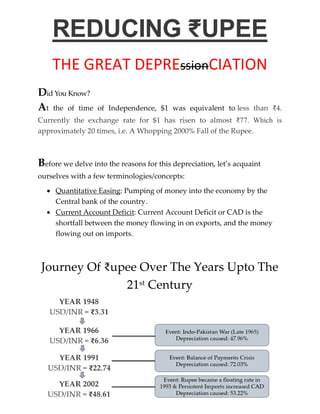
Did You Know?
At the of time of Independence, $1 was equivalent to less than ₹4.
Currently the exchange rate for $1 has risen to almost ₹77. Which is
approximately 20 times, i.e. A Whopping 2000% Fall of the Rupee.
Before we delve into the reasons for this depreciation, let’s acquaint
ourselves with a few terminologies/concepts:
Quantitative Easing: Pumping of money into the economy by the
Central bank of the country.
Current Account Deficit: Current Account Deficit or CAD is the
shortfall between the money flowing in on exports, and the money
flowing out on imports.
Journey Of ₹upee Over The Years Upto The
21st Century
2. ₹upee During Financial Crisis of 2008
USD/INR : Low – 39.03 | High – 50.61 | 22.81% depreciation
(14 Jan 2008) (01 Dec 2008)
Factors causing depreciation during this event:
Selling By FIIs: Forex reserve peaked in May 2008 after which the outflow
of foreign funds started. In just 6 months’ time i.e. May’08 to October’08 the
forex reserve depleted by $15.4 Billion. The reason for depletion (apart from
revaluation of US$ against international currencies) was the net sales in
equity markets. According to the Securities and Exchange Board of India
(SEBI), net sales by FIIs amounted to $ 932.8 million in the second quarter of
2008 and$ 13.00 billion during the year. FIIs started selling their holdings in
Indian companies in order to ease liquidity conditions.
Decline in Capital Inflows: During the financial crisis, capital flows
shrunk sharply from a high of $107 Billion in 2007-08 to just $7.8
Billion in 2008-09 and led to sharp depreciation of the currency. Rupee
plunged from around ₹ 39/$ to ₹ 50/$.
3. Free Fall of ₹upee During The Year 2012-13
USD/INR : Low – 51.74 | High – 68.83 | 24.83% depreciation
(04 Oct 2012) (28 Aug 2013)
Factors causing depreciation during this event:
Quantitative Easing Tapering: QE Tapering is the exact opposite
phenomenon of QE. In this, money is pulled out of the system. This
step was taken by Ben Bernanke (the then Governor of US Federal
Reserve). The cutting back of asset purchases left the lenders with
limited amount of money. A limited money supply means lenders will
have to ration their lending. They will lend out money to those who
can offer the highest interest rates and this competition will send the
interest rates skyrocketing. FIIs started pulling out money from Indian
Bond market to invest at home for higher returns. This outflow
weakened the rupee. This weakening had a ripple effect causing an
outflow from the equities market thereafter. This outflow added
pressure on the already depreciating rupee.
Decline of Rupee
Widening of Current Account Deficit (CAD): 2 Factors; namely –
Import of Gold and Import of Crude Oil put pressure from the
demand side for dollar. CAD rose to such levels where it shattered the
confidence of foreign investors about capability of India to finance its
current account deficit. This also caused slowdown in capital inflows
and therefore contributed to further weakening of rupee. Foreign
investors were wary of investing in India since every dollar they
would bring in India for investment their earnings from it will be
eroded by further depreciation of rupee against US dollar when they
repatriate their earnings out of India. Thus a sort of vicious circle was
set in as the value of rupee falls.
4. Speculators: Small role played by them. Once currency traders and
speculators realise that India's central bank is unable to manage its
exchange rate and reduce the adverse impact on its currency, they
may enter the market in a big way to sell the rupee. As a result, the
rupee may devalue more than it should.
₹upee Falls Yet Again Post The Mean Reversal of
2017-18
USD/INR : Low – 63.25 | High – 74.48 | 15.08% depreciation
(08 Jan 2018) (08 Oct 2018)
Factors causing depreciation during this event:
Turkey currency crisis: Turmoil in Turkish currency affected Indian
currency. After Turkey's central bank struggled to contain its local
currency 'Turkish Lira'. Rupee fell to record low levels since investors
preferred safe-havens such as the USD and the Yen post this plunge
in the Turkish lira & sent all emerging market currencies sharply
lower.
Fed Rate Hike: The rupee came under pressure after the US Federal
Reserve hiked interest rate as it made US treasuries more attractive
and also boosted the dollar. The US Federal Reserve has raised its key
interest rate four times that year, a move that made the dollar more
attractive leading to outflow of speculative capital.
Increase in Oil Imports: Oil imports during April’18-July’18
amounted to $ 46.98 billion, which was 51.5% higher than in the
corresponding period of the previous year. This leads to depletion of
forex reserves.
Looking at all the factors that have caused depreciation of the ₹upee over
the years. Let us see how does each of these factors come in play for the
current virus ridden year.
5. The Year of Misfortune – 2020
USD/INR : Low – 70.69 | High – 77.00 | 8.19% depreciation
(13 Jan 2020) (22 Apr 2020)
War: Trade War between US and China, will lead to increase in exports
from India. Due to the Pandemic - A Shift of Global Manufacturing Hub
from China to other South East Asian Countries is expected. With India to
gain massively. However, India hasn’t seen any real benefits yet due to the
prevailing virus. Hence, considering a very small positive impact of this
factor on the ₹upee.
Current Account Deficit: Steadily slowing economy has ensured that
imports are also falling along with exports; and oil prices which constitutes
of 20% of India’s Merchandise Imports are also declining – making the
imports cheaper. Therefore, reduced exports v/s reduced & cheaper
imports will narrow the current account deficit. “Our current account
tracker points to a small current account deficit of $3 Billion in Q1 2020-21.
And we raise our current account surplus forecast to $19.60 Billion for
entire FY 2021.” – Statement by Barclays. However, one needs to keep in
mind that this surplus is induced due to reduced & cheaper imports and
not due to increased exports.
Selling by FIIs: Up to 30th March 2020, FIIs are net sellers of $14.69 billion,
the highest annual outflow, both in equity and debt. During the great
financial crisis in 2008, FIIs had sold Indian equities worth $12.2 billion,
the highest annual outflow since 1993. The sell off continued post the
aforementioned date.
Decline in Capital Inflow: Even though India expects to receive significant
capital inflows in the near future as a result of shift of manufacturing hub
from China; As things stand currently, India has not reaped any benefits
yet. With the lockdown in place and not more than handful of companies
shown interest in shifting their manufacturing base to India. We aren’t
seeing any capital inflows in the current period.
6. Highly
Positive
Impact
Highly
Negative
Impact
No Impact
Arrows
Quantitative Easing by Foreign Governments: At crucial times such as the
2008 Financial Crisis or the current 2020 Pandemic when the global
financial health is at risk, QE has a negative impact on the rupee. The
investors look for the safety of their capital and therefore end up pulling
their money out of markets such as that of India’s and invest it back in the
US, which is a safer and a more stable market. US Fed for its QE measures
has embarked on a purchasing spree of $500 Billion government-backed
debt through Treasury securities and $200 Billion mortgage-backed
securities. Also created programmes to support the flow of credit to
employers, consumers, and businesses. As seen earlier in 2008, post QE,
companies along with their share price seem to rise from their lows making
those markets more lucrative than Indian markets.
Oil Imports & Decline in Oil Prices: Oil imports consume the largest part
of the forex reserves. A depreciating rupee is bound to offset the decrease
in the international prices of commodities such as oil. Though the oil price
per barrel has fallen but the depreciating rupee has not given any respite
to the importer as they actually have to shell out more money in order to
purchase the same quantity of oil. Therefore, the falling prices has not
created any big positive impact on the ₹upee.
Having a mixed bag of indicators still resulted in a depreciating ₹upee. Has
RBI averted a massive fall of ₹upee or will the anticipated forthcoming
recession drag the ₹upee further down to a new historic low? When does
the buck stop? Keep tracking the above indicators to gauge any movements
beforehand.
THIS COMMUNICATION IS FOR PRIVATE CIRCULATION ONLY. IT IS BASED UPON THE INFORMATION
GENERALLY AVAILABLE TO PUBLIC AND CONSIDERED RELIABLE. THIS REPORT DOES NOT CONSTITUTE AN
INVITATION OR OFFER TO SUBSCRIBE FOR OR PURCHASE OR SALE OF ANY SECURITY. I SHALL NOT BE HELD
RESPONSIBLE FOR ANY DECISION TAKEN BASED ON THIS REPORT.
Author: Kushal Shah
(CA, BCom, CFA L2 Candidate)
www.linkedin.com/in/kushalshah97