Pbr ejemplos páginas de modeling of chemical kinetics and reactor design a. kayode coker
1. Non-Isothermal Reactors 483
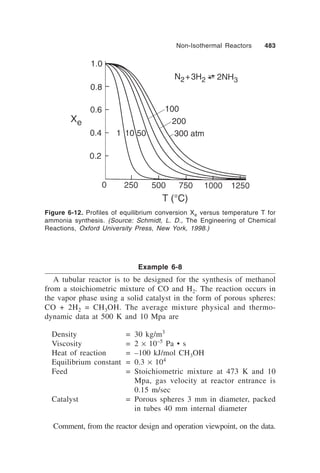
Figure 6-12. Profiles of equilibrium conversion Xe versus temperature T for
ammonia synthesis. (Source: Schmidt, L. D., The Engineering of Chemical
Reactions, Oxford University Press, New York, 1998.)
Example 6-8
A tubular reactor is to be designed for the synthesis of methanol
from a stoichiometric mixture of CO and H2. The reaction occurs in
the vapor phase using a solid catalyst in the form of porous spheres:
CO + 2H2 = CH3OH. The average mixture physical and thermo-
dynamic data at 500 K and 10 Mpa are
Density = 30 kg/m3
Viscosity = 2 × 10⁻⁵ Pa • s
Heat of reaction = –100 kJ/mol CH3OH
Equilibrium constant = 0.3 × 10⁴
Feed = Stoichiometric mixture at 473 K and 10
Mpa, gas velocity at reactor entrance is
0.15 m/sec
Catalyst = Porous spheres 3 mm in diameter, packed
in tubes 40 mm internal diameter
Comment, from the reactor design and operation viewpoint, on the data.
2. 484 Modeling of Chemical Kinetics and Reactor Design
Solution
k1
CO + 2 H 2 [ CH 3OH ∆H R = −100
kJ
k2 mol • CH 3OH
The reaction is reversible and strongly exothermic. The equilibrium
yield of CH3OH decreases as the temperature increases. Hence, a low
temperature and increased pressure will be kept.
The equilibrium constant Keq is expressed as
k1 p CH 3OH
K eq = =
k 2 p CO • p 2 2
H
Since the partial pressure is the mole fraction in the vapor phase
multiplied by the total pressure (i.e., pi = yiP), the equilibrium constant
Keq is expressed as Keq = K y • P∆n, where ∆n = (1 – 1 – 2), the
difference between the gaseous moles of the products and the reactants
as in the ammonia synthesis reaction.
p CH 3OH y CH 3OH 1 ∆G O
K eq = = • = exp − R
p CO • p 2 2
H y CO y 2 2
H P2 RT
The equilibrium constant Keq is determined at any temperature from
standard state information on reactants and product. Considering the
synthesis of CH3OH, the equilibrium conversion Xe is determined for
a stoichiometric feed of CO and H 2 at the total pressure. These
conversions are determined by the number of moles of each species
against conversion X by taking as a basis, 1 mole of CO.
3. Non-Isothermal Reactors 485
Component Number of moles Ni Mole fraction yi
1− X
CO 1 – X
3 − 2X
2(1 − X )
H2 2(1 – X)
3 − 2X
X
CH3OH X
3 − 2X
Total ∑Ni = 3 – 2X ∑yi = 1.0
Substituting the expressions for the mole fractions of CO, H2, and
CH3OH, respectively, for the equilibrium constant Keq yields
X
p CH 3OH y CH 3OH P
K eq = =
1
• 2 = 3 − 2X
1 − X P 2 − 2 X P 2
2
p CO • p 2 2
H y CO y 2 2
H P
3 − 2X 3 − 2X
X (3 − 2 X )
2
K eq =
4 (1 − X ) P 2
3
Figure 6-13 shows plots of equilibrium conversion versus tempera-
ture. The plots indicate the conversion is low at operating temperature
T = 473 K (200°C), but ensures rapid reaction. The conversion per
pass is low, therefore, it is important to maintain a high pressure to
achieve a high conversion. Modern methanol plants operate at about
250°C and 30–100 atm and give nearly equilibrium conversions using
Cu/ZnO catalysts. The unreacted CO and H2 are recycled back into
the reactor.
Reynolds Number
Assuming a reasonable approach to plug flow in the reactor, and
assuming the Reynolds number of the fluid in the reactor is
d pρv
Re p =
µ
where Rep = Reynolds number of the fluid in the reactor
dP = catalyst diameter
4. 486 Modeling of Chemical Kinetics and Reactor Design
Figure 6-12. Profiles of equilibrium conversion Xe versus temperature T for
methanol synthesis. (Source: Schmidt, L. D., The Engineering of Chemical
Reactions, Oxford University Press, New York, 1998.)
ρ = fluid density
µ = fluid viscosity
v = fluid velocity
The Reynolds number Rep is
=
(3 × 10 −3 )(30)(0.15) m • kg • m m • sec
Re p −5 •
2 × 10 m 3
sec kg
= 675
The Reynolds number is 675, indicating that the fluid flow through
the reactor is turbulent.
Example 6-9
Design of Heterogeneous Catalytic Reactors
A bench-scale study of the hydrogenation of nitrobenzene was
investigated by Wilson [2]. In this study, nitrobenzene and hydrogen
were fed at a rate of 65.9 gmol/hr to a 30 cm internal diameter (ID)
reactor containing the granular catalyst. A thermocouple sheath, 0.9
5. Non-Isothermal Reactors 487
cm in diameter, extended down the center of the tube. The void
fraction was 0.424 and the pressure atmospheric. The feed entered the
reactor at 427.5 K, and the tube was immersed in an oil batch main-
tained at the same temperature. The heat transfer coefficient from the
mean reaction temperature to the oil bath was determined experi-
mentally to be 8.67 cal/hr • cm2 • °C. A large excess of hydrogen
was used so that the specific heat of the reaction mixture was equal
to that of hydrogen. The change in total moles of the reaction was
neglected, and the heat of reaction was approximately constant and
equal to –152,100 cal/gmol. The feed concentration of nitrobenzene
was 5 × 10⁻⁷ gmol/cm3. The global rate of reaction was represented
by the expression
2, 958
−
rp = 5.79 × 10 4 C 0.578 e T
where rP = gmol nitrobenzene reacting/cm3hr, expressed in terms of
void volume in the reactor
C = concentration of nitrobenzene, gmol/cm3
T = temperature, K
Calculate the reactor temperature and conversion as a function of
reactor length and comment on the results.
Solution
Concentration of nitrobenzene depends on both temperature and
conversion. If u is the volumetric flowrate at a point in the reactor
where the concentration is C, and uO is the value at the entrance, the
conversion of nitrobenzene is
u O C O − uC uC
X= =1− (6-89)
uOCO uOCO
The volumetric flowrate depends on the temperature and changes
as the temperature changes. Assuming a perfect gas behavior,
CT
X =1− (6-90)
C O TO
6. 488 Modeling of Chemical Kinetics and Reactor Design
Rearranging Equation 6-90 in terms of concentration gives
C O TO
C= (1 − X) (6-91)
T
= (5 × 10 −7 )
427.5
T
(1 − X) (6-92)
Substituting Equation 6-92 into the rate equation yields
0.578 − 2, 958
rp = 5.79 × 10 4 5 × 10 −7 × (1 − X)
427.5
e T
T
0.578 − 2, 958
1− X
= 438 e T (6-93)
T
From the differential mass balance (Equation 5-321) in terms of the
void volume,
FAO dX A = ( − rA ) dVp
′′′ (5-321)
The feed rate of nitrobenzene is
273 (
FA = 65.9 (22, 400)
427.5
5.0 × 10 −7 )
= 1.16 gmol/hr
Hence,
π
1.16 dX A = rp (0.424) (9 − 0.81) dl
4
1.16 dXA = 2.727(rP)dl
dX A 2.727
dl
=
1.16
rp ( )
0.578 − 2, 958
1− X
× 438
2.727
= e T
1.16 T
7. Non-Isothermal Reactors 489
2, 958
1− X
0.578 −
= 1, 038
dX A T
e (6-94)
dl T
The energy balance for a tubular reactor is:
− ∆H R
ρuC p dT − u C AO dX A = U πd t (TE − T )dl (6-95)
a
In terms of the heat transfer coefficient, hO,
− ∆H R
ρuC p dT − u C AO dX A = h O πd t (TE − T )dl
a
or
− ∆H R
ρuC p dT = u C AO dX A − h O πd t (T − TE )dl
a
65.9 × 6.9dT = 1.16(152,00)dXA – 8.67(π)(3)(T – 427.5)dl
∆HR = –152,100 cal/gmol
= 385.48 A − 0.178(T − 427.5)
dT dX
dl (6-96)
dl
Substituting Equation 6-94 into Equation 6-96 gives
1− X
0.578 − 2, 958
= 385.481, 030
dT
e T − 0.178(T − 427.5)
dl T
2, 958
1− X
0.578 −
= 397, 044.4
dT
e T − 0.178 (T − 427.5) (6-97)
dl T
Equations 6-94 and 6-97 are first order differential equations, and
it is possible to solve for both the conversion and temperature of
hydrogenation of nitrobenzene relative to the reactor length of 25 cm.
A computer program PLUG61 has been developed employing the
Runge-Kutta fourth order method to determine the temperature and
conversion using a catalyst bed step size of 0.5 cm. Table 6-6 shows
8. 490 Modeling of Chemical Kinetics and Reactor Design
Table 6-6
Longitudinal temperature profile and conversion in
a reactor for the hydrogenation of nitrobenzene
9. Non-Isothermal Reactors 491
the results of the program and Figure 6-14 illustrates the profile of
the temperature against the catalyst-bed depth. The results show that
as the bed depth increases, the mean bulk temperature steadily increases
and reaches a maximum at about 13.0cm from the entrance to the
reactor. This maximum temperature is referred to as the “hot spot” in
Figure 6-14. Conversion and temperature profiles for the hydrogenation
of nitrobenzene.
10. 492 Modeling of Chemical Kinetics and Reactor Design
the reactor. The conversion also increases and attains the maximum
at about 24.0 cm from the entrance to the reactor. It is assumed that
the radial temperature gradients in the plug flow reactor are negligible.
Finally, these results are in agreement with the experimental results
of Wilson, where the measured temperature was at the center of
the reactor.
TWO-DIMENSIONAL TUBULAR
(PLUG FLOW) REACTOR
Consider a reaction A → products in a tubular reactor with heat
exchanged between the reactor and the surroundings. If the reaction
is exothermic and heat is removed at the walls, a radial temperature
gradient occurs because the temperature at this point is greater than
at any other radial position. Reactants are readily consumed at the
center resulting in a steep transverse concentration gradient. The
reactant diffuses toward the tube axis with a corresponding outward
flow of the products. The concentration and radial temperature gradi-
ents in this system now make the one-dimensional tubular (plug flow)
reactor inadequate. It is necessary to consider both the mass and
energy balance equations for the two dimensions l and r. With refer-
ence to Figure 6-15, consider the effect of longitudinal dispersion and
heat conduction. The following develops both material and energy
balance equations for component A in an elementary annulus radius
δr and length δl. It is also assumed that equimolecular counter diffu-
sion occurs. Other assumptions are:
Figure 6-15. Differential section of two-dimensional tubular reactor.