VIP Kalyan Call Girls 🌐 9920725232 🌐 Make Your Dreams Come True With Mumbai E...
aetna table 2005 2nd
1. Aetna/8
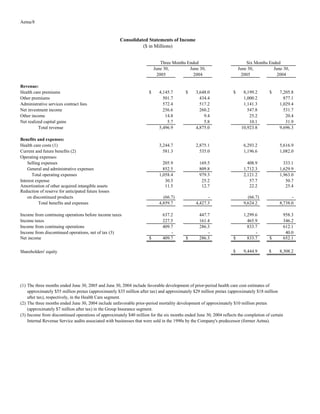
Consolidated Statements of Income
($ in Millions)
Three Months Ended Six Months Ended
June 30, June 30, June 30, June 30,
2005 2004 2005 2004
Revenue:
Health care premiums $ 4,145.7 $ 3,648.0 $ 8,199.2 $ 7,205.8
Other premiums 501.7 434.4 1,000.2 877.1
Administrative services contract fees 572.4 517.2 1,141.3 1,029.4
Net investment income 256.6 260.2 547.8 531.7
Other income 14.8 9.4 25.2 20.4
Net realized capital gains 5.7 5.8 10.1 31.9
Total revenue 5,496.9 4,875.0 10,923.8 9,696.3
Benefits and expenses:
Health care costs (1) 3,244.7 2,875.1 6,293.2 5,616.9
Current and future benefits (2) 581.3 535.0 1,196.6 1,082.0
Operating expenses:
Selling expenses 205.9 169.5 408.9 333.1
General and administrative expenses 852.5 809.8 1,712.3 1,629.9
Total operating expenses 1,058.4 979.3 2,121.2 1,963.0
Interest expense 30.5 25.2 57.7 50.7
Amortization of other acquired intangible assets 11.5 12.7 22.2 25.4
Reduction of reserve for anticipated future losses
on discontinued products (66.7) - (66.7) -
Total benefits and expenses 4,859.7 4,427.3 9,624.2 8,738.0
Income from continuing operations before income taxes 637.2 447.7 1,299.6 958.3
Income taxes 227.5 161.4 465.9 346.2
Income from continuing operations 409.7 286.3 833.7 612.1
Income from discontinued operations, net of tax (3) - - - 40.0
Net income $ 409.7 $ 286.3 $ 833.7 $ 652.1
$ 9,444.9 $ 8,308.2
Shareholders' equity
(1) The three months ended June 30, 2005 and June 30, 2004 include favorable development of prior-period health care cost estimates of
approximately $55 million pretax (approximately $35 million after tax) and approximately $29 million pretax (approximately $18 million
after tax), respectively, in the Health Care segment.
(2) The three months ended June 30, 2004 include unfavorable prior-period mortality development of approximately $10 million pretax
(approximately $7 million after tax) in the Group Insurance segment.
(3) Income from discontinued operations of approximately $40 million for the six months ended June 30, 2004 reflects the completion of certain
Internal Revenue Service audits associated with businesses that were sold in the 1990s by the Company's predecessor (former Aetna).
2. Aetna/9
Summary of Results (1)
($ in Millions)
Three Months Ended Six Months Ended
June 30, June 30, June 30, June 30,
2005 2004 2005 2004
Operating earnings, excluding other item and net favorable development $ 327.6 $ 271.6
Favorable development of prior-period health care cost estimates 35.0 18.0
Unfavorable prior-period mortality development - (7.0)
Operating earnings, excluding other item 362.6 282.6 $ 783.7 $ 591.4
Reduction of reserve for anticipated future losses on
discontinued products 43.4 - 43.4 -
Operating earnings, including other item 406.0 282.6 827.1 591.4
Net realized capital gains 3.7 3.7 6.6 20.7
Income from continuing operations (GAAP measure) 409.7 286.3 833.7 612.1
Income from discontinued operations (2) - - - 40.0
Net income (GAAP measure) $ 409.7 $ 286.3 $ 833.7 $ 652.1
Weighted average common shares - basic 290,663,128 306,350,590 291,983,775 307,102,976
Weighted average common shares - diluted 303,072,306 319,939,126 303,915,023 319,947,412
Summary of Results Per Common Share (1)
Operating earnings, excluding other item and net favorable development $ 1.08 $ .85
Favorable development of prior-period health care cost estimates .12 .06
Unfavorable prior-period mortality development - (.02)
Operating earnings, excluding other item 1.20 .89 $ 2.58 $ 1.85
Reduction of reserve for anticipated future losses on
discontinued products .14 - .14 -
Operating earnings, including other item 1.34 .89 2.72 1.85
Net realized capital gains .01 .01 .02 .06
Income from continuing operations (GAAP measure) 1.35 .90 2.74 1.91
Income from discontinued operations (2) - - - .13
Net income (GAAP measure) $ 1.35 $ .90 $ 2.74 $ 2.04
Shareholders' equity (3) $ 32.57 $ 27.05
(1) Prior-period results per common share and weighted average common shares have been adjusted to reflect the March 11, 2005 two-for-one stock split.
(2) Income from discontinued operations of approximately $40 million for the six months ended June 30, 2004 reflects the completion of certain Internal Revenue
Service audits associated with former Aetna.
(3) Actual common shares outstanding were 290.0 million at June 30, 2005 and 307.1 million at June 30, 2004.
3. Aetna/10
Segment Information (1)
($ in Millions)
Three Months Ended Six Months Ended
June 30, June 30, June 30, June 30,
2005 2004 2005 2004
Health Care:
Total revenue $ 4,796.9 $ 4,226.1 $ 9,490.8 $ 8,372.9
Selling expenses $ 185.1 $ 153.8 $ 369.0 $ 302.6
General and administrative expenses 810.4 769.1 1,622.7 1,544.5
Total operating expenses $ 995.5 $ 922.9 $ 1,991.7 $ 1,847.1
Operating earnings, excluding favorable development $ 308.6 $ 246.0
Favorable development of prior-period health care cost estimates 35.0 18.0
Operating earnings 343.6 264.0 $ 747.6 $ 552.4
Net realized capital gains (losses) 2.5 (1.4) 3.8 5.7
Net income (GAAP measure) $ 346.1 $ 262.6 $ 751.4 $ 558.1
Group Insurance:
Total revenue $ 522.8 $ 463.7 $ 1,057.5 $ 948.6
Selling expenses $ 20.8 $ 15.7 $ 39.9 $ 30.5
General and administrative expenses 38.8 35.7 81.4 75.4
Total operating expenses $ 59.6 $ 51.4 $ 121.3 $ 105.9
Operating earnings, excluding unfavorable development $ 31.3 $ 34.2
Unfavorable prior-period mortality development - (7.0)
Operating earnings 31.3 27.2 $ 62.0 $ 58.0
Net realized capital gains 1.9 2.3 3.3 10.2
Net income (GAAP measure) $ 33.2 $ 29.5 $ 65.3 $ 68.2
Large Case Pensions:
Total revenue $ 177.2 $ 185.2 $ 375.5 $ 374.8
Operating earnings, excluding other item $ 7.5 $ 7.9 $ 11.6 $ 14.0
Reduction of reserve for anticipated future losses on
discontinued products 43.4 - 43.4 -
Operating earnings, including other item 50.9 7.9 55.0 14.0
Net realized capital gains (losses) (.7) 2.8 (.5) 4.8
Net income (GAAP measure) $ 50.2 $ 10.7 $ 54.5 $ 18.8
Corporate Interest:
Interest expense, net of tax $ 19.8 $ 16.5 $ 37.5 $ 33.0
Total Company:
Total revenue $ 5,496.9 $ 4,875.0 $ 10,923.8 $ 9,696.3
Selling expenses $ 205.9 $ 169.5 $ 408.9 $ 333.1
General and administrative expenses 852.5 809.8 1,712.3 1,629.9
Total operating expenses $ 1,058.4 $ 979.3 $ 2,121.2 $ 1,963.0
(1) Revenue and operating expense information is presented before income taxes. Operating earnings information is presented net of income taxes.
4. Aetna/11
Enrollment
(Members in Thousands)
June 30, June 30, December 31, March 31,
2005 2004 2004 2005
Medical Membership:
Commercial 14,221 13,229 13,446 14,162
Medicare 101 100 97 101
Medicaid 113 110 113 112
Total Medical Membership 14,435 13,439 13,656 14,375
Dental Membership (1) 12,976 11,461 11,967 12,833
Pharmacy Membership:
Pharmacy Benefit Management Services 8,579 7,743 7,989 8,505
Mail Order (2) 538 405 458 501
Total Pharmacy Membership 9,117 8,148 8,447 9,006
Group Insurance Membership 13,662 12,594 13,494 14,040
®
Aetna HealthFund (3) 370 197 222 361
Health Care Medical Cost Ratios (4)
($ in Millions)
Three Months Ended Six Months Ended
June 30, June 30, June 30, June 30,
2005 2004 2005 2004
Health Care Premiums:
Health Care Risk (A) $ 4,145.7 $ 3,648.0 $ 8,199.2 $ 7,205.8
Commercial Risk (B) $ 3,896.9 $ 3,411.0 $ 7,702.7 $ 6,737.2
Medicare (C) $ 248.8 $ 237.0 $ 496.5 $ 468.6
Health Care Costs:
Health Care Risk
Health care costs (D) (GAAP measure) $ 3,244.7 $ 2,875.1 $ 6,293.2 $ 5,616.9
Favorable development of prior-period health care cost estimates 55.0 29.0
Health care costs - Adjusted (E) $ 3,299.7 $ 2,904.1
Commercial Risk
Health care costs (F) (GAAP measure) $ 3,022.5 $ 2,672.1 $ 5,860.4 $ 5,218.4
Favorable development of prior-period health care cost estimates 53.0 26.0
Health care costs - Adjusted (G) $ 3,075.5 $ 2,698.1
Medicare
Health care costs (H) (GAAP measure) $ 222.3 $ 202.8 $ 432.9 $ 398.4
Favorable development of prior-period health care cost estimates 2.0 3.0
Health care costs - Adjusted (I) $ 224.3 $ 205.8
Health Care Medical Cost Ratios:
Health Care Risk (D)/(A) (GAAP measure) 78.3% 78.8% 76.8% 77.9%
Health Care Risk - Adjusted (E)/(A) 79.6% 79.6%
Commercial Risk (F)/(B) (GAAP measure) 77.6% 78.3% 76.1% 77.5%
Commercial Risk - Adjusted (G)/(B) 78.9% 79.1%
Medicare (H)/(C) (GAAP measure) 89.3% 85.6% 87.2% 85.0%
Medicare - Adjusted (I)/(C) 90.2% 86.8%
(1) At June 30, 2005, the Company began including Aetna Global Benefits dental membership. Prior period dental membership has been revised accordingly.
(2) Represents members who purchased medications through Aetna's mail order pharmacy during the quarterly period.
(3) Represents members in consumer-directed health plan products included in Aetna's Commercial medical membership.
(4) Health Care Risk includes all medical and dental risk products. Commercial Risk includes all medical and dental risk products except Medicare and Medicaid. Risk includes
all medical and dental products for which the Company assumes all or a majority of health care cost, utilization or other risk.
5. Aetna/12
Operating Margins
($ in Millions)
Three Months Ended Six Months Ended
June 30, June 30, June 30, June 30,
2005 2004 2005 2004
Reconciliation to Income from continuing operations before income taxes:
Operating earnings before income taxes, excluding interest expense, amortization of other
acquired intangible assets, other item and net favorable development (A) $ 551.8 $ 460.8
Favorable development of prior-period health care cost estimates 55.0 29.0
Unfavorable prior-period mortality development - (10.0)
Operating earnings before income taxes, excluding interest expense, amortization of other
acquired intangible assets and other item (B) 606.8 479.8 $ 1,302.7 $ 1,002.5
Interest expense (30.5) (25.2) (57.7) (50.7)
Amortization of other acquired intangible assets (11.5) (12.7) (22.2) (25.4)
Reduction of reserve for anticipated future losses on discontinued products 66.7 - 66.7 -
Net realized capital gains 5.7 5.8 10.1 31.9
Income from continuing operations before income taxes (C) (GAAP measure) $ 637.2 $ 447.7 $ 1,299.6 $ 958.3
Reconciliation to Income from continuing operations:
Operating earnings, excluding interest expense, amortization of other acquired intangible
assets, other item and net favorable development (D) $ 354.9 $ 296.3
Favorable development of prior-period health care cost estimates, net of tax 35.0 18.0
Unfavorable prior-period mortality development, net of tax - (7.0)
Operating earnings, excluding interest expense, amortization of other acquired intangible
assets and other item (E) 389.9 307.3 $ 835.7 $ 640.9
Interest expense, net of tax (19.8) (16.5) (37.5) (33.0)
Amortization of other acquired intangible assets, net of tax (7.5) (8.2) (14.5) (16.5)
Reduction of reserve for anticipated future losses on discontinued products, net of tax 43.4 - 43.4 -
Net realized capital gains, net of tax 3.7 3.7 6.6 20.7
Income from continuing operations (F) (GAAP measure) $ 409.7 $ 286.3 $ 833.7 $ 612.1
Reconciliation of Revenue:
Revenue, excluding net realized capital gains (G) $ 5,491.2 $ 4,869.2 $ 10,913.7 $ 9,664.4
Net realized capital gains 5.7 5.8 10.1 31.9
Total revenue (H) (GAAP measure) $ 5,496.9 $ 4,875.0 $ 10,923.8 $ 9,696.3
Operating Margins:
Pretax operating margin (B)/(G) 11.1% 9.9% 11.9% 10.4%
Pretax operating margin - Adjusted (A)/(G) 10.0% 9.5%
Pretax operating margin (C)/(H) (GAAP measure) 11.6% 9.2% 11.9% 9.9%
After-tax operating margin (E)/(G) 7.1% 6.3% 7.7% 6.6%
After-tax operating margin - Adjusted (D)/(G) 6.5% 6.1%
After-tax operating margin (F)/(H) (GAAP measure) 7.5% 5.9% 7.6% 6.3%
Operating Expenses
($ in Millions)
Total operating expenses (I) (GAAP measure) $ 1,058.4 $ 979.3 $ 2,121.2 $ 1,963.0
Operating Expenses Percentages:
Operating expenses as a % of revenue (I)/(G) 19.3% 20.1% 19.4% 20.3%
Total operating expenses as a % of total revenue (I)/(H) (GAAP measure) 19.3% 20.1% 19.4% 20.2%