Log your LOA pain with Pension Lab's brilliant campaign
southern 2001 Financial Highlights
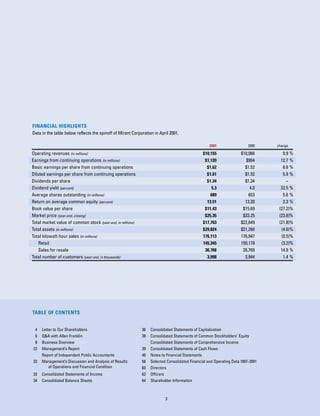
1. FINANCIAL HIGHLIGHTS
Data in the table below reflects the spinoff of Mirant Corporation in April 2001.
2001 2000 change
Operating revenues (in millions) $10,066 0.9)%
$10,155
Earnings from continuing operations (in millions) $994 12.7)%
$1,120
Basic earnings per share from continuing operations $1.52 6.6)%
$1.62
Diluted earnings per share from continuing operations $1.52 5.9)%
$1.61
Dividends per share $1.34 –)
$1.34
Dividend yield (percent) 4.0 32.5)%
5.3
Average shares outstanding (in millions) 653 5.6)%
689
Return on average common equity (percent) 13.20 2.3)%
13.51
Book value per share $15.69 (27.2)%
$11.43
Market price (year-end, closing) $33.25 (23.8)%
$25.35
Total market value of common stock (year-end, in millions) $22,649 (21.8)%
$17,703
Total assets (in millions) $31,260 (4.6)%
$29,824
Total kilowatt-hour sales (in millions) 176,947 (0.5)%
176,113
Retail 150,178 (3.2)%
145,345
Sales for resale 26,769 14.9)%
30,768
Total number of customers (year-end, in thousands) 3,944 1.4)%
3,998
TABLE OF CONTENTS
4 Letter to Our Shareholders 36 Consolidated Statements of Capitalization
6 Q&A with Allen Franklin 38 Consolidated Statements of Common Stockholders’ Equity
8 Business Overview Consolidated Statements of Comprehensive Income
22 Management’s Report 39 Consolidated Statements of Cash Flows
Report of Independent Public Accountants 40 Notes to Financial Statements
23 Management’s Discussion and Analysis of Results 58 Selected Consolidated Financial and Operating Data 1997-2001
of Operations and Financial Condition 60 Directors
33 Consolidated Statements of Income 62 Officers
34 Consolidated Balance Sheets 64 Shareholder Information
3