Colorimetry, spectrophotometry and nephelometry.pptx
B37
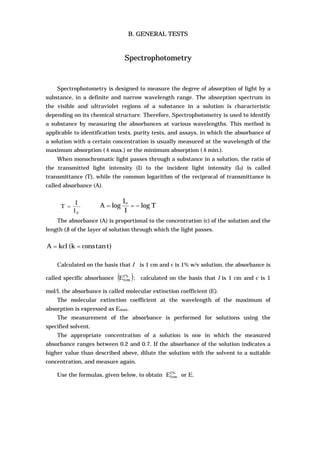
1. B. GENERAL TESTS
Spectrophotometry
Spectrophotometry is designed to measure the degree of absorption of light by a
substance, in a definite and narrow wavelength range. The absorption spectrum in
the visible and ultraviolet regions of a substance in a solution is characteristic
depending on its chemical structure. Therefore, Spectrophotometry is used to identify
a substance by measuring the absorbances at various wavelengths. This method is
applicable to identification tests, purity tests, and assays, in which the absorbance of
a solution with a certain concentration is usually measured at the wavelength of the
maximum absorption (λmax.) or the minimum absorption (λmin.).
When monochromatic light passes through a substance in a solution, the ratio of
the transmitted light intensity (I) to the incident light intensity (I0) is called
transmittance (T), while the common logarithm of the reciprocal of transmittance is
called absorbance (A).
0I
I
T =
The absorbance (A) is proportional to the concentration (c) of the solution and the
length (l) of the layer of solution through which the light passes.
Calculated on the basis that l is 1 cm and c is 1% w/v solution, the absorbance is
called specific absorbance ( )%1
cm1E ; calculated on the basis that l is 1 cm and c is 1
mol/l, the absorbance is called molecular extinction coefficient (E).
The molecular extinction coefficient at the wavelength of the maximum of
absorption is expressed as Emax.
The measurement of the absorbance is performed for solutions using the
specified solvent.
The appropriate concentration of a solution is one in which the measured
absorbance ranges between 0.2 and 0.7. If the absorbance of the solution indicates a
higher value than described above, dilute the solution with the solvent to a suitable
concentration, and measure again.
Use the formulas, given below, to obtain %1
cm1E or E.
Tlog
I
I
logA
o
−==
)ttanconsk(kclA ==
2. B. GENERAL TESTS
l(%)c
a
E
%1
cm1
×
=
l)mol(c
a
E
×
=
where l = length of solution layer (cm),
a = measured absorbance,
c (%) = concentration of solution (% w/v),
c (mol) = molarity of solution(mol/l).
Hereinafter in the Monographs, such a specification as “ %1
cm1E (265 nm) = 445−
485” indicates that when determined at a wavelength of 265 nm by the specified
spectrophotometric procedure, %1
cm1E is 445−485.
Apparatus and Procedure A photoelectric spectrophotometer is used for the
measurement of the absorption. The photoelectric spectrophotometer consists of a
monochrometer and a photoelectric photometer. A light source used is a tungsten
lamp for the measurement in the visible range, and a heavy hydrogen discharge
lamp for the measurement in the ultraviolet range. A quartz or glass cell is used for
the visible range; a quartz cell is used for the ultraviolet range. Unless otherwise
specified, a suitable path length of the cell is 1 cm.
Proceed as directed below for the measurement of absorption.
Set the wavelength scale at the specified position, put the reference solution into the
light path, and adjust the instrument so that the absorbance of the reference solution
is zero. Unless otherwise specified, use the solvent for the test solution as the
reference solution. Then, put the sample solution into the light path, and read the
absorbance.
Calibration of Wavelength and Absorbance Scales The wavelength scale is
usually calibrated, using 239.95 nm, 253.65 nm, 302.15 nm, 313.16 nm, 334.15 nm,
365.48 nm, 404.66 nm, 435.83 nm, and 546.10 nm for a quartz-mercury or glass-
mercury arc lamp, or 486.00 nm and 656.10 nm for a heavy hydrogen discharge lamp.
Weigh accurately about 0.06g of potassium dichromate (standard reagent),
previously pulverized and dried between 100℃ and 110℃ for 3 to 4 hours, and
dissolve in 0.005 mol/l sulfuric acid to make exactly 1,000ml. The absorbance scale is
calibrated, using this solution. The %1
cm1E values of this solution are 122.9−126.2
(standard value 124.5), 142.4−145.7(standard value 144.0), 47.0-50.3 ( standard
value 48.6), and 104.9−108.2 (standard value 106.6) at the wavelengths of 235 nm
(min.), 257 nm (max.), 313 nm (min.), and 350 nm (max.), respectively.