
Recommended
Recommended
More Related Content
What's hot
What's hot (19)
Viewers also liked
Viewers also liked (12)
Similar to Prediction of just suspended speed for mixed slurries at
Similar to Prediction of just suspended speed for mixed slurries at (20)
Recently uploaded
Recently uploaded (20)
Prediction of just suspended speed for mixed slurries at
- 1. chemical engineering research and design 9 1 ( 2 0 1 3 ) 227–233 Contents lists available at SciVerse ScienceDirect Chemical Engineering Research and Design journal homepage: www.elsevier.com/locate/cherd Prediction of just suspended speed for mixed slurries at high solids loadings Inci Ayrancia,∗ , Theodore Nga , Arthur W. Etchells IIIb , Suzanne M. Krestaa a Department of Chemical and Materials Engineering, University of Alberta, Edmonton, Canada T6G 2V4 b Rowan University, Glassboro, NJ, United States a b s t r a c t One design heuristic used to determine the just suspended speed, Njs, for mixed slurries assumes that the mixture Njs is dominated by the particle phase with the maximum Njs. This approach does not incorporate the effect of the second solid phase. Two new models are proposed to predict the mixture Njs: the power model and the momentum model. These models determine the mixture Njs using the sum of the power or the sum of the momentum required to suspend the individual solid phases. The models were tested using experimental data for two impellers, a Lightnin A310 impeller and a 45◦ pitched-blade turbine. A range of off-bottom clearances, and six mixtures of solids up to 27 wt% solids loading completed the data set. The power model accurately predicts mixture Njs for both impellers over the full range of clearances and up to 27 wt% mixtures. © 2012 The Institution of Chemical Engineers. Published by Elsevier B.V. All rights reserved. Keywords: Just suspended speed; Stirred tank; Power model; Momentum model; Mixture; High solids loading 1. Introduction In many solid–liquid mixing operations the main objective is mass transfer between the two phases. To maximize the mass transfer the entire surface area of the solids should be exposed. This can be achieved by operating at the complete off-bottom suspension condition. The key operating parame- ter for this condition is the impeller speed, which is called the just suspended speed (Njs). Njs is defined as the impeller speed at which no solids remain stationary at the bottom of the tank for more than 1 or 2 s (Zwietering, 1958). Solid–liquid mixing is a power intensive operation, so accurate prediction of Njs is important. Current correlations are limited to unimodal slur- ries at low solids loadings, but many industrial slurries are composed of mixtures of solids with varying densities and par- ticle sizes at high concentrations. The gap between research and industry is vast, and the need for an accurate design model for mixed slurry Njs is clear. Current correlations have significant limitations because many parameters play an active role in solids suspension. Abbreviations: A310, axial impeller provided by Lightnin; B, bronze; LG, large glass beads; Ni, nickel; PBT, pitched blade turbine; R, ion exchange resin; S, sand; SG, small glass beads or specific gravity; UF, urea formaldehyde; wt%, weight percent. ∗ Corresponding author at: Department of Chemical and Materials Engineering, University of Alberta, 7th Floor ECERF, 9107-116 Street, Edmonton, Alberta, Canada T6G 2V4. Tel.: +1 780 492 9221; fax: +1 780 492 2881. E-mail address: iayranci@ualberta.ca (I. Ayranci). Received 8 February 2012; Received in revised form 10 July 2012; Accepted 1 August 2012 Geometry is by far the most important factor. The effects of impeller and tank diameter, impeller type, off-bottom clear- ance of the impeller, shape of the tank bottom, and the presence, shape, and clearance of the baffles have been stud- ied by many authors (Baldi et al., 1978; Ibrahim and Nienow, 1996; Myers and Fasano, 1992; Armenante and Nagamine, 1998). Njs is also a function of particle and liquid properties, such as the particle density, particle diameter and shape, and liquid density and viscosity (Nienow, 1968; Baldi et al., 1978). The behavior of the particles is different when there are many other particles around them; therefore, solids loading is also very important (Ayranci and Kresta, 2011). The large number of parameters affecting Njs makes it difficult to determine a robust design correlation. The first cor- relation was suggested by Zwietering (1958) and it is still the correlation that is most often used in calculations. Njs = S g( s − L) L 0.45 d0.2 p 0.1X0.13 D0.85 (1) 0263-8762/$ – see front matter © 2012 The Institution of Chemical Engineers. Published by Elsevier B.V. All rights reserved. http://dx.doi.org/10.1016/j.cherd.2012.08.002
- 2. 228 chemical engineering research and design 9 1 ( 2 0 1 3 ) 227–233 Nomenclature Roman characters C off-bottom clearance (m) D impeller diameter (m) dp particle diameter (m) g acceleration due to gravity (m/s2) H liquid height (m) M momentum (kg m/s2) Mjs momentum at just suspended conditions (kg m/s2) Mjs,1 Mjs for particle one (kg m/s2) Mjs,2 Mjs for particle two (kg m/s2) Mjs,mix Mjs for mixture (kg m/s2) Mo momentum number N impeller rotational speed (rps or rpm) Njs just suspended speed (rps or rpm) Njs,1 Njs for particle 1 (rps or rpm) Njs,2 Njs for particle 2 (rps or rpm) Njs,max Njs maximum (rps or rpm) Njs,mix mixture Njs (rps or rpm) Np power number Pjs power consumption at just suspended speed conditions (W) Pjs,1 Pjs for particle 1 (W) Pjs,2 Pjs for particle 2 (W) Pjs,mix Pjs for mixture (W) r radius (m) S Zwietering’s Njs constant T tank diameter (m) Vz velocity in the axial direction Wb baffle width (m) xS mass fraction of the solids in the slurry xL mass fraction of the liquid in the slurry X Zwietering’s mass ratio percent (mass of solid/mass of liquid × 100) Greek characters kinematic viscosity (m2/s) L liquid density (kg/m3) S solid density (kg/m3) sl slurry density (kg/m3) sl,1 unimodal slurry density for particle 1 (kg/m3) sl,2 unimodal slurry density for particle 2 (kg/m3) sl,mix mixture slurry density (kg/m3) Some of the parameters that affect Njs are included in this correlation but the accuracy of the exponents has been ques- tioned by many authors. Kasat and Pandit (2005) compiled the different exponents on the common parameters suggested by various authors. Their comparison showed that the Zwi- etering correlation is still the one that predicts the data most closely. The Zwietering correlation, however, does not provide an answer for mixed slurry Njs. The literature on mixed slurry suspension is only beginning to be developed, and initial studies focused on dilute slurries. Baldi et al. (1978) studied a mixture of glass beads with two particle sizes and found that Njs can be predicted using an average particle size, at low solids loadings. Montante and Magelli (2007) did a computational study on the distribution of solids for dilute slurries with two solid phases which have different densities but same particle sizes. They showed that the two solids phases are not affected by each other. Recently Ayranci and Kresta (2011) reported results for a wide vari- ety of binary mixtures at high solids loadings (up to 56 wt%). Their study showed that the presence of a second solid phase may significantly affect the mixture Njs. This effect is ampli- fied for mixtures above 20 wt% solids, because at that point the particle–particle interactions start to dominate. The par- ticle sizes and the densities of the two solid phases play an important role in the mixture Njs. The current design heuristic for mixed slurries is to assume that the mixture is composed of only the particle fraction that is hardest to suspend. The Njs for that fraction is predicted using the Zwietering correlation, and treated as the mixture Njs. This design heuristic has many flaws, some of which were shown by Ayranci and Kresta (2011). Of the five mixtures they tested, only one mixture followed the design heuristic up to high solids loadings, and a second mixture followed it up to 13 wt%, but then failed. The other mixtures did not follow the design heuristic. The ratio of the particle size, the particle den- sity, and the solids loadings of the two solid phases all had an effect on mixture Njs. A more robust and physically realistic model for predicting mixture Njs is needed. In this study we propose and test two models that are based on the total power and the total momentum required to sus- pend solids in a stirred tank. 2. Model development 2.1. Current design heuristic The current design heuristic is based on the maximum uni- modal Njs in a mixture: Njs,mix = max(Njs,1, Njs,2) (2) For example, if a mixture Njs needed to be determined for a mixture of 1.5 wt% SG with 1.5 wt% B, the Njs of the uni- modal slurries of the two particles should be calculated and the maximum value should be used as the mixture Njs. The unimodal slurry Njs is predicted from the Zwietering correla- tion (Eq. (1)). In the example the unimodal slurry Njs is 318 rpm for 1.5 wt% SG and 1142 rpm for 1.5 wt% B. The mixture Njs is the maximum of the two values, which is 1142 rpm. 2.2. Power model The power model is proposed based on a hypothesis that the power required to suspend a mixture is the sum of the power required to suspend each of the solid phases in the mixture. Pjs,mix = Pjs,1 + Pjs,2 (3) where Pjs,mix is the power required to suspend the mixture, and Pjs,1 and Pjs,2 are the power required to suspend the first and the second solid phases, respectively. The power required to suspend each solid phase is calculated at the just suspended condition based on the unimodal slurry density: Pjs = slNjs 3 D5 Np (4) sl = 1 (xs/ s) + (xL/ L) (5)
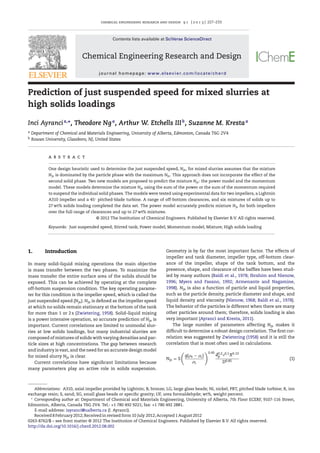
- 3. chemical engineering research and design 9 1 ( 2 0 1 3 ) 227–233 229 In combining Eqs. (3) and (4) to find Njs,mix, the impeller diameter term, D, cancels out. Current practice is to use the slurry density to correct for the presence of the solids and assume that the power number is constant, which also allows us to eliminate Np. This assumption has some uncertainty due to the presence of a low concentration layer at the top of the vessel which will increase the solids concentration in the bottom of the vessel, and the possibility of a lower solids concentration in the vicinity of the impeller due to centrifugal forces. Micheletti et al. (2003) and Jafari et al. (2012) inves- tigated whether there is an effect of solids concentration, particle size, and particle type on the power number. Jafari et al. (2012) found that in general the power number decreases at high solids loadings by of the order of 20%, while Micheletti et al. (2003) found that it either stays the same, or increases by about 20%. Our measurements of Np at varying Re for single phase and 25 wt% small glass beads showed that the power number for the single phase and the slurry are almost the same. The assumption that the power number remains the same for each slurry (Pjs,mix, Pjs,1, and Pjs,2) was applied, with the understanding that this may introduce some error into the model. When D and Np are cancelled out the mixture Njs becomes a function of the densities of the mixed and the unimodal slurries and the Njs’s of the unimodal slurries. Njs,mix = sl,1N3 js,1 + sl,2N3 js,2 sl,mix 1/3 (6) In Eq. (6), Njs,1 and Njs,2 can be calculated using Eq. (1), or replaced with the experimental values. It should be noted that the power model does not include any terms to take the particle–particle interactions into account; therefore, it is very likely that the mixture Njs will not be accurately predicted when particle–particle interactions are strong. 2.3. Momentum model A second hypothesis is that the momentum required to sus- pend a mixture is equivalent to the sum of the momentum required to suspend each of the solid phases in the mixture. Mjs,mix = Mjs,1 + Mjs,2 (7) where Mjs,mix is the momentum required to suspend the mixture, and Mjs,1 and Mjs,2 are the momentum required to suspend each individual unimodal slurry. The momentum, M, can be calculated through the dimensionless momentum number (Mo) (Machado et al., 2011): Mo = D/2 0 LV2 z 2 rdr LN2D4 = M LN2D4 (8) The momentum required to suspend each solid phase is calculated at just suspended conditions: Mjs = Mo slN2 jsD4 (9) In combining Eqs. (7) and (9) to find Njs,mix, the momen- tum number and impeller diameter are constant, so the terms cancel out. Like the power model, the mixture Njs is thus a Fig. 1 – The experimental setup with a PBT impeller. Njs is determined by visual observation below the tank bottom. function of the mixed and unimodal slurry densities and the Njs of the unimodal slurries, this time to the power of two: Njs,mix = sl,1N2 js,1 + sl,2N2 js,2 sl,mix 1/2 (10) 3. Experimental procedure Fig. 1 shows the experimental setup. A fully baffled (Wb = T/10) cylindrical plexiglass tank with an inner diameter of 24 cm was used for the measurements. The cylindrical tank was placed inside a square tank to prevent optical distortion. In order to maintain stability at high impeller speeds, both tanks were bolted to a steel frame. The just suspended speed was observed visually from the bottom of the tank. A Lightnin A310 impeller and a four bladed 45◦ down pumping PBT both with a diameter of D = T/3 were used. The impellers were attached to a shaft with a diameter of 1.27 mm (T/20). The off-bottom clearance was defined as the distance between the bottom of the impeller hub and the bottom of the tank. The blades were flush with the bottom of the hub for both impellers. The dimensionless off-bottom clearance, C/T, was varied from 0.15 to 0.33. Water was used as the liquid phase for all the experiments. Seven different particles with various physical properties were tested: nickel (Ni), small glass (SG), urea formalde- hyde (UF), bronze (B), sand (S), large glass (LG), and ion
- 4. 230 chemical engineering research and design 9 1 ( 2 0 1 3 ) 227–233 Table 1 – Particle properties. Type Size (m) Density (kg/m3) Vt (m/s) Nickel (Ni) 61–104 8900 0.139 Small glass beads (SG) 74–125 2500 0.066 Urea formaldehyde (UF) 150–250 1323 0.044 Bronze (B) 150–297 8855 0.225 Sand (S) 350–500 2656 0.144 Large glass beads (LG) 595–841 2500 0.177 Ion exchange resin (R) 677 1370 0.086 exchange resin (R). The particle properties are given in Table 1. The particles were chosen to give a wide range of densi- ties (1.3 < SG < 8.9) and particle sizes (61 m < dp < 841 m). The mixtures tested are given in Table 2 along with the ranges of solids loadings. For each data set the mass of the more dense particles was kept constant while the mass of the less dense particles increased. A set of experiments where the mass of the dense particle is higher than the mass of the less dense particle was also conducted to validate the models tested for all cases. This set of experiments was for the mixture of R with LG at C/T = 0.25. At the beginning of every experiment, the tank was filled with water and particles were weighed and poured into it. The liquid height was then adjusted to give H = T. The shaft was attached to the motor, and the off-bottom clearance was adjusted. Once the desired clearance was achieved, the impeller was started. The impeller speed was increased in steps and the system was left for 2 min to reach steady state. After steady state was reached, the particle behavior at the bottom of the tank was observed for 15–45 s to determine whether Njs was reached. The particles behind the baffles were consistently the last particles to be suspended. The just suspended speed was reached when no particles remained stationary at the bottom of the tank for more than 1 or 2 s (Zwietering, 1958). After that the motor was switched off and the off-bottom clearance was adjusted for the new measure- ment. More details about the experimental setup and the procedure are given in Ayranci and Kresta (2011). 4. Results and discussion First the current design heuristic results are presented to pro- vide a baseline for comparison. Next the performance of the power and momentum models is tested for all six mixtures of solids, two impellers, and varying off-bottom clearances, and the performance of the two models is compared. The power and the momentum models require the use of unimodal slurry Njs’s. Initially the unimodal slurry Njs’s are calculated from the Zwietering correlation, and then the experimental values are used. The performance of the power model is compared for the two cases. 0 200 400 600 800 1000 1200 1400 1600 1800 2000a b 0 200 400 600 800 1000 1200 1400 1600 1800 2000 Njs,max(rpm) Njs, measured (rpm) SG+B C/T=0.15 SG+B C/T=0.25 SG+B C/T=0.33 SG+Ni C/T=0.15 SG+Ni C/T=0.25 SG+Ni C/T=0.33 R+B C/T=0.15 R+B C/T=0.25 R+B C/T=0.33 LG+B C/T=0.15 LG+B C/T=0.25 LG+B C/T=0.33 R+LG C/T=0.15 R+LG C/T=0.25 R+LG C/T=0.33 Standard deviation: 10% PBT - Current design heuristic = 0 200 400 600 800 1000 1200 1400 1600 1800 2000 0 200 400 600 800 1000 1200 1400 1600 1800 2000 Njs,max(rpm) Njs, measured (rpm) SG+B C/T=0.15 SG+B C/T=0.25 SG+B C/T=0.325 SG+Ni C/T=0.15 SG+Ni C/T=0.25 SG+Ni C/T=0.325 R+B C/T=0.15 R+B C/T=0.25 R+B C/T=0.325 LG+B C/T=0.15 LG+B C/T=0.25 R+LG C/T=0.15 R+LG C/T=0.25 R+LG C/T=0.325 UF+S C/T=0.25 Standard deviation: 12.6% A310 - Current design heuristic = Fig. 2 – The parity plot between the current design heuristic and the experimental data. The current design heuristic uses the maximum Njs in the mixture, calculated using the Zwietering correlation. (a) PBT and (b) A310. 4.1. Test of current design heuristic Fig. 2a and b compares the prediction of Njs,max using the Zwietering correlation to the experimental mixture Njs. In the Zwietering correlation, S is a function of impeller and tank geometry and particle properties. Fig. 2a and b represents the best possible predictions using the current form of the Zwi- etering correlation since the S values were obtained for the specific particles and the geometries used here (Ayranci and Kresta, 2011). For each mixture the wt% of the more diffi- cult to suspend solids remains constant as the wt% of the easier to suspend solids increases. The prediction of mix- ture Njs is constant because the Njs of the easier to suspend solids does not change enough with increasing concentration to overtake Njs,max. In Fig. 2a the mixture Njs for R with LG at Table 2 – Particle mixtures and solids loadings. Less dense particles (wt%) Denser particles (wt%) Total solids loading Density ratio Particle size ratio wt% vol% SG (1.5–26) B (1.5–1.3) 3–27.3 0.8–12 ∼1:3.5 ∼1:2 LG (1.5–26) B (1.5–1.3) 3–27.3 0.8–12 ∼1:3.5 ∼3:1 R (1.5–26) B (1.5) 3–27.5 1.3–21.8 ∼1:6.5 ∼3:1 R (1.5–25) LG (1.5–1.4) 3–26.4 1.7–20 ∼1:1.8 ∼1:1 SG (1.5–26) Ni (1.5–1.3) 3–27.3 0.77–14.9 ∼1:3.6 ∼1:1 UF (1–10) S (1–5) 2–15 1.1–9.1 ∼1:2 ∼1:2
- 5. chemical engineering research and design 9 1 ( 2 0 1 3 ) 227–233 231 Table 3 – The list of S values used in the calculations for unimodal slurry Njs. Impeller D C Sa A310 T/3 0.15 6.84 0.25 7.54 0.325 7.97 PBT T/3 0.15 5.4 0.25 6.18 0.33 7.15 a The S values were taken from Ayranci and Kresta (2011). C/T = 0.15 remains constant even though the concentration of R changes at each experimental point and the experimental Njs does in fact increase. The predicted mixture Njs is similar to the experimental data at the lowest solids concentration, but is consistently lower than the experimental Njs when the concentration increases. The current design heuristic fails to capture the physics behind mixed solids suspension. The effect of the presence of both solid phases must be included in the model. The standard deviation between the measured and the predicted values for all of the mixtures at varying off- bottom clearances is 10% for the PBT and 12.6% for the A310. The fact that the trend does not follow the experimental data is of greater concern. 0 200 400 600 800 1000 1200 1400 1600 1800 2000a b 0 200 400 600 800 1000 1200 1400 1600 1800 2000 Njs,predicted(rpm) Njs, measured (rpm) SG+B C/T=0.15 SG+B C/T=0.25 SG+B C/T=0.33 SG+Ni C/T=0.15 SG+Ni C/T=0.25 SG+Ni C/T=0.33 R+B C/T=0.15 R+B C/T=0.25 R+B C/T=0.33 LG+B C/T=0.15 LG+B C/T=0.25 LG+B C/T=0.33 R+LG C/T=0.15 R+LG C/T=0.25 R+LG C/T=0.33 Standard deviation: 8.3% PBT - Power Model (using Zwietering for unimodal Njs) = + 0 200 400 600 800 1000 1200 1400 1600 1800 2000 0 200 400 600 800 1000 1200 1400 1600 1800 2000 Njs,predicted(rpm) Njs, measured (rpm) SG+B C/T=0.15 SG+B C/T=0.25 SG+B C/T=0.325 SG+Ni C/T=0.15 SG+Ni C/T=0.25 SG+Ni C/T=0.325 R+B C/T=0.15 R+B C/T=0.25 R+B C/T=0.325 LG+B C/T=0.15 LG+B C/T=0.25 R+LG C/T=0.15 R+LG C/T=0.25 R+LG C/T=0.325 UF+S C/T=0.25 Standard deviation: 9.7% A310 - Power Model (using Zwietering for unimodal Njs) Fig. 3 – The prediction of mixture Njs without any experimental data using the power model and the Zwietering correlation with the (a) PBT and (b) A310. 4.2. Power model and momentum model using Zwietering unimodal Njs To find the mixture Njs through the power or momentum mod- els, the slurry densities are first calculated from Eq. (5). The unimodal slurry Njs’s are calculated from the Zwietering cor- relation (Eq. (1)). The S values used in the calculations are given in Table 3. The mixture Njs is then calculated from Eq. (6) for the power model, and from Eq. (10) for the momentum model. Fig. 3a and b shows the power model parity plots for the PBT and the A310. While some data points are on the parity line, a similar trend to the current design heuristic (Fig. 2a and b) is seen: the data flattens out as the solids loading is increased. A comparison of the power model (Fig. 3a and b) with the cur- rent design heuristic (Fig. 2a and b) shows that there is no significant improvement from the current design heuristic to the power model prediction. The standard deviation is 8.3% for the PBT and 9.7% for the A310. The low standard devia- tion does not give information about the trend, and the trend shows that the physics is not captured. Fig. 4a and b shows the momentum model parity plots for the PBT and the A310 impellers. The trend in these fig- ures is very similar to the power model, and also the current design heuristic. This may indicate that there is no signifi- cant difference between the two models and the heuristic. It should, however, be noted that these predictions use the Zwi- etering correlation for unimodal slurry Njs’s. The Zwietering 0 200 400 600 800 1000 1200 1400 1600 1800 200a b 0 0 200 400 600 800 1000 1200 1400 1600 1800 2000 Njs,predicted(rpm) Njs, measured (rpm) SG+B C/T=0.15 SG+B C/T=0.25 SG+B C/T=0.33 SG+Ni C/T=0.15 SG+Ni C/T=0.25 SG+Ni C/T=0.33 R+B C/T=0.15 R+B C/T=0.25 R+B C/T=0.33 LG+B C/T=0.15 LG+B C/T=0.25 LG+B C/T=0.33 R+LG C/T=0.15 R+LG C/T=0.25 R+LG C/T=0.33 Standard deviation: 8.8% PBT - Momentum model (using Zwietering for unimoldal Njs) 0 200 400 600 800 1000 1200 1400 1600 1800 2000 0 200 400 600 800 1000 1200 1400 1600 1800 2000 Njs,predicted(rpm) Njs, measured (rpm) SG+B C/T=0.15 SG+B C/T=0.25 SG+B C/T=0.325 SG+Ni C/T=0.15 SG+Ni C/T=0.25 SG+Ni C/T=0.325 R+B C/T=0.15 R+B C/T=0.25 R+B C/T=0.325 LG+B C/T=0.15 LG+B C/T=0.25 R+LG C/T=0.15 R+LG C/T=0.25 R+LG C/T=0.325 UF+S C/T=0.25 Standard deviation: 8.8% A310 - Momentum model (using Zwietering for unimodal Njs) Fig. 4 – The prediction of mixture Njs without any experimental data using the momentum model and the Zwietering correlation with the (a) PBT and (b) A310.
- 6. 232 chemical engineering research and design 9 1 ( 2 0 1 3 ) 227–233 correlation is known to have limited accuracy above 10 wt% solids, so above this concentration the predictions are not very reliable. In order to test the true strength of the power and momentum models, the experimental unimodal slurry Njs’s are used in a second test. 4.3. Power model and momentum model using experimental data Fig. 5a and b shows the mixture Njs predicted from power model where the unimodal slurry Njs is obtained from experi- ments. These plots show a completely different trend than the predictions using Zwietering unimodal slurry Njs’s. The pre- dicted Njs’s follow the parity line closely. Most of the data is within ±20% of the parity line. This indicates that the physics of the solids suspension is captured up to 20 wt% solids for all mixtures. Beyond 20 wt% solids, particle–particle interac- tions can become quite strong. For the LG + B, R + B, and R + LG mixtures Njs increases with increasing solids and the model captures Njs up to the highest loading tested, 27 wt% solids. The data for UF + S goes up to only 10 wt% solids. For the SG + B mixture there is an unexpected drop in Njs above 20 wt% SG (Ayranci and Kresta, 2011) and for SG + Ni Njs is constant. The power model cannot predict these effects because there are no terms for particle–particle interactions. Based on this informa- tion the data points above 20 wt% SG for both SG + B and SG + Ni mixtures were eliminated from the data set shown in Fig. 5a and b and from subsequent analysis. The resulting standard 0 200 400 600 800 1000 1200 1400 1600 1800 2000a b 0 200 400 600 800 1000 1200 1400 1600 1800 2000 Njs,predicted(rpm) Njs, measured (rpm) SG+B C/T=0.15 SG+B C/T=0.25 SG+B C/T=0.33 SG+Ni C/T=0.15 SG+Ni C/T=0.25 SG+Ni C/T=0.33 R+B C/T=0.15 R+B C/T=0.25 R+B C/T=0.33 LG+B C/T=0.15 LG+B C/T=0.25 LG+B C/T=0.33 R+LG C/T=0.15 R+LG C/T=0.25 R+LG C/T=0.33 Standard deviation: 9.6% PBT - Power model = + 0 200 400 600 800 1000 1200 1400 1600 1800 2000 0 200 400 600 800 1000 1200 1400 1600 1800 2000 Njs,predicted(rpm) Njs, measured (rpm) SG+B C/T=0.15 SG+B C/T=0.25 SG+B C/T=0.325 SG+Ni C/T=0.15 SG+Ni C/T=0.25 SG+Ni C/T=0.325 R+B C/T=0.15 R+B C/T=0.25 R+B C/T=0.325 LG+B C/T=0.15 LG+B C/T=0.25 R+LG C/T=0.15 R+LG C/T=0.25 R+LG C/T=0.325 UF+S C/T=0.25 Standard deviation: 9% A310 - Power model = + Fig. 5 – The parity plot for the power model at varying clearances for all mixtures with the (a) PBT and (b) A310. 0 200 400 600 800 1000 1200 1400 1600 1800 2000a b 0 200 400 600 800 1000 1200 1400 1600 1800 2000 Njs,predicted(rpm) Njs, measured (rpm) SG+B C/T=0.15 SG+B C/T=0.25 SG+B C/T=0.33 SG+Ni C/T=0.15 SG+Ni C/T=0.25 SG+Ni C/T=0.33 R+B C/T=0.15 R+B C/T=0.25 R+B C/T=0.33 LG+B C/T=0.15 LG+B C/T=0.25 LG+B C/T=0.33 R+LG C/T=0.15 R+LG C/T=0.25 R+LG C/T=0.33 Standard deviation: 17.3% PBT - Momentum model = + 0 200 400 600 800 1000 1200 1400 1600 1800 2000 0 200 400 600 800 1000 1200 1400 1600 1800 2000 Njs,predicted(rpm) Njs, measured (rpm) SG+B C/T=0.15 SG+B C/T=0.25 SG+B C/T=0.325 SG+Ni C/T=0.15 SG+Ni C/T=0.25 SG+Ni C/T=0.325 R+B C/T=0.15 R+B C/T=0.25 R+B C/T=0.325 LG+B C/T=0.15 LG+B C/T=0.25 R+LG C/T=0.15 R+LG C/T=0.25 R+LG C/T=0.325 UF+S C/T=0.25 Standard deviation: 15.7% A310 - Momentum model = + Fig. 6 – The parity plot for the momentum model at varying clearances for all mixtures with the (a) PBT and (b) A310. error is 9.6% for the PBT and 9% for the A310. The mixture Njs can be predicted accurately with the power model up to 27 wt% solids for a range of off-bottom clearances, with two separate impellers, in the absence of particle–particle interactions. Fig. 6a and b shows the momentum model results for exper- imental Njs. The momentum model captures the physics, but over-predicts the mixture Njs, leaving more data points outside the ±20% range. The standard error of the momentum model prediction is 17.3% for the PBT and 15.7% with the A310. In Fig. 7 comparison of the power and momentum models with both the PBT and the A310 shows that the momentum model consistently over-predicts mixture Njs. The standard devia- tion between the two models is 6.4% when the data for both impellers is combined. We conclude that the power model provides a better prediction of mixture Njs. The performance of the power model has been analyzed in terms of parity plots up to this point. This allows the compari- son of model accuracy for different data sets, but prevents the visibility of some details, such as the effect of solids loading. A closer look at the raw data is required to observe these details. Fig. 8 compares the power model predictions to experimental data and the current design heuristic for two representative cases at C/T = 0.25. As the solids loadings increase the mixture Njs increases. At low solids loadings the power model predic- tions fall on top of the experimental data for both mixtures. As the solids loadings are increased the mixture Njs increases both with the power model predictions and the experimen- tal data, and the power model starts to give moderately
- 7. chemical engineering research and design 9 1 ( 2 0 1 3 ) 227–233 233 0 200 400 600 800 1000 1200 1400 1600 1800 2000 0 200 400 600 800 1000 1200 1400 1600 1800 2000 Njs-MomentumModel(rpm) Njs - Power Model (rpm) PBT A310 Standard deviation: 6.4% PBT and A310 Momentum vs Power model Fig. 7 – Comparison of the momentum model and the power model at varying clearances for all particles with the PBT and A310. 400 600 800 1000 1200 1400 1600 0 5 10 15 20 25 30 Njs,mix(rpm) Xw LG+B Experimental LG+B Power Model LG+B Heuristic R+LG Experimental R+LG Power Model R+LG Heuristic PBT - Power Model and Heuristic Fig. 8 – Comparison of mixture Njs obtained from experiments, power model, and current design heuristic for LG + B and R + LG mixtures with PBT at C/T = 0.25. over-predicted Njs,mix. This figure shows that the power model tends to over-predict mixture Njs, but provides a significant improvement over the current design heuristic, shown as the dashed lines. If the heuristic was used for design, a signifi- cant number of particles would not be suspended. The power model, in all cases, provides conservative design but never beyond 20% error. Reviewing the data, the current design heuristic is rejected because the trends are not captured. The momentum model clearly over-predicts Njs,mix, based on Fig. 7. The power model is recommended with use of experimental unimodal data where possible. 5. Conclusions The objective of this study was to propose and test two mod- els to accurately predict mixed slurry Njs. Analysis of the experimental data for several mixtures at varying off-bottom clearances and solids loadings for two impeller geometries led to the following conclusions: • The current design heuristic is inadequate for the prediction of mixture Njs since it ignores the addition of a second solid phase, and cannot predict the basic trend. • The momentum model consistently over-predicts Njs and is rejected. • When the Zwietering correlation is used for unimodal slurry Njs the power and momentum models lose strength and show similar behavior to the current design heuristic. The authors recommend use of experimental unimodal slurry Njs if possible. • The power model, as given below, predicts mixture Njs accu- rately for both the PBT and the A310 impellers up to 27 wt% solids over a range of off-bottom clearances when unimodal slurry Njs’s are obtained from experiments. Njs,mix = sl,1N3 js,1 + sl,2N3 js,2 sl,mix 1/3 Acknowledgments The authors would like to thank Lightnin and NSERC for fund- ing, Sherritt Metals Inc. for providing nickel particles, and Maria Garcia from Rowan University for sharing data for sand and urea formaldehyde. References Armenante, P.M., Nagamine, E.U., 1998. Effect of low off-bottom impeller clearance on the minimum agitation speed for complete suspension of solids in stirred tanks. Chem. Eng. Sci. 53, 1757–1775. Ayranci, I., Kresta, S.M., 2011. Design rules for suspending concentrated mixtures of solids in stirred tanks. Chem. Eng. Res. Des. 89 (10), 1961–1971. Baldi, G., Conti, R., Alaria, E., 1978. Complete suspension of particles in mechanically agitated vessels. Chem. Eng. Sci. 33, 21–25. Ibrahim, S., Nienow, A.W., 1996. Particle suspension in the turbulent regime: the effect of impeller type and impeller/vessel configuration. Trans. IChemE 74 (Part A), 679–688. Jafari, R., Tanguy, P.A., Chaouki, J., 2012. Experimental investigation on solid dispersion, power consumption and scale-up in moderate to dense solid–liquid suspensions. Chem. Eng. Res. Des. 90, 201–212. Kasat, G.R., Pandit, A.B., 2005. Review on mixing characteristics in solid–liquid and solid–liquid–gas reactor vessels. Can. J. Chem. Eng. 83, 618–643. Machado, M.B., Nunhez, J.R., Nobes, D., Kresta, S.M., 2011. Impeller characterization and selection: balancing efficient hydrodynamics with process mixing requirements. AIChE J. 58 (8), 2573–2588. Micheletti, M., Nikiforaki, L., Lee, K.C., Yianneskis, M., 2003. Particle concentration and mixing characteristics of moderate-to-dense solid–liquid suspensions. Ind. Eng. Chem. Res. 42, 6236–6249. Montante, G., Magelli, F., 2007. Mixed solid distribution in stirred vessels: experiments and computational fluid dynamics simulations. Ind. Eng. Chem. Res. 46, 2885–2891. Myers, K.J., Fasano, J.B., 1992. The influence of baffle off-bottom clearance on the solids suspension of pitched-blade and high-efficiency impellers. Can. J. Chem. Eng. 70, 596–599. Nienow, A.W., 1968. Suspension of solid particles in turbine agitated baffled vessels. Chem. Eng. Sci. 23, 1453–1459. Zwietering, Th.N., 1958. Suspending of solid particles in liquid by agitators. Chem. Eng. Sci. 8, 244–253.