Interpersonal meanings in Internet news infographic on ivory poaching

Abstract Information graphics, or infographics, have long been regarded as a data visualisation format to turn mass data into systematic, comprehensible information. The infographic content in printed and online news media has provided substantial news value to enhance the credibility of news agency (Meyer, 2004) as they provide objectivity, accuracy and aesthetic values. The voices of infographic designers are thus often hidden behind the vividly presented information. While it is admitted that understanding infographics is a discourse-level problem (Carberry et al, 2003), little has been to explore the discourse functions the elements serve in the infographics, apart from more empirical explorations on content and automatic recognition (Carberry et al, 2003; Huang and Tan, 2007; Keefer, 2011; Meyer, 2004). In view of this, adopting the visual and verbal APPRAISAL theories (Economou, 2006; Macken-Horarik, 2004; Martin, 2001; Martin and White, 2005), this paper investigates the interpersonal meanings construed in the visual and verbal elements of one infographic content from an online local newspaper about hunting endangered species. This paper aims to reveal the potential voices and evaluation of the infographic designers, and identify the discourse functions served in the elements for future empirical studies and other practical implications.

Recommended
Recommended
More Related Content
Similar to Interpersonal meanings in Internet news infographic on ivory poaching
Similar to Interpersonal meanings in Internet news infographic on ivory poaching (20)
More from Lok Ming Eric Cheung
More from Lok Ming Eric Cheung (7)
Recently uploaded
Recently uploaded (20)
Interpersonal meanings in Internet news infographic on ivory poaching
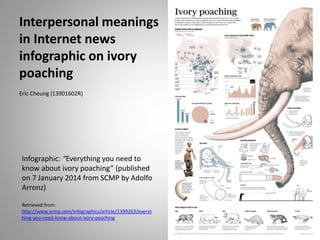
- 1. Interpersonal meanings in Internet news infographic on ivory poaching Eric Cheung (13901602R) Infographic: “Everything you need to know about ivory poaching” (published on 7 January 2014 from SCMP by Adolfo Arronz) Retrieved from: http://www.scmp.com/infographics/article/1399263/everyt hing-you-need-know-about-ivory-poaching
- 2. Infographics: significance • Portmanteau of information and graphics • “An informational contribution… done with iconic and typographical elements” (Sancho, as cited in Giardina and Medina, 2012, p.246) • “Infographics are getting widespread in the Internet media” (Dur, 2014, p.137) • Evolving infographics to allow interactivity – adding values to journalistic media
- 3. Major research on infographics • Quantitative – Content analysis (Giardina and Medina, 2012) – Distribution of infographic types (Ghode, 2012; Jacobson, 2012) • Experimental and cognitive – Navigation path (Holsanova, 2005) – Automatic recognition (Huang and Tan, 2007)
- 4. Research Gap • Understanding infographics is a “discourse- level problem” (Carberry et al., 2003) • Necessitate investigation of how visual-verbal text complexes are socially constructed – With the use of a variety of semiotic resources – Visual: image, diagram, vectors, colour, fonts – Verbal: textual structure, texture, word choice • Social semiotics of infographics in the new media
- 5. Systemic-functional Multimodal Discourse Analysis (SF-MDA) • SF-MDA: the promising potential of analysing the dynamics of the semiotic resources in the infographics construing meaning • Theorising how different semiotic resources interact to construe meaning with the principles of metafunctions – ideational/representational (construing reality) – interpersonal (enacting social relations) – textual/organisational (organising discourse)
- 6. Research questions and approaches • How is the information structured to maintain a consistent meaning throughout the text? – Information value, salience and framing(Kress and van Leeuwen, 2006) • How are the interpersonal meanings construed in the visual-verbal text? – Verbal APPRAISAL (Martin and White, 2005) – Visual APPRAISAL (Bednerak and Caple, 2012; Economou, 2009; Swain, 2012) • Close discourse analysis – Annotating the infographic data – Interpreting the statistical findings
- 7. Interpersonal meanings explicated • APPRAISAL (Martin and White) – ATTITUDE (explicit emotion and valuation) • Affect (expressing emotions – e.g. happy, secure) • Judgement (valuating people – e.g. honest, capable) • Appreciation (valuation things – e.g. quality, composition) – ENGAGEMENT (single or multiple, alternative voices) • Contract (highlighting authorial presence – e.g. deny) • Expand (suggesting possibilities and alternatives) – GRADUATION (degree of intensity/quantity) • Focus • Force
- 8. Economou’s (2009) visual graduation • Force – Quantification • Number • Mass • Extent (proximity, distribution) – Intensification • Brightness • Vividness – Repetition (of similar, countable items) • Focus – Specification • Clarity • Substantiation • Completion • Graduation values – High – Median – Low
- 9. Evaluative key (or voice) • Evaluation distribution with a particular type of text (or register) – The evaluation within a single text is stance – Voice in journalistic discourse (White, 1998, 2006) • Reporter voice (personal judgement absent; judgement attributed) • Correspondent voice (judgement confined to “esteem”) • Commentator voice (use of judgement values liberally) – Voice in political cartoon (Swain, 2012) • Observer, jester, indictor voices
- 10. Genre and macrogenres • “Genre” is the abstract level of how a text is organised to reach social goals in stages (Martin, 1984) – Engage (storytelling); inform (report); evaluate (critique) • “Macrogenres”: Texts are often comprised of multiple “microgenres” (Martin and Rose, 2007, p.218) – Achieving multiple social purposes – Elements composited according to information values (Kress and van Leeuwen, 2006, p.177)
- 11. Composition of visual texts • Relates the representational and interactive meanings of the image to each other through (Kress and van Leeuwen, 2006, p.177): – Information value (zone of the image placed) – Salience (point of attraction in the image text) – Framing (connection of elements in the image)
- 12. Data of the present study • Global genre: news story Purpose: to narrate (lead story 1st) • Prominent placement of Information value Ideal-Real: overarching info at the top; practical info at the bottom Centre-margin: elements arranged around the elephant head and the tusk Major micro-genres Historical recount (figures, tables) Sequential explanations (“Tusk extraction) Compositional report (“Up close”) Descriptive report (ivory as luxury goods)
- 13. Potential navigation path •The direction of the tusk is a vector suggesting the reading path •From the root of the tusk to the tip •Justified by the textual cohesion •25% of the tusk is inside… •… as it contains 25% of the tusk •Elements of lower salience at the marginal areas may attract less attention •The elephant’s forehead and the two types of elephants beside the forehead •The tusks are the centre of focus •Each element (unit) has a more miniscule, subtle reading path (left to right, top to bottom)
- 14. Visual-verbal APPRAISAL Sub-types +ve (verbal) -ve (verbal) +ve (visual) -ve (visual) Capability 1 0 0 0 Normality 0 3 0 5 Propriety 4 9 0 3 5 12 0 8 Sub-types +ve (verbal) -ve (verbal) +ve (visual) -ve (visual) Impact 0 1 0 0 Quality 1 0 2 0 Valuation 2 1 0 0 3 2 2 0 Judgement Appreciation
- 15. Verbal APPRAISAL • Attitude – Ivory has played an important role [+appreciation] – Poachers [-judgement] need to cut off a big portion of the elephant's head [-judgement] • Engagement – But [contract: disclaim: counter] to no [contract: disclaim: deny] avail • Graduation – reverse a rapid [graduation: force] decline in the population of African elephants
- 16. Visual-verbal APPRAISAL Graduation Sub-types Verbal Visual Force 7 13 Focus 1 11 8 24 Sub-types Verbal Visual Counter 4 0 Deny 1 0 Pronounce 1 0 6 0 Engagement: contraction
- 17. Visual APPRAISAL High salience (graduation: quantification: mass) Mid salience (graduation: specification: vividness) Low salience (graduation: specification: low clarity/vividness)
- 18. APPRAISAL synergy creating overall stance • Attitudinal evaluation is mainly in verbal text – “Lead” of the verbal texts and attitudinal meaning – the major body text (larger font, next to headline, attitude-dense) • Visual elements provide graduation to up- scale the poachers’ cruelty and immorality – “Lead” of the visual texts – the elephant head with the tusks (centre, high salience)
- 19. Summary of the study • Objective images (Kress and van Leeuwen, 2006) are embedded with author’s values • Spreading of interpersonal meanings – From the main text (at the Ideal position) – From the salient illustration of elephant head (at the centre position) – Determining the overall stance of other elements • The overall voice of the infographic is “commentator” voice (White, 1998) – Numerous judgement of social esteems and sanctions
- 20. Implications and future studies • Visual and information literacy – Clarity, consistency, precision and aesthetics (Duenes, 2008; Sancho, 2001) – Criticality (understanding of ethical and moral social values) and ability to express it verbally and visually • Future studies – Generalising the micro-genres in infographics for empirical analyses – Schematic structure of infographics – Comparing visual-verbal interpersonal meaning patterning in infographics within the same field
Editor's Notes
- #3 if the data visualisation is objective it would be entirely statistical – illustrations reflect the designer’s choice of aesthetics, in addition to the social values embedded within.
- The visual images of the infographic would less likely be attitudinal since this kind of illustration is different from political cartoons, in which evaluative judgement from the illustrators is more salient. However, we can use Economou’s visual graduation to examine how these visual elements play a role in supporting attitudinal meanings in the verbal texts.
- Political cartoons (Swain, 2012) are heavily laden with evaluation/judgement
- The lead paragraph serves as the nucleus of the story, expanding the headline (Martin and Rose, p.76) The content elements are then oscillated and expanded by the nucleus (including the voice + overall attitude) Newspapers in the modern times tend to attract readership through a sensational lead, and they develop multiple points of view of a event as the news story unfolds (Martin and Rose, p.75) Figures of poaching, elephant population Anatomy of elephant head and its tusks Ways poachers hunt and kill elephants for their tusks Ivory as a luxurious goods Elaborating poaching to the illegal trade of other endangered species
- Readers can skip and not follow the suggested path, but this creates a sense of guilt for readers, as if they were having a sneak peek at the ending without finishing a story (Kress and van Leeuwen, 2006). There are more subtle reading paths within a unit (e.g. in the last unit, the elements should be read from left - gazing over the subheading, the image and the description - to the right and repeat the same process until the end of the unit)
- (whistle-blowing, ethical issues, human/animal rights, etc.)