Call Girls Electronic City Just Call 7001305949 Top Class Call Girl Service A...
Dietary Exposures To Food Contaminants
1. Environmental Research Section A 84, 170}185 (2000)
doi:10.1006/enrs.2000.4027, available online at http://www.idealibrary.com on
Dietary Exposures to Food Contaminants across the United States1
Charlotte P. Dougherty,* Sarah Henricks Holtz,* Joseph C. Reinert,- Lily Panyacosit,?
Daniel A. Axelrad,- and Tracey J. Woodruff-
*Industrial Economics, Inc., 2067 Massachusetts Avenue, Cambridge, Massachusetts 02140; -U.S. Environmental Protection Agency,
Of=ce of Policy, Economics and Innovation, Washington, DC 20460; and ?School of Public Health, University of California, Berkeley,
California 94720
Received March 16, 1999
INTRODUCTION
Food consumption is an important route of
human exposure to pesticides and industrial
Food consumption represents an important path-
pollutants. Average dietary exposures to 37 pollu-
way for exposure to contaminants from a variety of
tants were calculated for the whole United States
sources, including pesticide application and con-
population and for children under age 12 years
tamination of water from industrial sources. Recent
by combining contaminant data with food con-
studies have indicated that exposures to contami-
sumption data and summing across food types.
nants in food may pose a public health risk (National
Pollutant exposures were compared to benchmark
Research Council, 1993; MacIntosh et al., 1996). For
concentrations, which are based on standard tox-
icological references, for cancer and noncancer example, MacIntosh et al. (1996) found that some
health effects. Average food ingestion exposures for portion of the adult population may be exposed to
the whole population exceeded benchmark concen- individual contaminants in food at concentrations
trations for arsenic, chlordane, DDT, dieldrin, above thresholds of concern. Reports from the Na-
dioxins, and polychlorinated biphenyls, when
tional Research Council of the National Academy of
nondetects were assumed to be equal to zero. For
Sciences (NRC) and the Environmental Working
each of these pollutants, exposure through Ash
Group have also found that pesticide exposures to
consumption accounts for a large percentage of
children could be high enough to cause immediate
food exposures. Exposure data for childhood age
adverse health outcomes (National Research Coun-
groups indicated that benchmark concentrations
cil, 1993; Wiles et al., 1998).
for the six identiAed pollutants are exceeded by
These reports have focused either on a small group
the time age 12 years is reached. The methods
used in this analysis could underestimate risks of contaminants and speci7c types of foods, such as
from childhood exposure, as children have a longer pesticides in fruits and vegetables (National Re-
time to develop tumors and they may be more search Council, 1993; Wiles et al., 1998), or on a sub-
susceptible to carcinogens; therefore, there may set of the United States population, such as adults
be several additional contaminants of concern. In
(MacIntosh et al., 1996) or children (National Re-
addition, several additional pollutants exceeded
search Council, 1993; Wiles et al., 1998). A more
benchmark levels when nondetects were assumed
comprehensive assessment of food contaminant ex-
to be equal to one half the detection limit. Uncer-
posures, which would include both pesticides and
tainties in exposure levels may be large, pri-
industrial contaminants, as well as both children
marily because of numerous samples with
and adults, will help identify which populations are
contaminant levels below detection limits. 2000
most at risk from contaminant exposure in foods and
Academic Press
Key Words: consumption; contaminant; cumula- which contaminants have the greatest public health
tive; data base; exposure; food. signi7cance.
To better assess the national distribution of expo-
sures to a broad array of contaminants in food, data
were collected on 37 contaminants in foods and
combined with estimates of consumption from die-
1
The views expressed in this paper are those of the authors and
tary pro7les for demographic groups across the
do not necessarily re8ect those of the USEPA.
170
0013-9351/00 $35.00
Copyright 2000 by Academic Press
All rights of reproduction in any form reserved.
2. 171
DIETARY EXPOSURES TO FOOD CONTAMINANTS
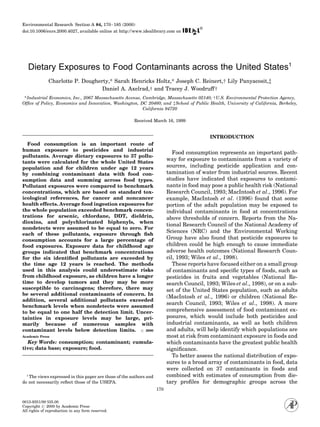
FIG. 1. Overview of analytical methods for food contamination exposures.
United States. The analysis considers exposures to individual food types, (4) estimating total dietary ex-
individual contaminants from multiple foods and posures by summing across all food types, and (5)
multiple contaminants in combination. This in- comparing exposures to benchmark concentrations to
formation provides a screening-level assessment for determine potential public health impacts. Figure 1
identifying contaminants of highest concern. This provides an overview of each of these steps.
article presents an overview of the analysis of expo- Foods selected for the analysis were those that
sures from ingestion of food contaminants, including comprised at least 1% of the average diet either for
a description of the contaminants, foods, and popula- the entire United States population or for certain
tion subgroups analyzed, the sources of data used, age groups based on the 1977}1978 Nationwide Food
the analytical approach taken, and estimates of Consumption Survey, posed the greatest cancer risk
average food ingestion exposures for the whole popu- from contaminants according to the National Re-
lation and for children under age 12 years. search Council’s ‘‘Regulating Pesticides in Food;
The Delaney Paradox’’ (National Research Council,
1987), or were evaluated by the U.S. Department of
METHODS
Agriculture (USDA)2 in its Pesticide Data Program
This analysis estimates dietary exposures to cer-
tain pesticides and industrial chemicals through se- 2
Abbreviations used: CSFII, Continuing Survey of Food In-
lected foods considered representative of the diet of takes by Individuals; DDT, dichlorodiphenyltrichloroethane;
the American population. The analysis included (1) FDA, United States Food and Drug Administration; MARCIS,
creating a food consumption database that provides Microbiology and Residue Computer Information System; NFPA,
information on consumption patterns by demo- National Food Processors Association; NSI, National Sediment
Inventory; PCB, polychlorinated biphenyls; PDP, Pesticide Data
graphic characteristics, (2) creating a food con-
Program; RfD, Reference Dose; TAS, Technical Assessment Sys-
taminant database by obtaining and compiling tems, Inc.; TDS, Total Diet Study; USDA, United States Depart-
contaminant data, (3) combining contaminant and ment of Agriculture; USEPA, United States Environmental
consumption information to estimate exposures from Protection Agency.
3. 172 DOUGHERTY ET AL.
(PDP) (U.S. Department of Agriculture, 1994). Due considered to be most important for the analysis of
to a lack of contaminant data, sugar beets, cane contaminant exposure through food ingestion and
sugar, coconut oil, soybean oil, and soybeans have available data. Note that some of the con-
were dropped from the analysis, even though they taminants have been completely banned from use in
met the 7rst criterion listed above. The foods se- the United States but, because of their persistence,
lected for the analysis are listed in Table 1. continue to have measurable residues in the food
The analysis estimates the dietary intake of 37 con- supply. Selection of these contaminants was based
taminants, including 30 pesticides and 7 industrial upon the following factors and primary sources: (1)
chemicals. These chemicals, listed in Table 2, are toxicity of the contaminant, based on toxicity
TABLE 1
Data Sources Used for the Food Contamination Database
Food Pesticides Industrial chemicals Dioxin
Fruits, vegetables and grains
Apples, processed TDS TDS
Apples, raw PDP/TDS TDS
Bananas PDP/TDS TDS
Broccoli PDP TDS
Cabbage TDS TDS
Carrots, processed PDP/TDS TDS
Carrots, raw PDP/TDS TDS
Celery, processed PDP/TDS TDS
Celery, raw PDP/TDS TDS
Corn NFPA/TDS TDS
Grapefruit PDP/TDS TDS
Grapes PDP/TDS TDS
Green beans PDP/TDS TDS
Lettuce PDP/TDS TDS
Oats TDS/NFPA TDS
Orange juice TDS/NFPA TDS
Oranges PDP/NFPA TDS
Peaches PDP/TDS TDS
Pears TDS/NFPA TDS
Peas, green TDS/NFPA TDS
Potatoes, white PDP/TDS TDS
Rice TDS TDS
Spinach TDS TDS
Tomatoes, processed NFPA/TDS TDS
Tomatoes, raw TDS TDS
Wheat 8our TDS/NFPA TDS
Meat and Poultry
Beef MARCIS/TDS TDS USEPA/USDA
Chicken MARCIS/TDS TDS USEPA
Pork MARCIS/TDS TDS USEPA
Fish
Fish, freshwater NSI NSI NSI
Fish, saltwater NSI NSI NSI
Shell7sh NSI NSI NSI
Dairy and Egg Products
Milk TDS TDS USEPA
Eggs TDS TDS USEPA
Note. For pesticides, the sample data were derived primarily from the 7rst database listed. Data were taken from the second database for
those pesticides not included in the 7rst. Sources are as follows: TDS, Total Diet Study, 1988}1993; PDP, Pesticide Data Program,
1992}1993; MARCIS, Microbiology and Residue Computer Information System, 1990}1995; NSI, National Sediment Inventory,
1988}1993; NFPA, National Food Processors Association, 1987}1992; USEPA/USDA, USEPA/USDA joint study on dioxins in beef,
1989}1991; USEPA, USEPA Dioxin Report, 1989}1991.
4. 173
DIETARY EXPOSURES TO FOOD CONTAMINANTS
(Technical Assessment Systems, 1995). From 1989
TABLE 2
to 1991, the CSFII collected food consumption data
Contaminants Included in the Food Analysis
annually from 12,000 individuals considered repre-
Pesticides Industrial chemicals
sentative of the United States population over a
nonconsecutive 3-day sampling period. Survey par-
2,4-D Dieldrin Arsenic
ticipants recorded the weight of each food eaten at
Acephate Endosulfans Cadmium
each meal during the sampling period. Consumption
Heptachlor b
Alachlor Dioxins
Atrazine Hexachlorobenzene Manganese was reported in a standardized manner using body
Azinphos-methyl Imazalil Mercury
weights (grams of food ingested per kilogram of body
Captan Iprodione PCBs
weight). Average daily consumption values were
Carbaryl Lindane Selenium
available for consumers only (individuals that con-
Chlordane Malathion
sumed the food at least once during the sampling
Chlorothalonil Methamidophos
Chloropropham Methoxychlor period) and for all individuals.
Chlorpyrifos O-Phenylphenol
Food consumption data were summarized for nine
Cyanazine Permethrin
populations, strati7ed by age and gender: children
DDT a Simazine
less than 1 year of age, children 1 to 5 years of age,
Diazinon Thiabendazole
males and females 6 to 11 years of age, males and
Diphenylamine Toxaphene
females 12 to 19 years of age, males and females 20
Note. Contaminants in italics have been banned for all uses.
to 64 years of age, and adults greater than 64 years
a
Exposures to DDT assessed in this study represent the sum of
of age. Food consumption values were calculated for
the isomers o,p-DDT, p,p-DDT, o,p-DDE, p,p-DDE, o,p-DDD
each of the nine population subgroups and for each
and p,p-DDD.
of the 34 food types included in the analysis, as long
b
Heptachlor is almost completely banned and may be used only
to control 7re ants inside buried, pad-mounted electrical trans- as there were more than three individuals in the
formers and in underground cable television and telephone cable
subpopulation who consumed the food. Means and
boxes.
Standard deviation for each subpopulation were cal-
culated by averaging 3-day individual averages to
information in USEPA’s Integrated Risk Informa- represent population averages and variability. This
tion System (IRIS) and information on chemical car- analysis calculated average food ingestion exposures
cinogenicity from USEPA’s Of7ce of Prevention, using average daily consumption for all individuals
Pesticides and Toxic Substances and a National Re- and for children less than 12 years of age.
search Council study (National Research Council, CSFII data include consumed quantities of pre-
1987); (2) frequency of detection in foods as deter- pared foods such as pizza and spaghetti sauce, which
mined by the Food and Drug Administration’s (FDA) were converted into quantities of raw agricultural
Total Diet Study (U.S. Food and Drug Administra- commodities. Standardized recipes were used to cal-
tion, 1994), USDA’s National Residue Program, and culate the quantity of the raw agricultural commod-
USEPA’s National Sediment Inventory (U.S. Envir- ity in each prepared food (Technical Assessment
onmental Protection Agency, 1992); (3) prevalence in Systems, 1995). Total consumption of each raw com-
the environment, based on information on the modity was estimated by summing the amount in all
quantity of chemicals applied to crops annually from foods.
a National Research Council study (National Re-
search Council, 1987); and (4) availability of con-
Food Contamination Database
taminant data.
Other sources, including the National Human Ex- Residue data for the selected contaminants were
posure Survey (NHEXAS) (Technical Assessment obtained from various food contaminant data sour-
Systems, 1994) and USDA’s Pesticide Data Program ces, including the USDA Pesticide Data Program,
(U.S. Department of Agriculture, 1995a), were also National Food Processors Association (NFPA)
used in evaluating contaminants for inclusion in the (Chemical Information Services, 1995), U.S. Food
analysis. and Drug Administration Total Diet Study (TDS),
Microbiology and Residue Computer Information
System (MARCIS) (U.S. Department of Agriculture,
Food Consumption Database
1995b), USEPA Dioxin Report (U.S. Environmental
Food consumption levels for the foods included in Protection Agency, 1994), USEPA/USDA Dioxin in
the analysis were compiled from USDA’s Continuing Beef Study (Winters et al., 1994), and the National
Survey of Food Intakes by Individuals (CSFII) Sediment Inventory (NSI). Of the seven food
5. 174 DOUGHERTY ET AL.
contaminant data sources used, the NSI, MARCIS, pesticides, radionuclides, and industrial chemicals
and USEPA Dioxin Reports used raw samples, where- in 261 foods that represent 3500 typically consumed
as the others used prepared and/or cooked samples. foods. Sampling procedures consist of purchasing
Years selected for each data source were based on the 261 foods in three cities in each of four regions of
availability as well as sample size (i.e., more years of the country. The samples from the three cities with-
data were used in databases in which the number of in each region are combined into one ‘‘market bask-
samples per year is small), but were generally repre- et.’’ Samples are collected four times per year. The
sentative of the early 1990s. As shown in Table 1, foods sampled include processed foods (bottled, can-
residue data for most vegetables were taken from ned, and frozen), fresh foods including fruits and
the PDP database. If PDP data were not available vegetables, baby foods, dairy products, fresh meats,
for a particular food type, the NFPA data were used. cereals, peanut butter, and prepared foods such as
If NFPA data also were not available, TDS data were pizza. The three samples of like foods are combined
used. The MARCIS database supplied most of the into one sample, prepared as for consumption, and
residue data for beef, chicken, and pork, while the analyzed for contaminants. Data from the TDS
USEPA/USDA Dioxin in Beef Study and the USEPA database, which includes 28 of the 37 contaminants
Dioxin Report provided supplemental dioxin data on used in this analysis, were from 1988 to 1993. An
beef, pork, chicken, milk, and eggs. TDS data were important limitation of the study is its small sample
used for industrial chemicals in all food types except sizes.
7sh. Residue data for 7sh were obtained from the
The Microbiology and Residue Computer Informa-
National Sediment Inventory database.
tion System. MARCIS is a USDA-sponsored monit-
oring program, the purpose of which is to ensure
USDA Pesticide Data Program. The USDA Pes-
that USDA-inspected products are safe for human
ticide Data Program started in 1991 as a monitoring
consumption. MARCIS contains data from tests on
program to collect residue data on selected fruits and
meat, poultry, and egg products for any of 100 com-
vegetables. Fresh fruits and vegetables evaluated by
pounds in eight classes of animal drugs and pestici-
PDP are collected as close to the consumer as pos-
des, including nine contaminants in this study:
sible and prepared as for consumption, i.e., washed
chlordane, chlorpyrifos, DDT, dieldrin, heptachlor,
and peeled. The commodities are selected to accu-
hexachlorobenzene, lindane, methoxychlor, and
rately represent national distribution levels and pes-
PCBs. Contaminant testing occurs in raw fat sam-
ticide use for a speci7c crop by growing region and
ples. Thus, the residue data do not re8ect con-
season. Of the 37 selected industrial chemicals and
taminant levels in cooked or processed foods, as
pesticides, the PDP database contains information
cooking is likely to decrease the percentage of fat and
on 23.
thus decrease concentrations of lipophilic con-
PDP data from 1992 and 1993 were used in this
taminants. Processing and cooking of foods may also
analysis. In 1992, the USDA collected PDP samples
break down contaminants and reduce concentra-
from six states representing 40% of the United
tions. Data from the years 1990 to 1995 were used in
States population, and in 1993, the USDA collected
this analysis.
samples from nine states representing 50% of the
population. USEPA Dioxin Report and USEPA/USDA Dioxin
in Beef Study. The USEPA Dioxin Report presents
The National Food Processors Association. The
average dioxin levels in United States meat and
NFPA monitors the illegal or unnecessary presence
dairy products, including pork, chicken, milk, and
of pesticide residues in processed food. The NFPA
eggs, based on data from the years 1989 to 1991. In
database consists of residue data, from both random
addition, the 1994 USEPA/USDA Dioxin in Beef
and targeted sampling, of raw foods purchased spe-
Study analyzed the concentration of dioxins in the
ci7cally for processing and processed foods, such as
back fat of United States beef animals using a stat-
canned and frozen foods. The database contains resi-
istically based sampling survey that accounted for
due data on 28 of the 37 contaminants. The database
99.9% of all beef animals slaughtered in the United
has small sample sizes and less sensitive detection
States. Data for all foods are presented as dioxin
techniques than PDP, resulting in higher detection
toxic equivalents, which were calculated using the
limits. Data were obtained from the years
international toxic equivalency factors for chlorin-
1987}1992.
ated dibenzo-p-dioxin (CDDs) and chlorinated diben-
FDA Total Diet Study. The FDA’s Total Diet zofurans (CDFs). Tests were performed on raw
Study collects residue data for approximately 300 foods, resulting in possible overestimation of total
6. 175
DIETARY EXPOSURES TO FOOD CONTAMINANTS
dioxin exposure. An additional limitation of the detect samples were equal to zero. These two as-
USEPA Dioxin Report is the small sample sizes that sumptions provide a range of exposure estimates for
were used to develop average contaminant levels. each contaminant with nondetects. Separate expo-
sure analyses were conducted for children (less than
National Sediment Inventory. The National
12 years old) and for the whole population.
Sediment Inventory was implemented in the early
1980s to monitor 96 compounds, including PCBs,
endosulfans, dioxins, and DDT in 7sh and shell7sh. Comparison to Benchmark Concentrations
The National Sediment Inventory compiled informa-
To screen for the potential public health signi7-
tion on 7sh tissue contaminants from several data
cance of estimated exposures, exposure values were
sources, including STORET (Storage and Retrieval
compared to benchmark concentrations for each con-
for Water Quality Data), EMAP (Environmental
taminant. A benchmark concentration represents
Monitoring and Assessment Program), ODES
a daily concentration below which there is a high
(Ocean Data Evaluation System), and DMTS
probability of no adverse health effect. This is differ-
(Dredged Material Tracking System). Sampling data
ent than a benchmark dose, which is a statistically
were collected on a national and a regional scale, in
derived value used in setting a Reference Dose for
both freshwater and saltwater bodies. Some NSI
noncancer health effects. The benchmark concentra-
sampling procedures, such as targeted sampling in
tions for carcinogenic effects were derived using
areas thought to have high contamination levels and
USEPA cancer slope factors and represent exposure
sampling in raw 7sh 7llets, may overestimate con-
concentrations at which lifetime cancer risk is one in
taminant concentrations and therefore exposure
one million. This level is de7ned as a public health
levels. Data used were for the years 1988 to 1993.
protective concentration in the Congressional House
Report to the Food Quality Protection Act of 1996
(104th Congress, 1996). In addition, the one in a
Estimating Exposure
million cancer risk has been used in other regulatory
The analysis estimates exposure to speci7c con- programs, such as those for air toxics, as a de mini-
taminants via individual foods by combining data on mus concentration and thus an appropriate level for
contaminant concentrations in foods with data on screening (1990, Clean Air Act Amendments; Cal-
consumption of those foods. For each contaminant dwell et al., 1998). The benchmark concentrations
and food evaluated, the following equation was used for noncarcinogenic effects are USEPA Reference
to calculate average exposure levels for a particular Doses. The Reference Dose is an estimate, with an
population subgroup: uncertainty spanning perhaps an order of magni-
tude, of a daily exposure to the human population
Average Daily Exposure ( g/kg body weight;day) (including sensitive subgroups) that is likely to be
without appreciable risk of deleterious effects during
quot;Consumption (g/kg body weight;day) a lifetime (U.S. Environmental Protection Agency,
1990).
;Contaminant Concentration ( g/g). Of the 37 contaminants studied, 20 have available
cancer benchmark concentrations, 34 have available
Having calculated exposures from each food, the noncancer benchmarks, and 17 have both cancer
estimates for each contaminant were summed across and noncancer benchmark concentration values
food types, providing estimates of each population (Table 3).
subgroup’s total average daily exposure to each con- Exposure levels were compared to benchmarks by
taminant through the food pathway. There were calculating hazard ratios. Hazard ratios are cal-
a number of nondetects in the contaminant data. To culated by dividing the average daily exposures by
account for the possibility that there were concentra- the benchmark concentrations. Hazard ratios
tions below the detection limit, we used two alterna- greater than one indicate that the average exposure
tive assumptions. We 7rst assumed that actual level exceeds the benchmark concentration.
concentrations for nondetect samples were equal to Calculation of cancer hazard ratios for children’s
half of the detection limit. However, this would exposures involved a step in which childhood expo-
overestimate the concentrations if there were truly sures were converted to equivalent whole-life expo-
no contamination of the sampled foods. Therefore, sures. A lifetime average daily dose (LADD) from
we also calculated exposures with the alternate childhood exposure was calculated by summing to-
gether the estimated intake levels over the 7rst 12
assumption that actual concentrations for all non-
7. 176 DOUGHERTY ET AL.
TABLE 3
National Average Exposures and Benchmark Concentrations for Contaminants Included in the Food
Ingestion Analysisa
Exposure per capita Exposure per capita Cancer benchmark
concentrationb
Number of samples nondetectsquot;0 nondetectsquot;0.5 DL Oral RfD
Chemical name (and detects) ( g/kg;day) ( g/kg;day) ( g/kg;day) ( g/kg;day)
;
2,4 D 3,965(88) 0.001 0.009 10
Acephate 6,366(961) 0.02 0.04 4 0.115
0.0125c
Alachlor 169(0) 0 0.02 10
Arsenice 1,421(136) 0.2 0.2 0.3 0.001
0.0045c
Atrazine 169(0) 0 0.02 35
?
1.5d
Azinphos-methyl 9,548(581) 0.02 0.1
;
Cadmium 1,577(751) 0.2 0.2 1
Captan 6,901(573) 0.03 0.06 130 0.29
Carbaryl 8,850(388) 0.02 0.06 100 0.044
Chlordane 26,598(1340) 0.01 0.07 0.06 0.001
;
Chlorpyrifos 35,591(510) 0.8 0.8 3
0.09c
Chlorothalonil 8,281(1079) 0.007 0.03 15
;
Chloropropham 3,864(744) 0.004 0.04 200
2c 0.001c
Cyanazine 76(0) 0 0.03
DDT g 26,098(1927) 0.04 0.1 0.5 0.003
;
0.9c
Diazinon 11,709(535) 0.003 0.02
Dieldrin 26,608(1155) 0.003 0.03 0.05 0.0000625
;
Dioxinsh 6.7e-09c
142(93) 1e-06 2e-06
;
Diphenylamine 2,962(347) 0.1 0.2 25
;
Endosulfansi 12,933(1130) 0.02 0.05 6
Heptachlor 18,377(84) 0.0001 0.03 0.5 0.00022
Hexachlorobenzene j 27,142(104) 0.0001 0.04 0.8 0.001
;
Imazalil 4,317(831) 0.009 0.05 13
;
Iprodione 10,592(1441) 0.09 0.1 40
Lindane j 0.00077c
27,614(83) 0.001 0.02 0.3
;
Malathion 5,986(92) 0.04 0.07 20
;
Manganesek 980(886) 20 20 140
;
Mercury l 0.3 c
6,057(5047) 0.04 0.08
;
Methamidophos 8,820(578) 0.01 0.02 0.05
;
Methoxychlor 2,9180(93) 0.005 0.07 5
; 0.515 c
O-phenylphenol 2,095(12) 0.0002 0.01
PCBsm 27,626(1523) 0.07 0.1 0.02 0.00013
Permethrin 6,591(1136) 0.03 0.07 50 0.056
;
Seleniumn 1,081(473) 1 1 5
0.008 c
Simazine 231(1) 0.0002 0.03 5
;
100 d
Thiabendazole 10,938(1749) 0.2 0.3
;
Toxaphene 4,009(13) 0.0004 0.2 0.001
Note. Contaminants in italics have been cancelled for all uses. Source: Oral RfDs and CSFs obtained primarily from USEPA’s
Integrated Risk Information System (4 Quarter, 1995) except where indicated otherwise.
a
Numbers in boldface represent whole-population average estimated exposures that exceed the benchmark concentrations for carcino-
genic effects or for both carcinogenic and noncarcinogenic effects.
b
Benchmark concentration for carcinogenic effects equals 106 divided by the cancer slope factor and represents the exposure
concentration at which lifetime cancer risk is one in one million.
c
Toxicity values obtained from USEPA’s Health Effects Assessment Summary Table, 1994.
d
Toxicity values obtained from USEPA’s Of7ce of Pesticide Programs RfD Tracking Report, 4/14/95.
e
Listed as Arsenic (inorganic).
f
Listed as Cadmium (food).
g
Listed as DDT (p,p-Dichlorodiphenyltricloroethane).
h
Listed as Tetrachlorodibenzo-p-dioxin, 2,3,7,8 (TCDD).
i
CAS 115-29-7.
j
Listed as Hexachlorocyclohexane, gamma.
k
Listed as Manganese (food).
l
Listed as Mercury (inorganic).
m
PCBs (CAS 1336-36-3) used for Slope Factor, Aroclor 1254 (CAS 11097-69-1) used for Reference Dose.
n
Listed as Selenium (and compounds).
8. 177
DIETARY EXPOSURES TO FOOD CONTAMINANTS
years of life and dividing the result by 70 years. This are assumed to be zero. These contaminants are
approach assumes zero exposure from ages 12 to 70 arsenic, chlordane, DDT, dieldrin, dioxins, and
to convert childhood exposures into lifetime terms PCBs. Figure 3 shows that, assuming nondetects are
for direct comparison with the cancer benchmarks equal to zero, the only contaminant that exceeds
that are also based on lifetime exposure. benchmark concentrations for noncarcinogenic
effects is PCBs.
Figures 2 and 3 and Table 3 also show that aver-
RESULTS
age exposure estimates are highly dependent upon
Analysis of National Average Contaminant
assumptions about the value of nondetects. When
Exposures
nondetects are assigned a value of one half of the
Table 3 presents national average daily food inges- detection limit, exposure values are 2 times as high
tion exposures to the 37 contaminants included in in most cases and in several cases 10 times as high
the analysis. These exposures are estimated on a as when they are assigned a value of zero. However,
per capita basis and therefore are derived from changing the nondetect value from zero to one half of
consumption values for all individuals surveyed, in- the detection limit does not signi7cantly change the
cluding those who did not consume particular foods exposure levels for eight of the contaminants;
during the survey period. For each contaminant, arsenic, cadmium, chlorpyrifos, iprodione, manga-
exposures are presented separately assuming that nese, PCBs, selenium, and thiabendazole.
nondetects in the food contamination database are The value assigned to nondetects also has an effect
equal to zero and one half of the detection limit. on the number of contaminants exceeding bench-
Values in bold face in Table 3 indicate exposures mark concentrations. When nondetects are assigned
that exceed either cancer or noncancer benchmark a value of zero, 6 of the 37 contaminants exceed
concentrations. benchmark concentrations. When nondetects are
Figures 2 and 3 present hazard ratios for carcino- assigned values of one half of the detection limit,
genic and noncarcinogenic effects, respectively, un- however, the number of contaminants exceeding
der two assumptions: (1) nondetects are equal to zero benchmark concentrations is 16. Five of the addi-
and (2) nondetects are equal to onehalf of the detec- tional 10 contaminants exceeding benchmark con-
tion limit. Figure 2 indicates that average exposures centrations have very small samples sizes and/or
to six contaminants exceed benchmark concentra- a small number of samples with detected contamina-
tions for their carcinogenic effects when nondetects tion. It is unlikely that average exposure levels to
FIG. 2. Cancer hazard ratios for average national exposure (per capita).
9. 178 DOUGHERTY ET AL.
FIG. 3. Noncancer hazard ratios for average national exposure (per capita).
these contaminants;alachlor, atrazine, cyanazine, Figure 4 presents the contributions of individual
simazine, and toxaphene;actually exceed bench- foods that contribute more than 5% to total exposure
mark concentrations, since less than 1% of the to the six contaminants, assuming that nondetects
samples for each of these contaminants are above are equal to zero. As illustrated in Fig. 4, exposure
levels from 7sh account for a large fraction of total
detection limits.
These results re8ect a large number of nondetect exposure for each of the six contaminants analyzed.
Exposures from saltwater 7sh contribute the largest
samples in the food contamination database. The
percentage of detects for different contaminants percentage to total exposure of all foods analyzed for
ranges from 0% for alachlor, atrazine, and cy- three contaminants (chlordane, 67%; dioxins, 64%;
PCBs, 60%). Exposures from freshwater 7sh con-
anazine to over 90% for manganese, though many
contaminants are detected in less than half the tribute the largest percentage for two contaminants
samples. (DDT, 75% dieldrin, 52%). Exposures from shell7sh
contribute the largest percentage for one con-
Contribution of Individual Foods to National taminant (arsenic 44%). No other food type com-
Exposure. Exposures to contaminants in indi- prises more than 5% of national exposures to any of
vidual foods were analyzed to identify those foods the six contaminants analyzed in detail, with the
with the largest contributions to average national exceptions of beef, which accounts for between 6 and
contaminant exposures. To avoid highlighting expo- 9% of total exposure to DDT, dieldrin, and dioxins,
sures that exceed benchmark concentrations solely and rice, which accounts for nearly 11% of total
exposure to arsenic. After 7sh, the largest contribu-
due to positive values assigned to nondetects, the
analysis of the contribution of individual foods tors to exposure are other meat and animal products,
focused on the scenario under which nondetects including beef, chicken, pork, and milk. The only
were assumed to equal zero. As indicated by Figs. 2 nonanimal products contributing more than 1% of
and 3, average national exposure under this scenario exposure to any of the six contaminants are rice,
potatoes, wheat 8our, and spinach. All other foods
exceeds benchmark concentrations for the following
six contaminants: arsenic, chlordane, DDT, dieldrin, analyzed in the study, including oats, eggs, and
dioxins, and PCBs. other fruits and vegetables, contribute negligible
10. 179
DIETARY EXPOSURES TO FOOD CONTAMINANTS
FIG. 4. Contribution of individual foods to total average national exposures.
amounts to national average contaminant exposures 12 years when nondetects are assigned a value of
for these chemicals. zero. The number of contaminants exceeding non-
cancer benchmarks increases when nondetects are
set equal to one half of the detection limit. Exposure
National Childhood Average Contaminant
to chlordane, for example, is greater than the non-
Exposures
cancer benchmark for all child age groups above
This analysis examines national childhood aver- 1 year. For children ages 1 to 5 years, exposures to
age food ingestion exposure for three age groups: all arsenic, chlordane, dieldrin, and methamidophos
children under 1 year of age, all children ages 1 to are greater than the noncancer benchmarks, and for
5 years, and all children ages 6 to 11 years. For children ages 6 to 11 years, arsenic is greater than
comparison to cancer benchmarks, exposures to chil- the noncancer benchmark.
dren less than 12 years old were converted into To further explore the impact of cumulative expo-
lifetime equivalent doses, as described under sures, noncancer hazard ratios for each age group
Methods. Assuming that nondetects are equal to were aggregated for all contaminants, since multiple
zero, childhood food ingestion exposures exceed the contaminants with exposure levels slightly below
one in one million cancer benchmark concentration the benchmark may be associated with potential
for the same six contaminants identi7ed above for health concerns when combined in aggregate. This
the whole population (DDT, chlordane, dioxins, ar- was done as a screening exercise to ascertain the
senic, dieldrin, and PCBs). Hazard ratios (exposure potential magnitude of cumulative exposures when
divided by benchmark concentration) for exposures considering multiple contaminants and accounting
to these contaminants in the 7rst 12 years of life for differences in potency and hazard of the various
range from 4 to 127 (see Fig. 5). When nondetects are contaminants. Figure 6 shows that children ages 1 to
assumed to equal half of the detection limit, a total of 5 years have the highest aggregate hazard ratios for
13 different food contaminants have childhood expo- noncarcinogenic effects. Children ages 6 to 11 years
sures that exceed the one in one million cancer risk have the second highest aggregate hazard ratios for
benchmark. noncarcinogenic effects, whereas children less than
Only one contaminant, PCBs, exceeds noncancer 1 year of age the lowest aggregate hazard ratios and
benchmarks for the childhood age groups less than therefore the lowest exposure levels compared with
11. 180 DOUGHERTY ET AL.
FIG. 5. Cancer hazard ratio for childhood exposures up to age 12 years.
benchmark values. These relationships are the same ard ratios for children overestimates risk because
whether the nondetects are set equal to zero or to the benchmarks assume that children would be ex-
one half of the detection limit. Setting nondetects posed at the estimated levels for a lifetime.
equal to one half the detection limits does, however,
more than double the estimate of children’s aggre-
Contribution of Individual Foods to Childhood
gate hazard from pesticide and industrial chemical
Exposure
exposures through food ingestion. Similar results
were found for aggregate cancer hazard ratios. How- Children consume more food per unit body weight
ever, as with individual contaminant comparisons to and thus more contaminants per unit body weight
cancer benchmarks, the aggregate noncancer haz- than adults. Children also consume different foods
FIG. 6. Aggregated noncancer hazard rations for childhood exposures up to age 12 years.
12. 181
DIETARY EXPOSURES TO FOOD CONTAMINANTS
and different amounts of foods than the general tions for cancer and noncancer effects, though these
population. Infants, for example, have high arsenic results should be interpreted cautiously due to lim-
exposure relative to other contaminants, due largely itations of the available data.
to a high consumption of rice and high arsenic con- This study provides insights on the magnitude of
centrations in rice. Infants, however, have much potential exposures from food contamination. The
lower exposures to other contaminants than all results of the analysis have identi7ed certain con-
other subgroups, because they do not consume fresh- taminants of particular concern, including arsenic,
water 7sh or shell7sh and only a small amount of chlordane, DDT, dieldrin, dioxins, and PCBs. The
saltwater 7sh per unit body weight. one in one million benchmark for lifetime cancer risk
The contribution of individual foods to total expo- for each of these contaminants is exceeded by the
sures was analyzed for all children ages 1 to 5 years. time age 12 years is reached. Exposures from age 12
This analysis was performed for the six con- to 70 years pose additional risks above those result-
ing from exposure in the 7rst 12 years of life. The
taminants identi7ed in the previous analysis. Re-
sults are presented in Fig. 7. Similar to the results assessment of cancer hazard ratios for childhood
for adults, the analysis shows that 7sh, meat, and exposure applied a standard exposure metric, the
other animal products are the largest contributors to lifetime average daily dose. However, this approach
exposure for children ages 1 to 5 years. In addition, may understate cancer risks, as childhood exposures
rice (for arsenic) and milk (for DDT) are larger may have greater probability of producing tumors
contributors to children’s exposure than to adults’ than exposures in adulthood. Risks may be greater
exposure. for children due to potential enhanced potency of
exposures in childhood as well as the increased num-
ber of remaining years of life for tumors to form
DISCUSSION
(McConnell, 1992; National Research Council,
This analysis represents an important step in as- 1993). Therefore, the risks of several pollutants with
sessing and characterizing the potential hazards as- childhood exposure hazard ratios somewhat less
sociated with contamination of food and suggests than one in Fig. 5 may actually exceed the cancer
additional steps to be taken to further re7ne our benchmark level of one in one million. In the case in
understanding of this potential problem. Initial which nondetects are assumed to be equal to zero,
screening of the data found that estimated exposure these pollutants include toxaphene, heptachlor, lin-
to a number of contaminants in the average diet of dane, carbaryl, and permethrin. For several of these
adults and children exceed benchmark concentra- contaminants, exposures are largely attributable to
FIG. 7. Contribution of individual foods to total average exposure for children ages 1}5 years.
13. 182 DOUGHERTY ET AL.
In addition, the testing procedures for the 7sh in
residues on produce. For example, childhood car-
baryl exposure is associated primarily with apples the National Sediment Inventory include targeted
and grapes. testing for contaminants expected to be present in
7sh at the sampling sites or for sites that are ex-
Most of these pollutants were identi7ed because
they exceeded the cancer benchmark, which repres- pected to have contaminants present. Overall, this
ents a one in a million risk level, rather than the potential bias is likely to overestimate contaminant
noncancer benchmark. Exposures greater than the concentrations and resulting exposures. To assess
one in a million cancer risk screening level can this potential bias, contaminant data in NSI were
result in large numbers of people potentially at risk. compared to two other data sources;FDA’s Total
However, the one in a million cancer benchmark Diet Study and USEPA’s National Study of Chem-
tends to be a more conservative screen than the ical Residues in Fish (NSCRF) (U.S. Environmental
Protection Agency, 1992). For freshwater 7sh, it ap-
noncancer benchmark. For example, a study by
Gaylor (1989) compared the lower 95% con7dence pears that contaminant levels measured in the TDS
level of the dose which results in 1% of test animals and NSCRF databases are lower than those mea-
exhibiting effects for both teratogenic and carcino- sured in NSI, although the comparisons are some-
genic effects (this risk metric is often referred to as what uncertain because of the small sample sizes in
TDS and NSCRF. For shell7sh and saltwater 7sh
the LED ). He found that the LED for teratogenic
effects was similar to or lower than the LED for the difference in contaminant levels is mixed. For
saltwater 7sh, there are lower contaminant levels of
carcinogenic effects for four of nine chemicals evalu-
ated, indicating that the dose associated with a 1% arsenic, cadmium, and hexachlorobenzene in TDS
effect level was similar or lower for teratogenic and NSCRF than in NSI, but higher levels of DDT,
effects than for carcinogenic effects. This indicates dieldrin, and PCBs. Similarly for shell7sh, there are
that the benchmark for noncancer effects may not lower levels of arsenic, cadmium, mercury, and
be as conservative a screen as that for the cancer PCBs in TDS and NSCRF than in NSI, but higher
effects. levels of DDT.
It is important to note that some of the identi- Evaluating the contribution of different food
7ed pesticides have been banned for all uses in sources to overall exposure 7nds that, even if the
freshwater 7sh contaminant levels in NSI are
the United States. DDT, for example, has been
banned for over two decades. However, because overestimated, other foods still contribute signi7-
many of these compounds, such as DDT, are highly cantly to exposure. Signi7cant decreases in the con-
tribution of freshwater 7sh to exposure levels would
persistent, they continue to show up at signi-
7cant levels in the food supply, indicating the im- result in somewhere between 20 and 70% reduction
portance of considering persistence when assessing in exposure for chlordane, DDT, dieldrin, dioxins,
potential risks. and PCBs. However, the exposure levels for each of
The results indicate that exposures to contami- these contaminants are at least an order of magni-
nants identi7ed in the analysis are largely driven by tude greater than the cancer benchmarks and in the
contamination in 7sh. However, there are some ca- case of dioxins and PCBs, 1000 times greater than
veats to these results. One is that the 7sh samples the cancer benchmarks.
were collected and tested in raw tissues. The total Arsenic is a food contaminant that has been iden-
amount of contaminants actually consumed in 7sh ti7ed through our screening analysis as potentially
may be less than levels present before cooking be- representing a health risk. It is important to note
cause lipids and lipophilic compounds are partially that the measurements of arsenic in food used in this
removed during cooking and processing. Previous study are for total arsenic, which is made up of
studies indicate that the cooking and processing of inorganic and organic arsenic, with inorganic ar-
7sh decreases contaminant levels of at least 7ve of senic typically comprising less than half the total.
the six contaminants analyzed in detail;chlordane, Inorganic arsenic is more toxic than organic arsenic;
DDT, dieldrin, dioxins, and PCBs;with average the results of this study could overestimate potential
losses of these contaminants ranging from 20 to 46% risks because the RfD and cancer benchmark used in
(Voiland et al., 1991; Sherer and Price, 1993; Zabik the analysis are for inorganic arsenic rather than
and Zabik, 1995; Zabik et al., 1995). However, even total arsenic. A recent analysis of arsenic data from
with a 46% decrease in 7sh contaminant concentra- Tao and Bolger (1998) by the National Research
tions, estimated national average exposure levels for Council (National Research Council, 1999) assessed
the 7ve contaminants would still exceed benchmark the daily intake of inorganic arsenic for various age
concentrations. and gender groups. The assessment was based on
14. 183
DIETARY EXPOSURES TO FOOD CONTAMINANTS
estimates of the percentage of inorganic arsenic in the impact of different nondetect values on the expo-
the measured concentrations of total arsenic from sure outcomes. For some contaminants, assuming
the FDA Total Diet Study for 1991}1997. The study that nondetects are equal to one half of the detection
estimated a range of 0.066}0.34 g/kg/day of intake limit dominates the overall contaminant exposure.
of inorganic arsenic with an average of about In these cases, assuming a value of one half of the
0.14 g/kg/day. The national average exposure esti- detection limit is likely to overstate the contaminant
mate derived in our study for total arsenic, with no levels. A more re7ned analysis of nondetects in the
adjustment for inorganic arsenic, was 0.2 g/kg/day, case of pesticides currently in use could consider the
based primarily on measured arsenic concentrations food source and whether pesticides were applied to
from the National Sediment Inventory. Our study’s that crop to determine whether one half the detec-
estimates for total arsenic are similar to the NRC tion limit is an appropriate assumption. Future
estimates for inorganic arsenic, indicating that our work will consider the distribution of the detects in
estimates based on total arsenic are unlikely to assessing the likely values below the detection limit
signi7cantly overestimate exposure to inorganic and other methods for determining appropriate
arsenic. values for the nondetects. Despite the presence of
Our study’s exposure estimates represent in- many nondetects, exposures to six contaminants ex-
formation from the early 1990s, and levels of con- ceed benchmarks even when nondetects are set
taminants, particularly some of the persistent equal to zero. In addition to the number of non-
compounds such as DDT and PCBs, have likely de- detects, the sample size is fairly small for some of the
creased some since then. Most studies evaluating contaminants (e.g., dioxins), and thus results for
trends in persistent compounds have focused on these contaminants may be less reliable than results
trends prior to 1990 or through the mid-1990s for other contaminants.
(Robinson et al., 1990; Fensterheim, 1993; Noren, Another source of uncertainty in this analysis
1993; Papke et al., 1994; Becher et al., 1995; Bopp arises from the fact that one food type may be com-
et al., 1998). A study of PCBs in the human diet prised of several different forms of a particular food.
For example, average freshwater 7sh contamination
found a 2- to 10-fold decline in PCB contamination of
shell7sh and 7sh from the early 1970s to the late levels were calculated by averaging concentrations
in different freshwater 7sh species sampled. How-
1980s and similar decreases in the diet and adipose
tissue of the public (Fensterheim, 1993). However, ever, contamination levels are species dependent.
Fensterheim (1993) also notes that the rate of de- For lipophilic contaminants, species with a higher
cline will slow, since most of the dramatic declines fat content will have higher contaminant levels.
are associated with major regulatory initiatives in Therefore, if the actual consumption of freshwater
7sh is composed of 7sh species that, on average, have
the 1970s and 1980s. Similar results would be ex-
a higher fat content than the 7sh sampled, the pre-
pected for other persistent compounds such as DDT
and dioxins. A study of sediment in the Hudson liminary analysis will understate exposures to
River basin, which would contribute to 7sh concen- lipophilic contaminants in freshwater 7sh. While
trations, also found declines from the 1960s to the there are inconsistencies in the composition of other
mid-1980s to mid-1990s in DDT, dioxins, and PCBs foods in the consumption and contamination
due to regulatory measures, though there were a few databases, it is particularly important for the three
7sh categories, as 7sh comprises a large proportion
areas which saw increases in sediment concentra-
tions (Bopp et al., 1998). Decreases in dioxins in of the average national exposures to certain con-
blood and breast milk are also noted in several Euro- taminants.
pean studies (Noren, 1993; Papke et al., 1994; This analysis estimates average contaminant ex-
Becher et al., 1995). Overall, these indicate that posure across both consumers and nonconsumers
there has been a substantial decrease in 7sh con- of the individual food items. Only 4, 12, and 30% of
the population are consumers of freshwater 7sh,
taminant levels from the 1970s due to regulatory
shell7sh, and saltwater 7sh, respectively. Thus, the
controls, but the rate of decline may be slower and in
contaminant exposure level from 7sh for the average
some cases nonexistent in the 1990s.
An important consideration in this analysis is the consumer is much greater than the average for the
large number of nondetects. The percentage of non- whole population. In addition, this analysis examines
detects for the contaminants ranged from 10 to only the mean level of contaminant exposure and does
100%, with an average of 86%. The analysis was not assess exposures for those populations that con-
performed assuming that nondetects were equal to sume higher levels of particular foods or foods with
either zero or one half of the detection limit to assess much higher than average levels of contaminants.
15. 184 DOUGHERTY ET AL.
There are also limitations associated with the food rin, simazine, and toxaphene. Additional research
consumption data due to the short sampling period. efforts should focus on collecting data for these con-
USDA collected food consumption data over 3 days, taminants. Results also indicate that detection
which were scheduled in different seasons to account limits for many samples exceed benchmark concen-
for the potential for seasonal variation in consump- trations. Lower detection limits are needed to better
tion. Because of the short duration of sampling, identify the frequency with which contaminant con-
however, the consumption data may not accurately centrations are at levels of public health concern.
represent average daily consumption over a longer
period of time. Better characterization of the con-
sumption of foods that drive the analysis (e.g., 7sh
ACKNOWLEDGMENTS
and meats) are needed to reduce the uncertainty
associated with the consumption data. This includes This work was funded by the U.S. Environmental Protection
better information on both the proportion of indi- Agency, Of7ce of Policy. The authors acknowledge the research
viduals that consume each food and the quantity support provided by Todd Lookingbill, Anne Petersen, and Eliza-
consumed by these consumers. beth Snell (formerly of Industrial Economics, Inc.); the assistance
in compiling the food consumption data provided by Kathryn
This analysis has focused on the combined expo-
Fleming of Technical Assessment Systems, Inc. and Barbara
sures to food contaminants that result from their Petersen of Novigen Sciences (formerly of Technical Assessment
presence in several different types of foods. Under Systems, Inc.); and the technical review provided by John Evans
the Food Quality Protection Act (FQPA) of 1996, the of the Harvard School of Public Health.
U.S. Environmental Protection Agency is currently
developing methods to extend the scope of exposures REFERENCES
considered in analysis of pesticides (U.S. Environ-
mental Protection Agency, Of7ce of Pesticide Pro- Becher, G., Skaare, J. U., Polder, A., Sletten, B., Rossland, O. J.,
Hansen, H. K., and Ptashekas, J. (1995). PCDDs, PCDFs, and
grams, 2000). FQPA requires that USEPA consider
PCBs in human milk from different parts of Norway and
the aggregate exposures to pesticides from multiple
Lithuania. J. Toxicol. Environ. Health 46, 133}148.
routes and pathways;combining food ingestion ex-
Bopp, R. F., Chillrud, S. N., Shuster, E. L., Simpson, H. J., and
posures with drinking water exposures and oral, Estabrooks, F. D. (1998). Trends in chlorinated hydrocarbon
inhalation, and dermal exposures that may result levels in Hudson River basin sediments. Environ. Health Per-
from residential pesticide application. FQPA also spect. 106(Suppl. 4), 1075}1081.
requires that USEPA consider the cumulative risks Caldwell, J., Woodruff, T., Morello-Frosch, R., and Axelrad, D.
(1998). Application of hazard identi7cation information for pol-
to human health that may result from exposures to
lutants modeled in EPA’s Cumulative Exposure Project. Toxi-
multiple pesticides with common mechanisms of
col. Indust. Health 14, 429}454.
toxicity. When fully implemented, these new ap-
Chemical Information Services. (1995). National Food Processors
proaches will provide a broader perspective on the Association Search Results 1987}1992.
potential of various pesticides to pose substantial 104th Congress. (1996). Food Quality Protection Act of 1996.
risks to human health. Fensterheim, R. J. (1993). Documenting temporal trends of
Despite the limitations associated with the analy- polychlorinated biphenyls in the environment. Regul. Toxicol.
sis, the results point to potentially high exposures to Pharmacol. 18, 181}201.
contaminants in food and represent an important Gaylor, D. (1989). Comparison of teratogenic and carcinogenic
risks. Regul. Toxicol. Pharmacol. 10, 138}143.
step toward better characterization of these expo-
MacIntosh, D. L., Spengler, J. D., Ozkaynak, H., Tsai, L., and
sures. The analysis has identi7ed research priorities
Ryan, P. B. (1996). Dietary exposures to selected metals and
for improving the data needed to better understand
pesticides. Environ. Health Perspect. 104, 202}209.
food contaminant exposures. The small number of
McConnell, E. (1992). Comparative responses in carcinogenesis
samples for shell7sh and saltwater 7sh combined bioassays as a function of age at 7rst exposure. In ‘‘Similarities
with the potentially high contribution of these foods and Differences between Children and Adults: Implications for
to total exposures for some contaminants (arsenic Risk Assessment’’ (C. H. P. S. Guzelian and S. S. Olin, Eds.),
pp. 66}78. ILSI Press, Washington, DC.
and PCBs in shell7sh; arsenic, chlordane, dieldrin,
dioxin, and PCBs in saltwater 7sh) suggest that National Research Council. (1987). ‘‘Regulating Pesticides in
Food;The Delaney Paradox.’’ Natl. Acad. Sci.}Natl. Res. Coun-
testing of these contaminants in shell7sh and salt-
cil, Washington, DC.
water 7sh should be a priority for future monitoring
National Research Council. (1993). ‘‘Pesticides in the Diets of
activities. In addition, the food contamination Infants and Children.’’ Natl. Acad. Sci.}Natl. Res. Council,
database contains a small number of samples of Washington, DC.
certain contaminants with potentially high expo- National Research Council. (1999). ‘‘Arsenic in Drinking Water.’’
sures, including arsenic, dioxins, carbaryl, permeth- Natl. Acad. Sci.}Natl. Res. Council, Washington, DC.
16. 185
DIETARY EXPOSURES TO FOOD CONTAMINANTS
Noren, K. (1993). Contemporary and retrospective investiga- U.S. Environmental Protection Agency. (1992). ‘‘National Study
tions of human milk in the trend studies of organochlorine of Chemical Residues in Fish.’’ Of7ce of Science and Techno-
contaminants in Sweden. Sci. Total Environ. 139+140, logy, Washington, DC.
347}355. U.S. Environmental Protection Agency. (1994). ‘‘Estimating Ex-
Papke, O., Ball, M., and Lis, A. (1994). PCDD/PCDF in humans, posure to Dioxin-Like Compounds.’’ Volume II: ‘‘Properties,
a 1993-update of background data. Chemosphere 29, 2355} Sources, Occurrence and Background Exposures.’’ Of7ce of
2360. Research and Development, Washington, DC.
Robinson, P. E., Mack, G. A., Remmers, J., Levy, R., and U.S. Environmental Protection Agency, Of7ce of Pesticide Pro-
Mohadjer, L. (1990). Trends of PCB, hexachlorobenzene, and grams. (2000). Science Policy Issues Guidance Documents.
beta-benzene hexachloride levels in the adipose tissue of the http://www.epa.gov/oppfead1/trac/science/ (accessed June 2,
U.S. population. Environ. Res. 53, 175}192. 2000).
Sherer, R. A., and Price, P. S. (1993). The effect of cooking pro- U.S. Food and Drug Administration. (1994). Total Diet Study,
cesses on PCB levels in edible 7sh tissue. Qual. Assur. 2, 1982}1991; 1992}1994.
396}407. Voiland, M. P., Gall, K. L., Lisk, D. J., and MacNeill, D. B. (1991).
Tao, S., and Bolger, P. (1998). ‘‘Dietary Intakes of Arsenic in Effectiveness of recommended fat-trimming procedures on the
the United States.’’ Presented at the Third International reduction of PCB and mirex levels in brown trout from Lake
Conference on Arsenic Exposure and Health Effects, San Ontario. J. Great Lakes Res. 17, 454}460.
Diego, CA.
Wiles, R., Davies, K., and Campbell, C. (1998). ‘‘Overexposed:
Technical Assessment Systems, Inc. (1994). ‘‘Development of a Organophosphate Insecticides in Children’s Food.’’ Environ-
Dietary Exposure Potential Matrix.’’ Prepared for U. S. Envir- mental Working Group, Washington, DC.
onmental Protection Agency.
Winters, D., Cleverly, D., Meier, K., Dupuy, A., Byrne, C.,
Technical Assessment Systems, Inc. (1995). ‘‘Continuing Survey Deyrup, C., Ellis, R., Ferrario, J., Harless, R., Leese, W., Lor-
of Food Intakes by Individuals 1989}1991 (Summary Tables).’’ ber, M., McDaniel, D., Schaum, J., and Walcott, J. (1994). ‘‘A
Prepared for Industrial Economics, Inc. Statistical Survey of Dioxin-Like Compounds in United States
U.S. Department of Agriculture. (1994). Pesticide Data Program, Beef: A Progress Report.’’ Presented at the Meeting of the 14th
Summary of 1992 Data, Appendix 4, Agricultural Marketing Annual International Symposium on Chlorinated Dioxin and
Service. Furans, Kyoto, Japan.
U.S. Department of Agriculture. (1995a). 1992}1993 Pesticide Zabik, M. E., and Zabik, M. J. (1995). Tetrachlorodibenzo-p-dioxin
residue reduction by cooking/processing of 7sh 7llets harvested
Data Program Databases.
from the Great Lakes. Bull. Environ. Contam. Toxicol. 55,
U.S. Department of Agriculture. (1995b). Microbiology and
264}269.
Residue Computer Information System 1990}1995, Residue
Evaluation and Planning Division. Zabik, M. E., Zabik, M. J., Booren, A. M., Daubenmire, S., Pascall,
U.S. Environmental Protection Agency. (1990). ‘‘Interim M. A., Welch, R., and Humphrey, H. (1995). Pesticides and total
Methods for Development of Inhalation Reference Concen- polychlorinated biphenyls residues in raw and cooked walleye
trations.’’ Of7ce of Research and Development, Washington, and white bass harvested from the Great Lakes. Bull. Environ.
DC. Contam. Toxicol. 54, 396}402.