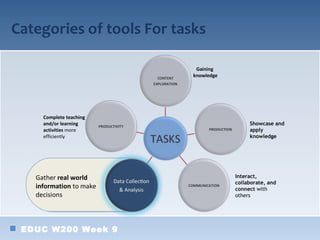
1. Categories of tools For tasks
Gaining
knowledge
Complete teaching
and/or learning Showcase and
activities more apply
efficiently knowledge
Gather real world Interact,
collaborate, and
information to make connect with
decisions others
EDUC W200 Week 9
3. DATA COLLECTION & ANALYSIS (DC&A) TASKS:
• Discussion Questions :
o Have you ever collected data for a school project?
o Have you ever analyzed data for a school project?
EDUC W200 Week 9
4. DATA COLLECTION AND ANALYSIS:
TASKS DEFINED
Data Collection and Analysis (DC&A) tasks:
o Tasks where students gather real world information about a problem and
study/evaluate to come up with a conclusion/solution for the problem.
Data analysis tasks
o Finding patterns & trends
o Working with words, ideas, and/or numbers
o Classify, sequence, relate things to each other
Data collection tasks
o Students collect their own data OR
o Students find existing data sets
EDUC W200 Week 9
5. DATA COLLECTION AND ANALYSIS:
ACROSS SUBJECT AREAS
• Sharing your experience:
o Have you seen any data collection and analysis tasks in your
subject area?
o Did you use any technology tools?
• Have you seen any data collection and analysis
tasks cross subject areas?
EDUC W200 Week 9
7. WHAT ARE DATA ANALYSIS TASKS?
• It’s all about organizing and looking for patterns in
data.
o Provide students with raw materials
• facts, numbers, words, etc
o Asks them to draw conclusions on their own (based on the
data)
o Not limited to numbers – it’s about patterns of all types
EDUC W200 Week 9
8. EXAMPLES OF DATA ANALYSIS TASKS
• Taking measurements of three different plants over the course of a month
(science)
• Looking up the parties of presidential election winners and recording them
for each election year (social studies)
• Looking at multiple poems and finding the common meters, themes,
structures
• Measuring angles and using these measurements to create “rules” for
geometry
• Using surveys to compare favorite style of music, favorite instrument,
favorite concept studied in Music Appreciation class across grade levels
(Fine Arts)
• Investigating the number of football related deaths in high schools across
the country for the past 30 years to detect trends (Health/Physical
Education)
EDUC W200 Week 9
9. WHY BOTHER WITH DATA ANALYSIS TASKS?
• Analyzing your real data makes learning more
meaningful
• Provides a visual way to view information (Ex: Wordle
or InspireData)
• It also teaches problem solving
EDUC W200 Week 9
Editor's Notes
Note for AI: You can share one or two student responses from CP#9 here.
Data Analysis Tasks Looking for patterns or trends Classifying, sequencing, categorizing Doesn ’t have to be complicated to be effective! Can be done with collected data or database data It ’s all about thinking about, moving around, organizing and looking for patterns in data.
Examples of analyzing data Distributing survey of height, weight, and gender (math/statistics) Plotting various combinations of the data for statistical analysis or “eyeball testing” Taking measurements of three different plants over the course of a month (science) Plotting the growth and comparing Looking up the parties of presidential election winners and recording them for each election year (social studies) Creating a timeline of the winners and major historical events and looking for patterns
Letting students analyze their own data instead of “just telling them the rule/pattern” adds authenticity It gives students a chance to look at unifying themes (Ex: Wordle ) or visual representations of many details ( InspireData ) It also teaches problem solving - they won ’t always have you to tell them the rule or pattern! If the student can figure out the