Assessment of Heavy Metals in Water and Fish Samples of Abandoned Mining Ponds in Barkin Ladi, Plateau State, Nigeria

Twenty (20) sample regimes were collected for each sample matrix. The samples were pretreated and digested for the determination of selected heavy metals of interest (As, Cd. Cr, Hg, Ni and Pb. The results reveals that mean concentrations of elements in the water samples decreases in the sequence as follows Hg > Ni > Cr> Pb > As > Cd. This clearly confirmed that Hg has the highest concentration followed by Ni, with Cd being the least. The mean concentrations of elements in the cat fish organs flesh, Gills, Kidney and liver of Barkin-Ladi pond water samples are given in table 4 above. The results confirmed the differences of accumulation of element in different catfish organs. The element concentrations in the cat fish samples decreased in the sequence for the flesh as Ni > Cr >Pb > Hg > As > Cd, for the gills Ni > Hg > Cr > Pb > As > Cd, for kidney Ni > Pb > Hg > Cr > As > Cd, for liver Ni > Cr > Cd > Pb > Hg > As. A two-way ANOVA showed that there was no significant difference between the mean concentrations of elements in the organs of the same fish species, while there is significant difference in the mean concentration between the organs of the different fish species investigated. The correlation analysis was carried out to determine the relationship between the concentrations of element in water sample of the study area. The result above reveals that there is a significant correlation between Cd and Pb, and also there is a significant relationship between Cr and Ni elements. While no significant correlation was observed between the other pairs. These implied that the pairs either have the same source or chemical species. Generally, the ponds were shown to be polluted with heavy metals thus the risk of bioconcentration and bioaccumulation of these heavy metals in the aquatic lives, thus endangering human health directly when consumed or through the food chain.

Recommended
Recommended
More Related Content
What's hot
What's hot (20)
Similar to Assessment of Heavy Metals in Water and Fish Samples of Abandoned Mining Ponds in Barkin Ladi, Plateau State, Nigeria
Similar to Assessment of Heavy Metals in Water and Fish Samples of Abandoned Mining Ponds in Barkin Ladi, Plateau State, Nigeria (20)
More from Associate Professor in VSB Coimbatore
More from Associate Professor in VSB Coimbatore (20)
Recently uploaded
Recently uploaded (20)
Assessment of Heavy Metals in Water and Fish Samples of Abandoned Mining Ponds in Barkin Ladi, Plateau State, Nigeria
- 1. Mediterranean Journal of Basic and Applied Sciences (MJBAS) Volume 4, Issue 3, Pages 18-32, July-September 2020 ISSN: 2581-5059 www.mjbas.com 18 Assessment of Heavy Metals in Water and Fish Samples of Abandoned Mining Ponds in Barkin Ladi, Plateau State, Nigeria Nangbes Jacob Gungsat1 *, Dawam Nancy Naanogot2 & Lawam, Tobias Deban3 1 *Department of Chemistry, Plateau State University, Bokkos, Nigeria. Email: jgnangbes@plasu.edu.ng 2 Department of Microbiology, Plateau State University, Bokkos, Nigeria. 3 Department of Chemistry, College of Arts, Science and Technology, Kurgwi, Plateau State. DOI: 10.46382/MJBAS.2020.4303 Article Received: 09 June 2020 Article Accepted: 14 August 2020 Article Published: 30 August 2020 1.0 Introduction Water is essential for the health of humans and other living things and adequate supply of safe drinking water is important for the socio-economic development of a nation (Ibrahim). Drinking water pollution has continued to generate unpleasant implications for health and economic development in Nigeria and the third world in general (Rashmi et al, 2019; Nnaji and Omotugba, 2014). It serves as a significant utility in irrigation of agricultural lands, generation of hydro-electric power, municipal water supply, fishing, boating and body-contact recreation, communication as well as unending domestic activities of man and animals (Chapman, 1996). It also serves as a receiver of industrial waste, domestic waste and wastewater resulting from other uses of water (Chapman, 1996). Environmental deterioration is then a natural outcome of rapid population growth, agricultural practices, industrialization and urbanization of society (Teri, 2000). The indiscriminate discharge of industrial effluents, raw sewage wastes and other anthrpogenic wastes pollute most of the environments and affect survival and physiological activities of target organisms. Pollution of the aquatic environment by inorganic chemicals has been considered a major threat to the aquatic organisms including fishes (Nangbes et al, 2018) Metals in particular have a tendency to accumulate and undergo food chain magnification. Heavy metals affect all groups of organisms and ecosystem processes, including microbial activities (Baby et al, 2010). The bioaccumulation of heavy metals in living organisms and biomagnification in them describes the processes and pathways of these pollutants from one trophic level to another, exhibiting the higher bioaccumulation ability in the organisms concerned. Some of these organisms, like fishes, are consumed by ABSTRACT Twenty (20) sample regimes were collected for each sample matrix. The samples were pretreated and digested for the determination of selected heavy metals of interest (As, Cd. Cr, Hg, Ni and Pb. The results reveals that mean concentrations of elements in the water samples decreases in the sequence as follows Hg > Ni > Cr> Pb > As > Cd. This clearly confirmed that Hg has the highest concentration followed by Ni, with Cd being the least. The mean concentrations of elements in the cat fish organs flesh, Gills, Kidney and liver of Barkin-Ladi pond water samples are given in table 4 above. The results confirmed the differences of accumulation of element in different catfish organs. The element concentrations in the cat fish samples decreased in the sequence for the flesh as Ni > Cr >Pb > Hg > As > Cd, for the gills Ni > Hg > Cr > Pb > As > Cd, for kidney Ni > Pb > Hg > Cr > As > Cd, for liver Ni > Cr > Cd > Pb > Hg > As. A two-way ANOVA showed that there was no significant difference between the mean concentrations of elements in the organs of the same fish species, while there is significant difference in the mean concentration between the organs of the different fish species investigated. The correlation analysis was carried out to determine the relationship between the concentrations of element in water sample of the study area. The result above reveals that there is a significant correlation between Cd and Pb, and also there is a significant relationship between Cr and Ni elements. While no significant correlation was observed between the other pairs. These implied that the pairs either have the same source or chemical species. Generally, the ponds were shown to be polluted with heavy metals thus the risk of bioconcentration and bioaccumulation of these heavy metals in the aquatic lives, thus endangering human health directly when consumed or through the food chain. Keywords: Barkin-Ladi, Heavy metals, Clarias gariepinus, Tilapia zili, Water.
- 2. Mediterranean Journal of Basic and Applied Sciences (MJBAS) Volume 4, Issue 3, Pages 18-32, July-September 2020 ISSN: 2581-5059 www.mjbas.com 19 human beings. They could also cause several catastrophic diseases like Minamata and Itai-Itai and many othr cardiovascular diseases (Baby et al, 2010). Acording to Nnaji and Omotugba (2014), in a recent research conducted on several sources of drinkind water, they discovered that all other metals were within desirable limits except magnesium (Mg), cadmium (Cd) and lead (Pb). Mean values for mg were higher than the 0.20 mgL-1 SON maximum limit. Cd was not detected at sampling point 12 but exceeded the WHO and SON limits in all the other sites including the water works. The contamination of fresh waters with a wide range of pollutants has become a matter of concern over the last few decades. Among the various toxic pollutants, heavy metals are particularly severe in their action due to persistence biological amplification through the food chain (Shah and Altindau, 2005). Heavy metals have long being recognised as serious pollutants of the aquatic ecosystem. The heavy metals that are toxic to many organisms at very low concentrations and are never beneficial to living beings are Hg, Cd, and Pb (Dahunsi, 2012). The increase of human populations and their anthropogenic activities have considerably contributed to the weakening in water quality, including accumulation of heavy metals in the ground and coastal waters (Agrawal et al; Kaushal et al, 2015; Akan et al, 2012). Heavy metals are among the most common environmental pollution index and their occurrence in water system indicate the presence of natural or anthropogenic sources, such as geologic weathering, mining practices, industrial activities, urban development, as well as deposition from the atmosphere and biological systems (Nangbes et al, 2019, 2018, 2014, Akan et al , 2012). The behaviors of heavy metals within aquifer has been an issue of increasing concern in environmental studies over the past few years because of the metals’ ecotoxicity features, persistence, and bioaccumulation as well as bio-magnification in the aquatic systems (Nangbeset al, 2018; Armid et al, 2017; Agrawal et al, 2016; Dahunsi et al 2012; Akan et al, 2012). According to Armid et al (2017) Pb can exist in aqautic system in a much higher concentration than other heavy metals. They showed that Pb had the highest concentrations in the water system of Kendari Bay and is severely polluted with heavy metal Pb to 210 time more than other metals. This shoewd a serious potential health harzard to both plant and animals within and around the equifer. Transportation of metals in fish tissues occurs through the blood where the ions are usually bound to other biochemical substances such as proteins. The metals are brought into contact with the organs and tissue of the fish and consequently accumulated to a different extent in different organs or tissues of the fish (Dahunsi et al 2012). Once heavy metals are accumulated by an aquatic organism, they can be transported through the upper class of the food chain (Ayandiran et al., 2009) Bioaccumulation of heavy metals in tissues of marine organisms has been identified as an indirect measure of the abundance and availability of metals pollution levels in the marine environment (Nangbes et al, 2018; Udiba et al, 2014). Monitoring fish tissue contamination therefore serves an important function as an early warning indicator of sediment contamination or related water quality problems and enables appropriate action to be taken in order to protect public health and the environment. Trace elements contents of tissues of Clarias gariepinus from River Galma, River Kubanni and Fish farms in Zaria, Nigeria were investigated. The metals entering the aquatic ecosystem may not directly cause damage to organism but they can be deposited in aquatic organism through the
- 3. Mediterranean Journal of Basic and Applied Sciences (MJBAS) Volume 4, Issue 3, Pages 18-32, July-September 2020 ISSN: 2581-5059 www.mjbas.com 20 effect of bioconcentration, bioaccumulation and other food chain processes thus gets to man in concentrations that poses threats to human health via consumption of seafoods (Nangbes, 2018; Adewoye and Fawole, 2002). Heavy metal pollution is known to be the cause of various diseases globally, such as the minamata disease (organic mercury poisoning), iItai-itai disease (cadmium poisoning), arsenous acid poisoning, and airpollution-related asthma (Matsuo, 2003). Marine ecosystems are highly complex, dynamic and subject to many internal and external relationships that are subject to change over time. The pollutants that enter the inshore waters and estuaries create serious problems causing extensive damage to the life and activities of the living aquatic organisms and even to mass mortality. Among the pollutants, accumulation of heavy metals in marine ecosystems is of global importance (Baby et al, 2010). Accoring to recent research findinds (Dahunsi et al 2012), fish can be a good pollution bioindicator. The resach finding in the work of Dahunsi et al (2012) to study the bioaccumulation of cadmium and lead showed that the highest bioaccumulation of lead was 0.4680 mg/L while the least was 0.0660 mg/L. Cadmium bioaccumulation in the head had the highest value to be 2.0424 mg/L while the lowest value was 0.0101 mg/L. In the head capsule on the other hand, the highest accumulation of lead was found to be 0.3918 mg/L while its lowest value was 0.1677 mg/L. The highest value for cadmium in the head capsule was 2.0249 mg/L while its lowest was 0.0058 mg/L. It was revealed in the study that fish can bioaccumulate heavy metals from a polluted environment, which often result in reduction or impairment of natural population size and could be a veritable source of these metals to man. Lead is a cumulative poison and a possible human carcinogen (Adedeji and Okocha, 2011) while for mercury, toxicity results in mental disturbance and impairment of speech, hearing, vision and movement Adepoju-Bello and Alabi, 2005). In addition, lead and mercury may cause the development of autoimmunity in which a person’s immune system attacks its own cells. This can lead to joint diseases and ailment of the kidneys and circulatory system and neurons. At high concentrations, lead and mercury can cause irreversible brain damage. Mercury (Hg) is one of the most hazardous environmental pollutants due to its toxicity and its accumulation in aquatic organisms. The relative toxicity of mercury depends on its chemical form, methyl mercury being one of the most toxic substances existing in the environment. The consumption of fish is the main route of exposure of humans to monomethylmercury, which represent the main form of mercury in fish due to biomagnification in the marine food chain (Bakre-)dunola, 2005). According to (Akan et al, 2012; Mehdi et al, 2013; Mensoor and Said, 2018), the order of mercury concentrations in tissues of the fish species was as follows: liver > gill > muscle and in tissues of the kingfisher species was as follows: feather > liver > kidney > muscle. Therefore, liver in fish and feather in kingfisher exhibited higher mercury concentration than the other tissues ( Huang et al, 2019; Ishaq et al, 2014). There was a positive correlation between mercury concentrations in fish and kingfisher species with size of its food items. The aim of the current study is to investigate the distribution of the heavy metals As, Cd, Cr, Hg, Ni and Pb in abandoned mining pond of Barkin Ladi water and the fish saples (Tilapia zili and Clarias gariepinus) in order to consider their sources and pollution safe status.
- 4. Mediterranean Journal of Basic and Applied Sciences (MJBAS) Volume 4, Issue 3, Pages 18-32, July-September 2020 ISSN: 2581-5059 www.mjbas.com 21 2.0 Description of Sampling Sites Barkin-ladi is a local government in Plateau state of Nigeria at latitude 9o 32 north and 8o 54 east. It has an area of 1,032km3. The speciation study covered seven mining ponds. They are one of the notable areas because of their large industrialization that potentially contribute to soil pollution. The locations of the sample sites are shown in table 1 below. Table 1: Geographical locations of sampling sites S/No. NAME OF LOCATION LATITUDE LONGITUDE ELEVATION (MASL) 1 MAIYANGA DIRIS 09O 24.551’ 008O 54.415’ 1373 2 KUBA (B) 09O 25.138’ 008O 55.287’ 1398 3 MAIJAHOTA 09O 26.902’ 008O 55.607’ 1377 4 RW 09O 28.014’ 008O 55.447’ 1402 5 LOKO KASSA I 09O 33.692’ 008O 54.457’ 1278 6 LOKO KASSA II (BIG DAM) BEHIND GWOL MOTEL 09O 33.698’ 008O 54.527’ 1279 7 LOKOJORO (KASSA) 09O 33.907’ 008O 54.030’ 1299 8 DIRECTLY BEHIND GWOL MOTEL 09O 33.774’ 008O 53.969’ 1304 9 SOUTH OF B/LADI STADIUM 09O 32.483’ 008O 53.005’ 1288 10 MARARABAN KANTOMA 09O 30.869’ 008O 59.997’ 1297 11 GONAN YASHI (BOKKOS ROAD, B/ LADI) 09O 31.748’ 008O 54.091’ 1295 12 MARIT 09O 32.966’ 008O 53.173’ 1287 13 RAKUNG I 09O 32.877’ 008O 53.115’ 1289 14 RAKUNG II 09O 32.820’ 008O 53.115’ 1300 15 NGWETTI 09O 33.009’ 008O 53.270’ 1291 16 BOYI 09O 33.097’ 008O 54.230’ 1294 17 DANGU 09O 32.914’ 008o 53.503’ 1285 18 KWORROS 09O 32.420’ 008o 53.576’ 1290
- 5. Mediterranean Journal of Basic and Applied Sciences (MJBAS) Volume 4, Issue 3, Pages 18-32, July-September 2020 ISSN: 2581-5059 www.mjbas.com 22 19 MAKAGI 09O 33.532’ 008o 52.820 1289 20 TEROT 09O 33.415’ 008o 52.947 1282 ` Fig.1 Georeferenced map of Barkin-Ladi showing sample sites 2.1 Sample Collection and Pretreatment 2.1.1 Sample Collection Water and fish samples were collected from twenty (20) different ponds in Barkin-Ladi LGA of Plateau State. At each pond, fish samples were bought from the local fishermen and washed with tap water and then properly rinsed with distilled water. The samples were then dissected with plastic knife and organs of interest removed and air dried to constant weight. The water samples for each pond were also collected by the fishermen form the four geographical cardinal points and the middle.
- 6. Mediterranean Journal of Basic and Applied Sciences (MJBAS) Volume 4, Issue 3, Pages 18-32, July-September 2020 ISSN: 2581-5059 www.mjbas.com 23 2.2 Digestion of samples 2.2.1 Fish Acid digestion of samples Acid mixture (10 mL, 70% high purity HNO3 and 65% HClO4, 4:1 (v/v) was added to the beaker containing 2 g dry sample according to Mehdi et al, 2013). The mixture was then digested at 80 o C till a transparent solution was achieved. After cooling, the digested samples were filtered using Whatman no.42 filter paper and rinsed severally to ensure complete washing of the filter paper. The filtrate was diluted to 50 mL with redistilled water. Determination of the heavy metals in the filtrate of the fish organ digests was achieved by atomic absorption spectrophotometer (Shimadzu Model 6800 with graphite furnace Model GFA 7000, Hydride unit was used for determination of mercury). 2.2.2 Water The samples were preserved by adding 1.5 mL of conc. HNO3 to each 1 liter of sample and the pH adjusted to 2.0 by the use of pH meter. Nitric acid digestion was employed in accordance with APHA method (1998). 2.3 Elemental Analysis of Samples The resulting solutions were stored in sample bottles in the Chemistry Laboratory, Plateau State University Bokkos at room temperature before been taken to Engineering Laboratory of Abubakar Tafawa Balewa University (ATBU), Bauchi for the determination of Pb, Cd, Cr and Ni which were measured directly on each final solution using a 210 VGP (AAS) Scientific Atomic Absorption Spectrophotometer. 3.0 Results and Discussions The study was carried out to examine the concentration of elements in pond water and fish samples in Barkin-Ladi. Twenty samples were collected data are replicate of 3 for each element. And some were not detected. Mean results obtained were as given in tables 2, 3 and 4 for the water, Clarias gariepinus and Tilapia zili organs respectively. 3.1 Statistical analysis The normal statistical tolls were applied to the data to ascertain the degree of accuracy of analytical determinations. Also the raw data was subjected to a two-way ANOVA and Pearson correlation matric to understand the interaction and source of the heavy metal pollutants using SPSS statistical tool version 23. 3.2 Results and Discussion The average results obtained for the water and fish sample matrices were as given in tables 2, 3 and 4 for water, Clarias gariepinus and Tilapia zili fish organs respectively. Table 2: Mean concentration of elements for 20 sampling stations in water sample Parameter N Mean Std. Dev. As 19 0.061 ±0.031 Pb 20 0.109 ±0.060
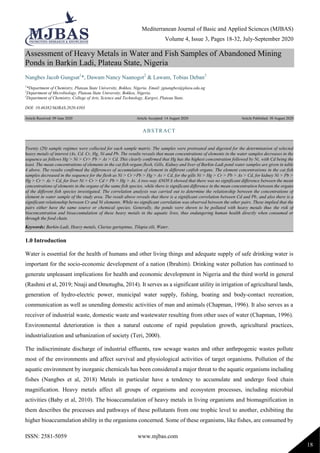
- 7. Mediterranean Journal of Basic and Applied Sciences (MJBAS) Volume 4, Issue 3, Pages 18-32, July-September 2020 ISSN: 2581-5059 www.mjbas.com 24 Cd 20 0.003 ±0.004 Ni 20 0.708 ±0.266 Cr 20 0.378 ±0.378 Hg 20 1.125 ±0.136 Table 2 reveals that mean concentrations of elements in the water samples decreases in the sequence as follows Hg > Ni > Cr> Pb > As > Cd, similar the the work reported by Udiba et al (2014). This clearly confirmed that Hg has the highest concentration followed by Ni, with Cd being the least. Fig.2 A plot of mean concentration of elements in water sample of Barkin-Ladi Mining Ponds Table 3: The mean concentrations of element for 20 sampling stations in different organs of Clarias gariepinus fish (Mean±SD) Parameter Flesh Gills Kidney Liver As 0.021±0.011 0.025±0.013 0.015±0.007 0.024±0.015 Cd 0.014±0.005 0.019±0.008 0.012±0.004 0.275±0.023 Cr 0.742±0.147 0.269±0.136 0.251±0.126 0.496±0.081 Hg 0.101±0.050 0.304±0.067 0.285±0.048 0.194±0.038 Ni 1.944±0.632 0.594±0.234 2.903±0.547 4.099±0.608 Pb 0.268±0.170 0.141±0.108 0.639±0.120 0.198±0.080 0 0.2 0.4 0.6 0.8 1 1.2 As Pb Cd Ni Cr Hg Meanconc.(mg/L) Elements
- 8. Mediterranean Journal of Basic and Applied Sciences (MJBAS) Volume 4, Issue 3, Pages 18-32, July-September 2020 ISSN: 2581-5059 www.mjbas.com 25 The mean concentrations of elements in the cat fish organs flesh, Gills, Kidney and liver of Barkin-Ladi pond water samples are given in table 4 above. The results confirmed the differences of accumulation of element in different catfish organs. The element concentrations in the cat fish samples decreased in the sequence for the flesh as Ni > Cr > Pb > Hg > As > Cd, for the gills Ni > Hg > Cr > Pb > As > Cd, for kidney Ni > Pb > Hg > Cr > As > Cd, for liver Ni > Cr > Cd > Pb > Hg > As. These trends concurred with other similar works (Nangbes et al, 2018; Udiba et al, 2014; Dahunsi et al, 2012; Adewale and Fawole, 2002). Fig.3 Mean concentration of elements among Cat fish organs samples from Barkin-Ladi Ponds Table 4: The mean concentrations of element in different organs of Tilapia zili fish from study area (Mean±SD) Parameter Flesh Gills Kidney Liver As 0.024±0.008 0.015±0.005 0.027±0.019 0.029±0.014 Cd 0.015±0.005 0.019±0.009 0.017±0.008 0.018±0.008 Cr 0.184±0.033 0.451±0.072 0.522±0.102 0.344±0.061 Hg 0.190±0.061 0.302±0.062 0.227±0.064 0.147±0.033 0 0.5 1 1.5 2 2.5 3 3.5 4 4.5 As Cd Cr Hg Ni Pb Meanconcentration(mg/Kg) Parameter Flesh Gills Kidney Liver
- 9. Mediterranean Journal of Basic and Applied Sciences (MJBAS) Volume 4, Issue 3, Pages 18-32, July-September 2020 ISSN: 2581-5059 www.mjbas.com 26 Ni 0.629±0.200 0.918±0.318 1.813±0.396 1.702±0.362 Pb 0.010±0.000 0.145±0.046 0.010±0.000 0.112±0.045 The mean concentrations of elements in the Tilapia zili fish organs flesh, Gills, Kidney and liver of Barkin-Ladi pond water samples are given in table 4 above. The element concentrations in the tilapia fish samples decreased in the sequence for the flesh as Ni > Hg > Cr > As > Cd > Pb for the gills Ni > Cr > Hg > Pb > Cd > As for kidney Ni > Cr > Hg > As > Cd > Pb, for liver Ni > Cr > Hg > Pb > As > Cd, thus agreeing with the works of other researchers (Nangbes et al, 2018, Ishak et al, 2014; Akan et al, 2012) Fig.4 Mean concentration of elements among Tilapia fish organs samples from Barkin-Ladi ponds 0 0.2 0.4 0.6 0.8 1 1.2 1.4 1.6 1.8 2 As Cd Cr Hg Ni Pb Meanconc.(mg/Kg) Parameter Flesh Gills Kidney Liver
- 10. Mediterranean Journal of Basic and Applied Sciences (MJBAS) Volume 4, Issue 3, Pages 18-32, July-September 2020 ISSN: 2581-5059 www.mjbas.com 27 Table 5: ANOVA for Cat Fish ANOVA Sum of Squares df Mean Square F Sig. As Between Groups 0.001 3 0 2.049 0.115 Within Groups 0.01 68 0 Total 0.011 71 Cd Between Groups 0.994 3 0.331 1949.6 0.000 Within Groups 0.012 72 0 Total 1.006 75 Cr Between Groups 3.189 3 1.063 67.828 0.000 Within Groups 1.191 76 0.016 Total 4.381 79 Hg Between Groups 0.523 3 0.174 64.445 0.000 Within Groups 0.206 76 0.003 Total 0.729 79 Ni Between Groups 132.176 3 44.059 157.03 0.000 Within Groups 21.324 76 0.281 Total 153.5 79 Pb Between Groups 3.022 3 1.007 65.49 0.000 Within Groups 1.169 76 0.015 Total 4.191 79
- 11. Mediterranean Journal of Basic and Applied Sciences (MJBAS) Volume 4, Issue 3, Pages 18-32, July-September 2020 ISSN: 2581-5059 www.mjbas.com 28 It can be seen from table 5 that there is no significant difference the mean of the results obtained within groups but there a significant difference between groups. This can be attributed to the difference in the bioaccumulation capacity of the organs as well as their physiology and micro environmental exposure rates to the heavy metals investigated. Table 6: ANOVA for Tilapia Fish ANOVA Sum of Squares Df Mean Square F Sig. As Between Groups 0.002 3 0.001 3.944 0.012 Within Groups 0.01 61 0 Total 0.012 64 Cd Between Groups 0 3 0 1.029 0.385 Within Groups 0.004 74 0 Total 0.004 77 Cr Between Groups 1.298 3 0.433 85.29 0 Within Groups 0.386 76 0.005 Total 1.684 79 Hg Between Groups 0.257 3 0.086 26.86 0 Within Groups 0.243 76 0.003 Total 0.5 79 Ni Between Groups 20.325 3 6.775 63.12 0 Within Groups 8.158 76 0.107 Total 28.483 79 Pb Between Groups 0.148 3 0.049 30.31 0 Within Groups 0.08 49 0.002 Total 0.227 52
- 12. Mediterranean Journal of Basic and Applied Sciences (MJBAS) Volume 4, Issue 3, Pages 18-32, July-September 2020 ISSN: 2581-5059 www.mjbas.com 29 Similarly for the tilapia fish, it can be seen from table 6 that there is no significant difference the mean of the results obtained within groups but there a significant difference between groups. This can be attributed to the difference in the bioaccumulation capacity of the organs as well as their physiology and microenvironmental exposure rates to the heavy metals investigated as well as the different feeding and foraging habitats (Huang et al, 2019). Table 7: Depict the correlation matrices of element pair in water sample of the present study Correlations AS Cd Cr Hg Ni Pb AS Pearson Correlation 1 -0.151 -0.101 -0.116 -0.118 -0.042 Sig. (2-tailed) 0.537 0.681 0.635 0.631 0.863 N 19 19 19 19 19 19 Cd Pearson Correlation -0.151 1 -0.085 .596 -0.432 .682* Sig. (2-tailed) 0.537 0.723 0.006 0.057 0.001 N 19 20 20 20 20 20 Cr Pearson Correlation -0.101 -0.085 1 -0.061 .606 0.205 Sig. (2-tailed) 0.681 0.723 0.798 0.005 0.386 N 19 20 20 20 20 20 Hg Pearson Correlation -0.116 .596 -0.061 1 -0.031 0.258 Sig. (2-tailed) 0.635 0.006 0.798 0.897 0.273 N 19 20 20 20 20 20 Ni Pearson Correlation -0.118 -0.432 .606 -0.031 1 -0.376 Sig. (2-tailed) 0.631 0.057 0.005 0.897 0.102 N 19 20 20 20 20 20 Pb Pearson Correlation -0.042 .682* 0.205 0.258 -0.376 1 Sig. (2-tailed) 0.863 0.001 0.386 0.273 0.102 N 19 20 20 20 20 20 *. Correlation is significant at the 0.05 level (2-tailed). The correlation analysis was carried out to determine the relationship between the concentrations of element in water sample of the study area. The result above reveals that there is a significant correlation between Cd and Pb, and also there is a significant relationship between Cr and Ni elements (Mensoor and Saaid, 2018). While no
- 13. Mediterranean Journal of Basic and Applied Sciences (MJBAS) Volume 4, Issue 3, Pages 18-32, July-September 2020 ISSN: 2581-5059 www.mjbas.com 30 significant correlation was observed between the other pairs. These implied that the pairs either have the same source of chemical species (Nangbes et al, 2019; Nangbes et al 2014; Ashraf et al, 2012 Generally, the ponds were shown to be polluted with heavy metals thus the risk of bioconcentration and bioaccumulation of these heavy metals in the aquatic lives, thus endangering human health directly when consumed or through the food chain. 4.0 Conclusion and Recommendation 4.1 Conclusion The research indicates that the abandoned tin mining ponds are somewhat polluted with toxic heavy metals which can bioaccumulate or bioconcentrate in aquatic lives. These metals are potential health hazards to the populace who use such pond water for agricultural purposes as a result of pollution. 4.2 Recommendation Generally, the ponds were shown to be polluted with heavy metals thus the risk of bioconcentration and bioaccumulation of these heavy metals in the aquatic lives, thus endangering human lives as result of their consumption. This calls for a bioremediation strategy to be undertaken on the ponds which are viable economic potentials for the production of fisheries. References Adedeji O.B. and Okocha R. C. (2011). Bioconcentration of heavy metals in prawns and water from Epe Lagoon and Asejire River in Southwest Nigeria. Journal of Applied Sciences in Environmental Sanitation, 6 (3): 377-384. Adepoju-Bello A. A., Alabi O. M. (2005). Heavy metals: A review. The Nig. J. Pharm.; 37: 41-45. Adewoye, S.O. and O.O. Fawole, (2002). Bioconcentration of metals in the tissue of Clarias gariepinus fingerlings exposed to lethal concentration of cassava Waste water. World J. Biotechnol., 3: 465-468. Agrawal S, Patel H M, Prakash I, & Patel A. (2016). Ground Water Quality Assessment of Vadodara District, Gujarat, India Using GIS. Journal of Groundwater Research; 5 (1):13-23. Akan, J. C., Mohmoud, S., Yikala, B. S. and Ogugbuaja, V. O. (2012). Bioaccumulation of Some Heavy Metals in Fish Samples from River Benue in Vinikilang, Adamawa State, Nigeria: American Journal of Analytical Chemistry, 3, 727-736. APHA, AWWA, WPCF. 1998 “Standard Methods for the Examination of Water and Wastewater.” American Public Health Association: Washington, DC. Armid A., Shinjo R., Ruslan R. and Fahmiati (2017). Distributions and pollution assessment of heavy metals Pb, Cd and Cr in the water system of Kendari Bay, Indonesia IOP Conf. Series: Mater. Science and Engineering 172. Ashraf M.A., Maah M.J., and Yusoff I. (2012). Chemical Speciation and Potential Mobility of Heavy Metals in the Soil of Former Tin Mining Catchment; The Scientific World Journal.
- 14. Mediterranean Journal of Basic and Applied Sciences (MJBAS) Volume 4, Issue 3, Pages 18-32, July-September 2020 ISSN: 2581-5059 www.mjbas.com 31 Baby J., Raj J. S., Biby E. T., Sankarganesh P., Jeevitha M.V., Ajisha S.U. and Rajan S. S. (2010). Toxic effect of heavy metals on aquatic environment; Int. J. Biol. Chem. Sci. 4 (4): 939-952. Bakare-Odunola M. T. (2005). Determination of some metallic impurities present in soft drinks marketed in Nigeria. The Nig. J. Pharm. 4 (1): 51-54. Dahunsi S.O., Oranusi S.U. and Ishola R.O. (2012). Bioaccumulation Pattern of Cadmium and Lead in the Head Capsule and Body Muscle of Clarias gariepinus [Burchell, 1822] Exposed to Paint Emulsion Effluent Research; Journal of Environmental and Earth Sciences 4 (2): 166-170. Hammer M. J. and Hammer M. J. Jr. (2004). Water quality. In: Water and Waste Water Technology. 5th Edn. New Jersey: Prentice-Hall. pp: 139-159. Huang, X., Qin, D, Lei Gao, Qirui Hao, Zhongxiang Chen, Peng Wang, Shizhan Tang, Song Wu, Haifeng Jiangb and Wei Qiu (2019). Distribution, contents and health risk assessment of heavy metal(loid)s in fish from different water bodies in Northeast China; Royal Society of Chemistry (RSC) Adv., 9, 33130–33139. Ibrahim S. I, Ajibade L.T (2012. Assessment of Water Quality and Domestic Uses in Medium sized Towns of Niger State, Nigeria. Transnational Journal of Science and Technology; 2 (5):63-75. Ishaq.Y. Habib, J. Na'aliya, Murtala Muhammad, Fahad I Danladi (2014). Analysis of Heavy Metals in Muscle Tissues of Tilapia Zilli of Gwale Pond, Kano State, Nigeria; International Journal of Scientific and Research Publications, Volume 4, Issue 9, 1. Kaushal, S. S., McDowell, W. H., Wollheim, W. M., Johnson, T. A. N., Mayer, P. M., Belt, K. T., Pennino, M. J. (2015). Urban evolution: the role of water, Water, 7, 4063–4087. Matsuo T. 2003. Japanese experiences of environmental management. Water Science and Technology, 47: 7-14. Mehdi Hosseini & Seyed Mohammad Bagher Nabavi & Yaghob Parsa (2013). Bioaccumulation of Trace Mercury in Trophic Levels of Benthic, Benthopelagic, Pelagic Fish Species, and Sea Birds from Arvand River, Iran; Biol Trace Elem Res. 156:175–180. Mensoor, M. and Said A. (2018). Determination of Heavy Metals in Freshwater Fishes of the Tigris River in Baghdad; Fishes 3 23 1 – 6. Nangbes J. G., Wufem B. M., Choji V. D., Sase J. T. Jaya G. N. (2019). Speciation of selected heavy metals in some abandoned mining pond sediments of Barkin-ladi Lga, plateau state Nigeria; International Journal of Advanced Chemistry Research Volume 1; Issue 1, 13-19. Nangbes J. G., Wufem B. M., Shamle N. J. and Nvau J. B. (2014). Concentration and Distribution of Inorganic Ions in Rainwater of Jos and Bukuru Metropolis, Plateau State, Nigeria IOSR Journal of Applied Chemistry (IOSR-JAC) Volume 7, Issue 7 Ver. III., PP 15-25. Nangbes, J. G., Sase, J. T., Lawam, T. D. (2018). Bioaccumulation and Risk Analysis of Heavy Metal Pollutants in Tilapia zilli and Clarias gariepinus Fish Species Found in Rivers Dilimi and Tudun Wada of Jos, Plateau State, Nigeria; Mediterranean Journal of Basic and Applied Sciences (MJBAS); Volume 2, Issue 3, Pages 127-135.
- 15. Mediterranean Journal of Basic and Applied Sciences (MJBAS) Volume 4, Issue 3, Pages 18-32, July-September 2020 ISSN: 2581-5059 www.mjbas.com 32 Nnaji J. C. and Omotugba S. (2014. Physico-chemical Quality of Drinking Water in New Bussa, Niger State, Nigeria International Research Journal of Pure & Applied Chemistry 4 (4): 437-446. Rashmi T., Rita K., Nirmal K., Dharitri R. (2019). Physicochemical analysis of selected groundwater samples of Anand District, Gujarat, India American International Journal of Research in Formal, Applied & Natural Sciences 26 (1), pp. 54-59. Udiba U. U., Gauje Balli, Odey M. O., Umar S. M., Ashade N. O., Odeke E. H., Mukhtar Bala and Dawaki S. I. (2014). Contaminants Levels of African Cat Fish (Clarias gariepinus) Tissues: A Comparative Study of River Galma, River Kubanni and Fish Farms in Zaria, Nigeria, Merit Research Journal of Environmental Science and Toxicology 2 (8) pp. 156-166.