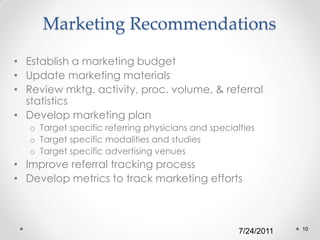
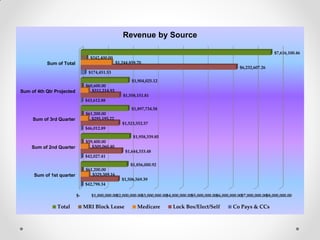
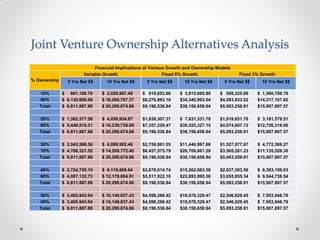
Radiology Practice Analysis
   Observations, Analyses, and
       Recommendations
Table of Contents
• Imaging Center Initial Observations

• Procedure Volume Analysis

• Capacity and Utilization Analyses

• Billing and Collections Analysis

• Financial Analyses

• Marketing and Referrals Analysis

• Physicians’ Productivity Analysis

                                                    2
                                        7/24/2011
Imaging Center
   Operations

Initial Observations


                7/24/2011   3
Observations           - Marketing
• No formal marketing plan exists.
• No marketing budget exists.
• Marketing efforts have been limited of late.
• Marketing information is fragmented and difficult to
  compile and analyze.
• Marketing materials need to be refreshed and re-
  stocked.


                                                         4
                                           7/24/2011
Observations – Strategic Initiatives
            Hospital Joint Venture

• Information needs to flow more freely.
• Detailed financial analysis is required before moving
  forward.
• Organizational and legal structures require analysis.
• Identification and analysis of alternative business
  models is required.
• Blueprint for the future needs to be developed.


                                                          5
                                           7/24/2011
Observations – Accounting & Finance

• A/P and basic accounting functions appear to be
  functioning efficiently and effectively.
• No formal budgeting process exists.
• Policies need to be enhanced and communicated.
• Financial controls need to be reviewed and
  improved where necessary. (Purchasing)
• Financial information silos exist.
• Financial analysis is difficult due to information access
  constraints.
• Remote accounting function poses logistics and
  control issues.


                                                          6
                                             7/24/2011
Observations - Billing
• It appears the billing operation is operating effectively
  despite lack of automation.
• Collections as % of charges outperform industry
  standards.
• Billing reports are limited in scope and content.
   o A/R reports are rudimentary
   o Lack of detail by modality, carrier, and study
• Billing and collections metrics are non existent.
• Collections performance warrants scrutiny.
   o Collection % and A/R performance seem high by industry
     standards. (Could be due to a high write off %)
• No denial management mechanism is evident.
• Lack of automated billing interfaces may be a cause
  for concern. (Charge collection process is a manual
  one.)


                                                                  7
                                                      7/24/2011
Observations - Operations
• Procedure volume up in all modalities vs. prior year.
• Most modalities have excess capacity.
• Scheduling/front desk systems & processes require
  review & analysis. (6Σ)
• Phone system/scheduling processes requires scrutiny.
• RAD report delivery process could be improved. (use
  of website and RIS/PACS)
• Ongoing staffing issues need to be addressed.
 • Duplicate techs in MR and CT


                                                      8
                                          7/24/2011
Observations – Information Technology
• RIS system lacks functionality.
   o Inadequate management reporting capability.
   o Lack of metrics and analytical capability.
   o No interface to billing. (manual)
• Website needs to be updated & refreshed.
• Easier exchange of information via e-mail, shared
  directories & schedules is needed.
• Current PC hardware requires upgrade.
• Analytical and management applications are non
  existent.


                                                      9
                                          7/24/2011
Marketing Recommendations

• Establish a marketing budget
• Update marketing materials
• Review mktg. activity, proc. volume, & referral
  statistics
• Develop marketing plan
   o Target specific referring physicians and specialties
   o Target specific modalities and studies
   o Target specific advertising venues
• Improve referral tracking process
• Develop metrics to track marketing efforts


                                                                 10
                                                     7/24/2011
Strategic Initiatives Recommendations
• Obtain financial information from hospital
  o RAD billing and collections by modality, provider,
    and procedure
  o Pro forma financials for JV
• Develop alternative JV business models
  o Legal model
  o Financial model
  o Operating model
• Perform analysis of various alternatives &
  make recommendations


                                                         11
                                           7/24/2011
Finance & Accounting Recommendations
• Develop annual budget process
• Review current processes and controls
 • Evaluate and modify if necessary
• Develop periodic reporting mechanisms
• Obtain financial accounting system access
  in remote locations
• Develop cash flow, revenue, expense, etc.
  metrics
• Develop an activity based costing model
• Move the accounting function to the
  operations center

                                                  12
                                      7/24/2011
Billing Recommendations
• Develop billing & collections metrics

• Work with billing company to improve reporting
  process

• Develop mechanism to monitor denials

• Develop periodic billing audit process


                                                       13
                                           7/24/2011
Operations Recommendations
• Review front desk operations
  o Evaluate current procedures
  o Evaluate operational performance (6Σ)
  o Develop call metrics and standards
• Develop capacity & utilization matrix &
  monitoring process by modality
• Evaluate optimum staffing model
• Evaluate phone system capabilities
  o Meet with telecom to evaluate options
  o Improve telephone capabilities if warranted
• Evaluate IR Front Desk & Operational
  Procedures

                                                     14
                                         7/24/2011
Information Technology Recommendations

• Update websites
• Update PC hardware and software
• Improve information delivery, aggregation, and
  delivery capabilities
• Obtain managerial and analytical software
• Meet with IS vendors. to evaluate enhanced
  capabilities


                                                      15
                                          7/24/2011
YTD Procedure Volume Analysis


                                16
Daily Procedures (M - F)


165.00
                                                                                                   162.30

160.00

                                                                                 155.15
155.00
                                                               151.78                     151.73            151.39
                                    150.32            149.68
150.00

                  145.51
         144.38
145.00
                                                                        141.93
                                             141.16
140.00                     139.17


135.00


130.00


125.00
         JAN       FEB     MAR      APR      MAY      JUN       JUL     AUG       SEP     OCT      NOV      DEC
Monthly Volume Comparison
                              2007 Mthly Vol.         2008 Mthly Vol.             2009 Mthly Vol.            Linear (2009 Mthly Vol.)

4,000


                                                                                                                               3,547
3,500                                            3,406                                 3,439                      3,416
                                                                          3,393                                              3,334
                                     3,225                                                                     3,202                        3,201
            3,156       3,067                                                        3,141           3,148                                               3,158
                                             3,263
                                                                                                                          3,076
          2,998                                               3,020     3,009                                                                          2,989
3,000                 2,957
                                  2,821                                                                                                 2,784
                                                         2,706                                                                               2,752
                                                                                               2,667
        2,587                                         2,682           2,573
                                2,528                                             2,529           2,558      2,523
                                             2,514
2,500                                                                                                                                                2,402


                    2,091

2,000


1,500
          JAN         FEB         MAR           APR       MAY           JUN           JUL           AUG         SEP         OCT           NOV          DEC
% Growth in Procedure Volume
50.00%
          45.88%


40.00%


30.00%

                                                                23.62%


20.00%
                             15.25%


                                               9.72%
10.00%


 0.00%
         2007 v 2006        2008 v 2007      2009 v 2008   Annualized Growth
YTD Highest Growth Areas
              Modality              2009 Growth Rate
PET CT                                  25.84%
Ultrasound                              24.17%
MRI Imaging Center                      10.03%
Total MRI (includes leased slots)        8.02%
Mammo                                    7.58%
CT                                       7.31%
Overall YTD Growth vs. Prior Year        10.09%


                                                       20
Projected Growth
50.00% 45.88%
45.00%
40.00%
35.00%
30.00%
25.00%
20.00%
            15.25%
15.00%
                 10.05%11.06% 9.52% 8.70%
10.00%                                    8.00% 7.41% 6.90% 8.80%
5.00%
0.00%


                                                                    21
General Observations
• Procedure volume growth continues at a significant
  pace.

• Annual growth rate projected at 10.05%

• Annualized growth since inception = 23.73%

• Regression analysis projects continued growth


                                                       22
Analysis
• Current month procedure volume declined from
  prior month due primarily to:
   o Holiday
   o Power outage
   o Only 22 work days

• PET CT and Ultrasound continue to exceed the
  average growth rate.
• Women’s imaging continues to be a high growth
  area.
• Long term trend analysis predicts continued growth
  through 2015


                                                       23
Conclusions
• Outpatient imaging continues to be a growth area.

• Additional time slots for MRI, PET, and women’s
  imaging would most likely be profitable.

• Marketing efforts should be focused on Women’s
  Imaging, IR, and the Vein Center as well as
  traditional high tech modalities and studies.


                                                      24
Capacity & Utilization
      Analysis
US Capacity & Utilization
                      Capacity Avg. No. Avg. No.     %      Excess Avg. $$                                   Gross
              Room                                                          Daily           No.   Cost of
                       (Avail.    of       of    Utilizatio Capacit  per                                      Profit
              Times                                                        Revenue         FTEs    FTEs
                       Slots) Patients Studies        n       y     Study                                    (Loss)
  US 1
         Mon 8 - 4       16        15.40    23.50    96%      0.60 $   102.26 $ 2,403.11    2.0   $ 761.85 $1,641.26
         Tue 9 - 8       22         8.50    14.17    39%     13.50 $   102.26 $ 1,448.68    2.0   $ 761.85 $ 686.83
         Wed 8 - 8       24        12.25    16.21    51%     11.75 $   102.26 $ 1,658.07    1.5   $ 609.48 $1,048.59
         Thur 8 - 4      16        11.50    16.71    72%      4.50 $   102.26 $ 1,709.20    1.5   $ 609.48 $1,099.72
         Fri 8 - 4       16         7.50    10.00    47%      8.50 $   102.26 $ 1,022.60    1.0   $ 406.32 $ 616.28
         Sat 8 - 4       16         6.20     8.50    39%      9.80 $   102.26 $   869.21    1.0   $ 406.32 $ 462.89
         Totals         110        61.35    89.10   55.77%   48.65            $ 9,110.88          $3,555.30 $5,555.58
  US 2
         Wed 1 - 4       8           7.5      7.5    94%      0.50 $   102.26 $   766.95    0.5   $ 330.14 $ 436.82
         Thur 1 - 4      8          1.00     1.00    13%      7.00 $   102.26 $   102.26    0.5   $ 330.14 $ (227.88)
         Totals          16          8.5      8.5   53.13%    7.50            $   869.21          $ 660.27 $ 208.94
Grand Total             126        69.85    97.60            56.15            $ 9,980.09          $4,215.57 $5,764.52
Annual CT Volume by Day

600
                                     536

                                                             497

500
            431                                  427
                        394

400


300                                                                      246


200


100


  0
      Mon         Tue          Wed         Thu         Fri         Sat
Daily Average CT Studies
17


16                    15.64

15
                                          14.36
14


13
      12.20
12
                                                                       12.22
              12.08             12.00
11


10


 9


 8


 7                                                       7.03

 6
     Mon      Tue     Wed      Thu       Fri       Sat          Weekly Total
Billing and Collections
        Analysis
YTD Billings and Receipts
$1,600,000


                                                                                                         $1,396,119
$1,400,000              $1,349,566


$1,200,000

                                                                  $1,055,011

$1,000,000


 $800,000

                                                                                                                          $624,562
                                         $559,028                               $530,102
 $600,000


 $400,000


 $200,000


       $-
                                January                                  February                                 March

             Billings         Receipts        Linear (Billings)      Linear (Billings)     Linear (Receipts)      Linear (Receipts)
% Change Current Month vs. Prior Year Month

              11.38%
12.00%


10.00%


8.00%
                                                            Procedures
                                                            Billings
6.00%
                                                   4.50%    Receipts


                                  3.48%
4.00%


2.00%


0.00%
         Procedures         Billings         Receipts
Aetna
                                            2010 Payer Mix                             USHC
                            0.34%                                                      HMO
                  RAYTEL
                   0.22%                                     0.02%       0.23%         5.97%

                                                                         Aetna PPO
                                                                           6.76%
                                                                                 Amerihealth HMO
                                                                                      0.21%
             One Call
                                   Personal Choice                                 Amerihealth PPO
              0.28%
                                       17.28%                                          6.42%
        Motor Vechile
           1.30%


                                                                         Blue Shield
                        Medicare                                           13.47%
                         17.32%


                                                                                 Bravo Health
                                                                                    0.45%

                                                                             Crozer Aetna Capitation
        Keystone Health Plan East                                                    6.26%
                 6.14%
Keystone Mercy                                                    Crozer Keystone
    0.00%      Healthpartners                                       Capitation
                    0.00%      Evercare    Coventry   Commericial      9.66%      Cigna
                                0.42%       0.39%       4.97%                     1.89%
Financial Analyses
YTD Actual and Projected Revenue by Quarter

                       $1,958,339.85


                                                             $1,904,025.12
                                         $1,897,734.58


$1,856,000.92


 1st quarter            2nd Quarter      3rd Quarter     4th Qtr Projected
Revenue by Source

                                                                                                                                 $7,616,100.46
                                   $242,400.00
           Sum of Total                           $1,244,859.70
                                                                                                                $6,232,607.26
                                  $174,451.53
                                                          $1,904,025.12
                                 $60,600.00
Sum of 4th Qtr Projected            $311,214.93
                                                     $1,558,151.81
                                $43,612.88
                                                          $1,897,734.58
                                 $61,200.00
     Sum of 3rd Quarter             $295,195.22
                                                     $1,523,552.57
                                $46,012.89
                                                           $1,958,339.85
                                 $59,400.00
    Sum of 2nd Quarter              $309,060.40
                                                       $1,644,333.48
                                $42,027.41
                                                         $1,856,000.92
                                 $61,200.00
     Sum of 1st quarter             $329,389.16
                                                     $1,506,569.39
                                $42,798.34

                           $-      $1,000,000.00$2,000,000.00$3,000,000.00$4,000,000.00$5,000,000.00$6,000,000.00$7,000,000.00$8,000,000.00

                Total           MRI Block Lease              Medicare        Lock Box/Elect/Self            Co Pays & CCs
MRI Center Profitability Analysis
                                              Avg.
                                Studies
      2010 Projected                      Reimbursement                          Projected Profit
                                                            Expenses

                                 1997            $575.76
                                                                           With RAD          W/O RAD
Projected Revenue:                $          1,149,509.04

Actual Expenses w/o RAD                                     $583,221.28    $1,149,509.04   $ 1,149,509.04

Accounting Expense                                          $   7,860.95

Bank Charges                                                $   3,000.00

Business Liability Insurance                                $   3,000.00

Radiologist Expense (1/2 FTE)                               $271,465.23    $ 868,547.45    $    597,082.23

Total Expenses w/RAD                                        $868,547.45

Gross Profit w & w/o RAD                                                   $ 280,961.59    $    552,426.81

Gross Profit Margin (EBIDTA)                                                        24%                48%
Joint Venture Ownership Alternatives Analysis
                            Financial Implications of Various Growth and Ownership Models
                       Variable Growth                      Fixed 8% Growth                 Fixed 3% Growth
% Ownership     5 Yrs Net $$     10 Yrs Net $$     5 Yrs Net $$     10 Yrs Net $$     5 Yrs Net $$     10 Yrs Net $$

   10%        $ 681,188.79     $ 2,029,967.49    $ 919,653.68     $ 3,815,665.89    $ 509,325.89     $ 1,590,789.76
   90%        $ 6,130,699.09   $ 18,269,707.37   $8,276,883.16    $34,340,993.04    $4,583,933.02    $14,317,107.82
   Total      $ 6,811,887.88   $ 20,299,674.86   $9,196,536.84    $38,156,658.94    $5,093,258.91    $15,907,897.57

   20%        $ 1,362,377.58   $ 4,059,934.97    $1,839,307.37    $ 7,631,331.79    $1,018,651.78    $ 3,181,579.51
   80%        $ 5,449,510.31   $ 16,239,739.89   $7,357,229.47    $30,525,327.15    $4,074,607.12    $12,726,318.06
   Total      $ 6,811,887.88   $ 20,299,674.86   $9,196,536.84    $38,156,658.94    $5,093,258.91    $15,907,897.57

   30%        $ 2,043,566.36   $ 6,089,902.46    $2,758,961.05    $11,446,997.68    $1,527,977.67    $ 4,772,369.27
   70%        $ 4,768,321.52   $ 14,209,772.40   $6,437,575.79    $26,709,661.26    $3,565,281.23    $11,135,528.30
   Total      $ 6,811,887.88   $ 20,299,674.86   $9,196,536.84    $38,156,658.94    $5,093,258.91    $15,907,897.57

   40%        $ 2,724,755.15   $ 8,119,869.94    $3,678,614.74    $15,262,663.58    $2,037,303.56    $ 6,363,159.03
   60%        $ 4,087,132.73   $ 12,179,804.91   $5,517,922.10    $22,893,995.36    $3,055,955.34    $ 9,544,738.54
   Total      $ 6,811,887.88   $ 20,299,674.86   $9,196,536.84    $38,156,658.94    $5,093,258.91    $15,907,897.57

   50%        $ 3,405,943.94   $ 10,149,837.43   $4,598,268.42    $19,078,329.47    $2,546,629.45    $ 7,953,948.79
   50%        $ 3,405,943.94   $ 10,149,837.43   $4,598,268.42    $19,078,329.47    $2,546,629.45    $ 7,953,948.79
   Total      $ 6,811,887.88   $ 20,299,674.86   $9,196,536.84    $38,156,658.94    $5,093,258.91    $15,907,897.57
Marketing & Referrals
     Analysis
Referrals by Quarter
            8,100
                                                                                                             7,966        7,986
                                                                                               7,918
            7,900

                                                      7,772                       7,703
            7,700


            7,500                       7,515
Referrals


                                                                    7,459

            7,300


            7,100


            6,900


                          6,737
            6,700


            6,500
                    2007 Q 4      2008 Q 1      2008 Q 2      2008 Q 3      2008 Q 4      2009 Q 1     2009 Q 2      2009 Q 3
Top 20 Referring Physicians - 1st Qtr to Prior Yr 1st Qtr
350     336
      329
           319                                      QTR 1 - 09        QTR 1 - 10
             308
300                 283
                        271
                  263

250                             231
                              225
                                    200
                        191              192
200                                   181                        183
                                              175 168 179 170
                                           153
                                                167 170 143          141    137
150                                                         131          125                                   124           121
                                                               106 99 103         103
100                                                                           88 91 8793                             85
                                                                                                                       76
                                                                                                              54
 50                                                                                                                         37


 -
       REF   REF   REF   REF   REF   REF   REF   REF   REF    REF   REF   REF   REF   REF   REF   REF   REF   REF    REF    REF
      DOC 1 DOC 2 DOC 3 DOC 4 DOC 5 DOC 6 DOC 7 DOC 8 DOC 9   DOC   DOC   DOC   DOC   DOC   DOC   DOC   DOC   DOC    DOC    DOC
                                                               10    11    12    13    14    15    16    17    18     19     20
Ref. Phys. Office Visits
Referrals Increased       158   74.88%


Referrals Decreased        50   23.70%


No change                   3    1.42%


Total Physcians Visited   211   100.00%
Physicians’ productivity
       Analysis
Physicians Productivity by RVU & Proc. Vol.
35,000
                                                   FY 2009 Physicians' Productivity
                                                                                                                           31,340
  35,000                                                                                                                                                  33,180
30,000                                                                                                            31,340

  30,000                                                 29,219


25,000
  25,000

                                                                                                                                                              20,159
  20,000
20,000


  15,000
15,000

  10,000
                6,532
10,000
   5,000


 5,000 0
                                                                  KR


                                                                                                                      BT


                                                                                                                                                    KM
                                                                                                                                                         JM
                                                                                                                                                              LB
                          EJ


                                    JS


                                              IW


                                                                            KN


                                                                                       JH


                                                                                                  LC


                                                                                                                 JK


                                                                                                                                ER
                                                                                                                                     JB
                                         PS


                                                   SG


                                                                                 JH2


                                                                                                       SS
                               AG


                                                                       CK


                                                                                                                                          CB
           (blank)


                                                                                            AW


                                                                                                            AF


                                                                                                                                               DS
                     HH


                                                        HR


                                                                                                                           GS
                                                             RT


    -

                                                        Sum of Procedures              Sum of Work RVU


                                                             Sum of Procedures                   Sum of Work RVU
Practice Statistics
   Physician
               Days Worked   RVU/Day     Procs/Day Revenue/Day
  Productivity

Total             4,347.20    1,398.75    1,857.21   $   69,676.14

Minimum             99.50       39.74       44.08    $    1,949.30

Median             183.00       53.57       76.51    $    2,764.62

Maximum            210.00       80.21      119.14    $    3,411.30

Average per FTE    193.21       62.17       82.54    $    3,096.72
Industry Comparison
                                                 Six Months Data
                             Days      SERL
         Physician                            Work RVU RVU/Day Procedures Procs/Day Total Revenue         Revenue/Day
                            Worked     FTEs

Total                       4,347.20    25.50 244,707.81 1,398.75 318,196.00    1,857.21 $12,117,877.32    $   69,676.14
Arithmetic Mean              173.89             9,788.31    55.95   12,727.84     74.29 $    484,715.09    $    2,787.05
Median                       183.00            10,133.34    53.57   12,049.00     76.51 $    502,499.71    $    2,764.62
Minimum Value                 99.50             4,232.31    39.74    6,084.00     44.08 $    207,600.58    $    1,949.30
Maximum Value                210.00            13,756.17    80.21   20,624.00    119.14 $    651,814.06    $    3,411.30
Average per FTE              193.21            10,875.90    62.17   14,142.04     82.54 $    538,572.33    $    3,096.72
Industry Standard per FTE                       7,136.00             9,671.00
         Variance %                              34.39%              31.62%
RVUs Per FTE Comparison


                                                      14,142
16,000.00


14,000.00
            10,876
12,000.00
                                                                    9,671

10,000.00
                       7,136

 8,000.00

                                                                            4,471
 6,000.00                        3,740


 4,000.00


 2,000.00


       -
              Work RVUS                                     Procedures

                          SERL   Industry Std.   Variance

Practice Management Presentation

  • 1.
    Radiology Practice Analysis Observations, Analyses, and Recommendations
  • 2.
    Table of Contents •Imaging Center Initial Observations • Procedure Volume Analysis • Capacity and Utilization Analyses • Billing and Collections Analysis • Financial Analyses • Marketing and Referrals Analysis • Physicians’ Productivity Analysis 2 7/24/2011
  • 3.
    Imaging Center Operations Initial Observations 7/24/2011 3
  • 4.
    Observations - Marketing • No formal marketing plan exists. • No marketing budget exists. • Marketing efforts have been limited of late. • Marketing information is fragmented and difficult to compile and analyze. • Marketing materials need to be refreshed and re- stocked. 4 7/24/2011
  • 5.
    Observations – StrategicInitiatives Hospital Joint Venture • Information needs to flow more freely. • Detailed financial analysis is required before moving forward. • Organizational and legal structures require analysis. • Identification and analysis of alternative business models is required. • Blueprint for the future needs to be developed. 5 7/24/2011
  • 6.
    Observations – Accounting& Finance • A/P and basic accounting functions appear to be functioning efficiently and effectively. • No formal budgeting process exists. • Policies need to be enhanced and communicated. • Financial controls need to be reviewed and improved where necessary. (Purchasing) • Financial information silos exist. • Financial analysis is difficult due to information access constraints. • Remote accounting function poses logistics and control issues. 6 7/24/2011
  • 7.
    Observations - Billing •It appears the billing operation is operating effectively despite lack of automation. • Collections as % of charges outperform industry standards. • Billing reports are limited in scope and content. o A/R reports are rudimentary o Lack of detail by modality, carrier, and study • Billing and collections metrics are non existent. • Collections performance warrants scrutiny. o Collection % and A/R performance seem high by industry standards. (Could be due to a high write off %) • No denial management mechanism is evident. • Lack of automated billing interfaces may be a cause for concern. (Charge collection process is a manual one.) 7 7/24/2011
  • 8.
    Observations - Operations •Procedure volume up in all modalities vs. prior year. • Most modalities have excess capacity. • Scheduling/front desk systems & processes require review & analysis. (6Σ) • Phone system/scheduling processes requires scrutiny. • RAD report delivery process could be improved. (use of website and RIS/PACS) • Ongoing staffing issues need to be addressed. • Duplicate techs in MR and CT 8 7/24/2011
  • 9.
    Observations – InformationTechnology • RIS system lacks functionality. o Inadequate management reporting capability. o Lack of metrics and analytical capability. o No interface to billing. (manual) • Website needs to be updated & refreshed. • Easier exchange of information via e-mail, shared directories & schedules is needed. • Current PC hardware requires upgrade. • Analytical and management applications are non existent. 9 7/24/2011
  • 10.
    Marketing Recommendations • Establisha marketing budget • Update marketing materials • Review mktg. activity, proc. volume, & referral statistics • Develop marketing plan o Target specific referring physicians and specialties o Target specific modalities and studies o Target specific advertising venues • Improve referral tracking process • Develop metrics to track marketing efforts 10 7/24/2011
  • 11.
    Strategic Initiatives Recommendations •Obtain financial information from hospital o RAD billing and collections by modality, provider, and procedure o Pro forma financials for JV • Develop alternative JV business models o Legal model o Financial model o Operating model • Perform analysis of various alternatives & make recommendations 11 7/24/2011
  • 12.
    Finance & AccountingRecommendations • Develop annual budget process • Review current processes and controls • Evaluate and modify if necessary • Develop periodic reporting mechanisms • Obtain financial accounting system access in remote locations • Develop cash flow, revenue, expense, etc. metrics • Develop an activity based costing model • Move the accounting function to the operations center 12 7/24/2011
  • 13.
    Billing Recommendations • Developbilling & collections metrics • Work with billing company to improve reporting process • Develop mechanism to monitor denials • Develop periodic billing audit process 13 7/24/2011
  • 14.
    Operations Recommendations • Reviewfront desk operations o Evaluate current procedures o Evaluate operational performance (6Σ) o Develop call metrics and standards • Develop capacity & utilization matrix & monitoring process by modality • Evaluate optimum staffing model • Evaluate phone system capabilities o Meet with telecom to evaluate options o Improve telephone capabilities if warranted • Evaluate IR Front Desk & Operational Procedures 14 7/24/2011
  • 15.
    Information Technology Recommendations •Update websites • Update PC hardware and software • Improve information delivery, aggregation, and delivery capabilities • Obtain managerial and analytical software • Meet with IS vendors. to evaluate enhanced capabilities 15 7/24/2011
  • 16.
  • 17.
    Daily Procedures (M- F) 165.00 162.30 160.00 155.15 155.00 151.78 151.73 151.39 150.32 149.68 150.00 145.51 144.38 145.00 141.93 141.16 140.00 139.17 135.00 130.00 125.00 JAN FEB MAR APR MAY JUN JUL AUG SEP OCT NOV DEC
  • 18.
    Monthly Volume Comparison 2007 Mthly Vol. 2008 Mthly Vol. 2009 Mthly Vol. Linear (2009 Mthly Vol.) 4,000 3,547 3,500 3,406 3,439 3,416 3,393 3,334 3,225 3,202 3,201 3,156 3,067 3,141 3,148 3,158 3,263 3,076 2,998 3,020 3,009 2,989 3,000 2,957 2,821 2,784 2,706 2,752 2,667 2,587 2,682 2,573 2,528 2,529 2,558 2,523 2,514 2,500 2,402 2,091 2,000 1,500 JAN FEB MAR APR MAY JUN JUL AUG SEP OCT NOV DEC
  • 19.
    % Growth inProcedure Volume 50.00% 45.88% 40.00% 30.00% 23.62% 20.00% 15.25% 9.72% 10.00% 0.00% 2007 v 2006 2008 v 2007 2009 v 2008 Annualized Growth
  • 20.
    YTD Highest GrowthAreas Modality 2009 Growth Rate PET CT 25.84% Ultrasound 24.17% MRI Imaging Center 10.03% Total MRI (includes leased slots) 8.02% Mammo 7.58% CT 7.31% Overall YTD Growth vs. Prior Year 10.09% 20
  • 21.
    Projected Growth 50.00% 45.88% 45.00% 40.00% 35.00% 30.00% 25.00% 20.00% 15.25% 15.00% 10.05%11.06% 9.52% 8.70% 10.00% 8.00% 7.41% 6.90% 8.80% 5.00% 0.00% 21
  • 22.
    General Observations • Procedurevolume growth continues at a significant pace. • Annual growth rate projected at 10.05% • Annualized growth since inception = 23.73% • Regression analysis projects continued growth 22
  • 23.
    Analysis • Current monthprocedure volume declined from prior month due primarily to: o Holiday o Power outage o Only 22 work days • PET CT and Ultrasound continue to exceed the average growth rate. • Women’s imaging continues to be a high growth area. • Long term trend analysis predicts continued growth through 2015 23
  • 24.
    Conclusions • Outpatient imagingcontinues to be a growth area. • Additional time slots for MRI, PET, and women’s imaging would most likely be profitable. • Marketing efforts should be focused on Women’s Imaging, IR, and the Vein Center as well as traditional high tech modalities and studies. 24
  • 25.
  • 26.
    US Capacity &Utilization Capacity Avg. No. Avg. No. % Excess Avg. $$ Gross Room Daily No. Cost of (Avail. of of Utilizatio Capacit per Profit Times Revenue FTEs FTEs Slots) Patients Studies n y Study (Loss) US 1 Mon 8 - 4 16 15.40 23.50 96% 0.60 $ 102.26 $ 2,403.11 2.0 $ 761.85 $1,641.26 Tue 9 - 8 22 8.50 14.17 39% 13.50 $ 102.26 $ 1,448.68 2.0 $ 761.85 $ 686.83 Wed 8 - 8 24 12.25 16.21 51% 11.75 $ 102.26 $ 1,658.07 1.5 $ 609.48 $1,048.59 Thur 8 - 4 16 11.50 16.71 72% 4.50 $ 102.26 $ 1,709.20 1.5 $ 609.48 $1,099.72 Fri 8 - 4 16 7.50 10.00 47% 8.50 $ 102.26 $ 1,022.60 1.0 $ 406.32 $ 616.28 Sat 8 - 4 16 6.20 8.50 39% 9.80 $ 102.26 $ 869.21 1.0 $ 406.32 $ 462.89 Totals 110 61.35 89.10 55.77% 48.65 $ 9,110.88 $3,555.30 $5,555.58 US 2 Wed 1 - 4 8 7.5 7.5 94% 0.50 $ 102.26 $ 766.95 0.5 $ 330.14 $ 436.82 Thur 1 - 4 8 1.00 1.00 13% 7.00 $ 102.26 $ 102.26 0.5 $ 330.14 $ (227.88) Totals 16 8.5 8.5 53.13% 7.50 $ 869.21 $ 660.27 $ 208.94 Grand Total 126 69.85 97.60 56.15 $ 9,980.09 $4,215.57 $5,764.52
  • 27.
    Annual CT Volumeby Day 600 536 497 500 431 427 394 400 300 246 200 100 0 Mon Tue Wed Thu Fri Sat
  • 28.
    Daily Average CTStudies 17 16 15.64 15 14.36 14 13 12.20 12 12.22 12.08 12.00 11 10 9 8 7 7.03 6 Mon Tue Wed Thu Fri Sat Weekly Total
  • 29.
  • 30.
    YTD Billings andReceipts $1,600,000 $1,396,119 $1,400,000 $1,349,566 $1,200,000 $1,055,011 $1,000,000 $800,000 $624,562 $559,028 $530,102 $600,000 $400,000 $200,000 $- January February March Billings Receipts Linear (Billings) Linear (Billings) Linear (Receipts) Linear (Receipts)
  • 31.
    % Change CurrentMonth vs. Prior Year Month 11.38% 12.00% 10.00% 8.00% Procedures Billings 6.00% 4.50% Receipts 3.48% 4.00% 2.00% 0.00% Procedures Billings Receipts
  • 32.
    Aetna 2010 Payer Mix USHC 0.34% HMO RAYTEL 0.22% 0.02% 0.23% 5.97% Aetna PPO 6.76% Amerihealth HMO 0.21% One Call Personal Choice Amerihealth PPO 0.28% 17.28% 6.42% Motor Vechile 1.30% Blue Shield Medicare 13.47% 17.32% Bravo Health 0.45% Crozer Aetna Capitation Keystone Health Plan East 6.26% 6.14% Keystone Mercy Crozer Keystone 0.00% Healthpartners Capitation 0.00% Evercare Coventry Commericial 9.66% Cigna 0.42% 0.39% 4.97% 1.89%
  • 33.
  • 34.
    YTD Actual andProjected Revenue by Quarter $1,958,339.85 $1,904,025.12 $1,897,734.58 $1,856,000.92 1st quarter 2nd Quarter 3rd Quarter 4th Qtr Projected
  • 35.
    Revenue by Source $7,616,100.46 $242,400.00 Sum of Total $1,244,859.70 $6,232,607.26 $174,451.53 $1,904,025.12 $60,600.00 Sum of 4th Qtr Projected $311,214.93 $1,558,151.81 $43,612.88 $1,897,734.58 $61,200.00 Sum of 3rd Quarter $295,195.22 $1,523,552.57 $46,012.89 $1,958,339.85 $59,400.00 Sum of 2nd Quarter $309,060.40 $1,644,333.48 $42,027.41 $1,856,000.92 $61,200.00 Sum of 1st quarter $329,389.16 $1,506,569.39 $42,798.34 $- $1,000,000.00$2,000,000.00$3,000,000.00$4,000,000.00$5,000,000.00$6,000,000.00$7,000,000.00$8,000,000.00 Total MRI Block Lease Medicare Lock Box/Elect/Self Co Pays & CCs
  • 36.
    MRI Center ProfitabilityAnalysis Avg. Studies 2010 Projected Reimbursement Projected Profit Expenses 1997 $575.76 With RAD W/O RAD Projected Revenue: $ 1,149,509.04 Actual Expenses w/o RAD $583,221.28 $1,149,509.04 $ 1,149,509.04 Accounting Expense $ 7,860.95 Bank Charges $ 3,000.00 Business Liability Insurance $ 3,000.00 Radiologist Expense (1/2 FTE) $271,465.23 $ 868,547.45 $ 597,082.23 Total Expenses w/RAD $868,547.45 Gross Profit w & w/o RAD $ 280,961.59 $ 552,426.81 Gross Profit Margin (EBIDTA) 24% 48%
  • 37.
    Joint Venture OwnershipAlternatives Analysis Financial Implications of Various Growth and Ownership Models Variable Growth Fixed 8% Growth Fixed 3% Growth % Ownership 5 Yrs Net $$ 10 Yrs Net $$ 5 Yrs Net $$ 10 Yrs Net $$ 5 Yrs Net $$ 10 Yrs Net $$ 10% $ 681,188.79 $ 2,029,967.49 $ 919,653.68 $ 3,815,665.89 $ 509,325.89 $ 1,590,789.76 90% $ 6,130,699.09 $ 18,269,707.37 $8,276,883.16 $34,340,993.04 $4,583,933.02 $14,317,107.82 Total $ 6,811,887.88 $ 20,299,674.86 $9,196,536.84 $38,156,658.94 $5,093,258.91 $15,907,897.57 20% $ 1,362,377.58 $ 4,059,934.97 $1,839,307.37 $ 7,631,331.79 $1,018,651.78 $ 3,181,579.51 80% $ 5,449,510.31 $ 16,239,739.89 $7,357,229.47 $30,525,327.15 $4,074,607.12 $12,726,318.06 Total $ 6,811,887.88 $ 20,299,674.86 $9,196,536.84 $38,156,658.94 $5,093,258.91 $15,907,897.57 30% $ 2,043,566.36 $ 6,089,902.46 $2,758,961.05 $11,446,997.68 $1,527,977.67 $ 4,772,369.27 70% $ 4,768,321.52 $ 14,209,772.40 $6,437,575.79 $26,709,661.26 $3,565,281.23 $11,135,528.30 Total $ 6,811,887.88 $ 20,299,674.86 $9,196,536.84 $38,156,658.94 $5,093,258.91 $15,907,897.57 40% $ 2,724,755.15 $ 8,119,869.94 $3,678,614.74 $15,262,663.58 $2,037,303.56 $ 6,363,159.03 60% $ 4,087,132.73 $ 12,179,804.91 $5,517,922.10 $22,893,995.36 $3,055,955.34 $ 9,544,738.54 Total $ 6,811,887.88 $ 20,299,674.86 $9,196,536.84 $38,156,658.94 $5,093,258.91 $15,907,897.57 50% $ 3,405,943.94 $ 10,149,837.43 $4,598,268.42 $19,078,329.47 $2,546,629.45 $ 7,953,948.79 50% $ 3,405,943.94 $ 10,149,837.43 $4,598,268.42 $19,078,329.47 $2,546,629.45 $ 7,953,948.79 Total $ 6,811,887.88 $ 20,299,674.86 $9,196,536.84 $38,156,658.94 $5,093,258.91 $15,907,897.57
  • 38.
  • 39.
    Referrals by Quarter 8,100 7,966 7,986 7,918 7,900 7,772 7,703 7,700 7,500 7,515 Referrals 7,459 7,300 7,100 6,900 6,737 6,700 6,500 2007 Q 4 2008 Q 1 2008 Q 2 2008 Q 3 2008 Q 4 2009 Q 1 2009 Q 2 2009 Q 3
  • 40.
    Top 20 ReferringPhysicians - 1st Qtr to Prior Yr 1st Qtr 350 336 329 319 QTR 1 - 09 QTR 1 - 10 308 300 283 271 263 250 231 225 200 191 192 200 181 183 175 168 179 170 153 167 170 143 141 137 150 131 125 124 121 106 99 103 103 100 88 91 8793 85 76 54 50 37 - REF REF REF REF REF REF REF REF REF REF REF REF REF REF REF REF REF REF REF REF DOC 1 DOC 2 DOC 3 DOC 4 DOC 5 DOC 6 DOC 7 DOC 8 DOC 9 DOC DOC DOC DOC DOC DOC DOC DOC DOC DOC DOC 10 11 12 13 14 15 16 17 18 19 20
  • 41.
    Ref. Phys. OfficeVisits Referrals Increased 158 74.88% Referrals Decreased 50 23.70% No change 3 1.42% Total Physcians Visited 211 100.00%
  • 42.
  • 43.
    Physicians Productivity byRVU & Proc. Vol. 35,000 FY 2009 Physicians' Productivity 31,340 35,000 33,180 30,000 31,340 30,000 29,219 25,000 25,000 20,159 20,000 20,000 15,000 15,000 10,000 6,532 10,000 5,000 5,000 0 KR BT KM JM LB EJ JS IW KN JH LC JK ER JB PS SG JH2 SS AG CK CB (blank) AW AF DS HH HR GS RT - Sum of Procedures Sum of Work RVU Sum of Procedures Sum of Work RVU
  • 44.
    Practice Statistics Physician Days Worked RVU/Day Procs/Day Revenue/Day Productivity Total 4,347.20 1,398.75 1,857.21 $ 69,676.14 Minimum 99.50 39.74 44.08 $ 1,949.30 Median 183.00 53.57 76.51 $ 2,764.62 Maximum 210.00 80.21 119.14 $ 3,411.30 Average per FTE 193.21 62.17 82.54 $ 3,096.72
  • 45.
    Industry Comparison Six Months Data Days SERL Physician Work RVU RVU/Day Procedures Procs/Day Total Revenue Revenue/Day Worked FTEs Total 4,347.20 25.50 244,707.81 1,398.75 318,196.00 1,857.21 $12,117,877.32 $ 69,676.14 Arithmetic Mean 173.89 9,788.31 55.95 12,727.84 74.29 $ 484,715.09 $ 2,787.05 Median 183.00 10,133.34 53.57 12,049.00 76.51 $ 502,499.71 $ 2,764.62 Minimum Value 99.50 4,232.31 39.74 6,084.00 44.08 $ 207,600.58 $ 1,949.30 Maximum Value 210.00 13,756.17 80.21 20,624.00 119.14 $ 651,814.06 $ 3,411.30 Average per FTE 193.21 10,875.90 62.17 14,142.04 82.54 $ 538,572.33 $ 3,096.72 Industry Standard per FTE 7,136.00 9,671.00 Variance % 34.39% 31.62%
  • 46.
    RVUs Per FTEComparison 14,142 16,000.00 14,000.00 10,876 12,000.00 9,671 10,000.00 7,136 8,000.00 4,471 6,000.00 3,740 4,000.00 2,000.00 - Work RVUS Procedures SERL Industry Std. Variance