

Recommended
More Related Content
What's hot
What's hot (11)
Recently uploaded
Recently uploaded (20)
Gas law
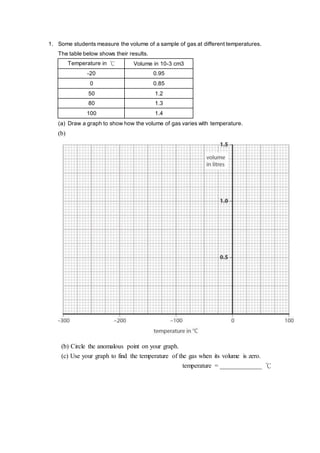
- 1. 1. Some students measure the volume of a sample of gas at different temperatures. The table below shows their results. Temperature in ℃ Volume in 10-3 cm3 -20 0.95 0 0.85 50 1.2 80 1.3 100 1.4 (a) Draw a graph to show how the volume of gas varies with temperature. (b) (b) Circle the anomalous point on your graph. (c) Use your graph to find the temperature of the gas when its volume is zero. temperature = _____________ ℃