SlideShare a Scribd company logo
1 of 87
contentserver__5_.pdf
Aging & Mental Health, January 2007; 11(1): 89–98
ORIGINAL ARTICLE
The relationship of optimism, pain and social support to well-
being in
older adults with osteoarthritis
V. M. FERREIRA & A. M. SHERMAN
Brandeis University, Waltham, MA, US
(Received 30 August 2005; accepted 13 March 2006)
Abstract
Improving the psychological well-being of individuals with
osteoarthritis (OA) is an important concern because the
condition is highly prevalent and has no known cure. Few
studies have assessed the joint contribution of social,
personality,
and physical factors in relation to well-being for OA patients.
In a cross-sectional sample of older adults with OA (n ¼ 73,
73% female), we assessed the role of support perceptions,
optimism and pain in depressive symptoms and life satisfaction.
Greater optimism and support were significantly related to both
greater life satisfaction and lower depressive symptoms.
Further, optimism partially mediated the relationship of pain to
life satisfaction, while support partially mediated the role of
pain in depressive symptoms. The interplay of these variables in
relation to well-being is discussed in the context of chronic
illness and older adulthood.
Introduction
Many older adults (85% of those over 75) currently
experience a painful and often disabling disease,
osteoarthritis (OA), for which there is no known cure
(Sack, 1995). Osteoarthritis can negatively impact
many aspects of life, including both social and
physical functioning (Bookwala, Harralson, &
Parmalee, 2003) through pain, physical and psycho-
social limitations on valued activities, as well as
comorbid depressive symptoms (Penninx et al.,
1998). It is important to investigate factors that
relate to psychological health outcomes of OA
patients in order to better understand how to
improve well-being. As Keefe and his colleagues
suggest (Keefe & Bonk, 1999; Keefe et al., 2002),
there exists a complex interplay of symptomology,
social and psychological factors in arthritis patients.
In the following sections, we review the role of
optimism, social support, and pain as important
correlates of psychological well-being, particularly
for older adults.
Pain
The common and persistent nature of pain asso-
ciated with OA (Schumacker, 1988) may be a reason
for the variability in the well-being of OA patients
(e.g., de Vellis et al., 1986; Klinger, Spaulding,
Polatajko, MacKinnon, & Miller, 1999). Pain has a
strong relationship with many other health-
related variables in older adults with arthritis
(Roberts, Matecjyck, & Anthony, 1996). In OA
samples, greater pain is a stressor linked to lower
social support and well-being (de Vellis et al., 1986).
Pain is also associated with greater depressive
symptoms (Bookwala et al., 2003; Klinger et al.,
1999) and lower life satisfaction (Laborde & Powers,
1985) in patients with OA. However, Blixen and
Kippes (1999) present contrasting evidence showing
that pain from OA is unrelated to life satisfaction
when social support is accounted for, suggesting that
support mediates the negative impact of pain.
Such a finding suggests that the role of psycho-
social factors in the well-being of OA patients may be
important to investigate. While the pain associated
with OA is difficult to control, often with negative
effects on well-being, understanding factors that may
serve as points of intervention would allow for a better
understanding of how to improve patients’ well-
being. Thus, in the following sections, we review
optimism and social support, two factors commonly
linked to psychological well-being outcomes such as
life satisfaction and depressive symptoms.
Optimism
Optimism, defined as an individual’s positive
outlook on life (Scheier, Carver, & Bridges, 1994),
is a dispositional (i.e., temperament) variable related
to adaptation to chronic illness (Lazarus & Folkman,
1984). Optimism is related to both improved
Correspondence: V. M. Ferreira, Brandeis University, Waltham,
MA, US. E-mail: [email protected]
ISSN 1360-7863 print/ISSN 1364-6915 online/07/010089–98 �
2007 Taylor & Francis
DOI: 10.1080/13607860600736166
psychosocial and physical health outcomes
(Barnwell & Kavanaugh, 1997; Brenner, Melamed,
& Panush, 1994), as well as less frequent harmful
health behaviours (i.e., frequent and excessive
drinking in college students; Harju & Bolen, 1998).
Greater optimism is also related to greater
self-reported quality of life in adult samples
(Barnwell & Kavanaugh, 1997).
Scheier and Carver (1987) argue that optimism
plays a protective role in chronic illness by promot-
ing more beneficial health outcomes, health habits,
and effective disease coping. For example, optimism
is not only associated with less severe physical
symptomology (Reker & Wong, 1985), but also
with electing to follow health-promoting practices
as well as coping in healthy, helpful ways with
chronic illness (Fournier, deRidder, & Bensing,
2002). However, the beneficial role of optimism
differs across chronic illnesses.
For example, Fournier et al. (2002) report
differing beneficial effects of optimistic beliefs on
various facets of coping with chronic diseases such as
type I diabetes, rheumatoid arthritis (RA), and
multiple sclerosis (MS) in adults. That is, in the
chronic illnesses which are controllable (type I
diabetes), or at least in part controllable (MS),
positive outcome expectancies are associated with
greater physical functioning. This is not the case
with the much less controllable illness of RA.
Further, in a study comparing patients with
Parkinson’s disease to those with MS, greater
optimism was related to greater physical adjustment
to disease symptoms as well as greater use of
effective coping strategies (deRidder, Scheier, &
Bensing, 2000). However, the relationship between
optimism and coping was stronger among MS
patients, compared to patients experiencing
Parkinson’s. The authors suggest the need to focus
on a specific chronic illness in understanding the role
of optimism in disease.
Fournier et al. (2002) discuss the several types of
optimism that have been established and that, when
the illness is controllable (i.e., when symptoms or
side effects can be controlled by patients’ behaviors),
positive outcome expectancies are the most bene-
ficial type of optimism for chronically ill patients.
Holding positive outcome expectancies suggests that
individuals are generally oriented towards positive
expectations of future events (Scheier & Carver,
1992). Fournier et al. (2002) discuss the benefit of
positive outcome expectancies in the cases of such
illnesses as Type I diabetes and, to some extent, RA,
because in such cases optimistic (i.e., positive
outcome) beliefs may lead to effective-self care as
well as physical and mental health. In the present
study, positive outcome expectancies were assessed.
Although OA is not necessarily controllable, the pain
experienced from OA can often be controlled
through self-management strategies such as exercise
or the use of pain medication, behaviours closely
associated with optimistic beliefs, even though the
occurrence of pain is often unpredictable (Sack,
1995), thus making positive outcome expectancies
an appropriate choice for this sample.
Positive outcome expectancies, also known as
dispositional optimism, are predictive of more
positive affect and less negative affect over time in
older adults (Isaacowitz & Seligman, 2002).
Optimism is also predictive of psychological well-
being. For example, greater optimism predicts less
depression three years after baseline in menopausal
women after controlling for initial depression
(Bromberger & Matthews, 1996). Dispositional
optimism is related to greater psychological well-
being in older adults, including fewer depressive
symptoms and greater life satisfaction (Peterson &
Bossio, 1991). Optimism is believed to be related
to greater psychological well-being because being
optimistic is associated with effective coping strate-
gies (e.g., Carver, Scheier, & Weintraub, 1989).
For example, optimists are more likely to use
problem-focused coping strategies (e.g., Scheier &
Carver, 1987).
In Long and Sangster’s (1993) work on optimism
and coping specifically in the context of arthritis,
greater optimism influenced the use of active
or problem-solving coping techniques, a type of
effective coping beneficial to health and well-being.
This active coping reduced negative symptoms such
as depressive symptoms in RA patients. In looking
specifically at an OA sample of older adults,
greater dispositional optimism was related to use of
pain-coping strategies more frequently, even when
level of pain was controlled (Benyamini, 2005).
However, little research currently explores the
relationship between optimism and the pain asso-
ciated with OA, especially in later life. In one study
that specifically addressed the role of dispositional
optimism in the physical functioning of older adults
with knee OA, Brenes and colleagues (2002) report
that optimism was positively related to task perfor-
mance in walking. However, optimism was not
related to performance in lifting objects, climbing
stairs, or getting in and out of cars in their sample.
Brenes, Rapp, and Rejeski (2002) did not explore
the role of optimism and physical factors such
as pain, or psychological well-being in their investi-
gation. These factors will be addressed in the present
study.
Stability of optimism. While optimism is considered
to be generally stable (Scheier & Carver, 1987),
Benyamini (2005) suggests that reports of optimism,
as measured by items on the LOT-R, the measure
used in the present study, may be dependent on the
time-frame and/or context within which the measure
was administered. Benyamini (2005) argues that,
in his sample of older adults experiencing OA,
optimism may be more easily influenced than with
other samples for two reasons; because participants
90 V. M. Ferreira & A. M. Sherman
are experiencing late life as well as a stressful health
context. If this is the case, it is conceivable that
perceived social support, reported to both affect and
be affected by health stressors such as physical
functioning (Reinhardt & Blieszner, 2000), may play
a role in reports of optimism. In addition, adaptation
to chronic illness (Gil, Keefe, Crisson, & Van
Dalfsen, 1987) as well as pain (de Vellis et al.,
1986) may both be contextual factors affecting
reports of optimism. In an example of the less-
stable nature of optimism in chronic illness samples,
Symister and Friend (2003) report that in a sample
of end-stage renal disease patients, social support
was predictive of optimism. The role of optimism
along with other psychosocial as well as symptomol-
ogy variables such as pain in the well-being of older
adults has not yet thoroughly been investigated.
Understanding such relationships is important in
that these variables together may play a more
complex role in well-being than is currently believed
to be the case. For example, health-related interven-
tions may need to be sensitive to personality
dimensions such as optimism. In addition, beliefs
in optimistic expectancies do decrease in the context
of significant, repetitive stress (e.g., Bandura, 1988;
Carver et al., 1998) such as the disability and
persistent pain associated with OA. While not yet
thoroughly investigated, some literature does suggest
that reports of optimism may be influenced by health
context (Schulz, Tompkins, & Rau, 1988). Schulz
et al. (1988) report that in stroke victims and their
support persons, optimism scores dropped over the
six month period after the stroke. In addition,
Benyamini (2005) discusses the possibility that,
particularly in older adults, reports of optimistic
expectations may be dependent upon more short-
term contextual factors, such as the health context of
pain. While an individual’s disposition, including
optimism, is an important predictor of well-being,
so too is the social aspect of one’s life (Finch &
Graziano, 2001). Thus, social support perceptions,
one facet of social support, will be reviewed in the
following section.
Social support
Social support is defined as the resources perceived
as available from others in social networks
(Antonucci, 1993; Berkman, Glass, Brissette, &
Seeman, 2000; Bisconti & Bergeman, 1999).
Support involves the beneficial receipt of provisions
in relationships, including informational, emotional,
or tangible aid. Support is often assessed subjectively
as an individual’s perception of the support they
perceive as available to them. Perceptions of support
are related to health, including symptoms associated
with chronic illness, in addition to well-being
variables such as life satisfaction (Antonucci &
Knipscheer, 1990; Cummins & Nistico, 2002).
In older adults, perceived support is linked to
fewer depressive symptoms (Finch & Graziano,
2001; Russell & Cutrona, 1991) and greater life
satisfaction (Walen & Lachman, 2000). Looking
specifically at older adults with OA, social support
is associated with fewer depressive symptoms
(Sherman, 2003) as well as less arthritis pain
(Evers, Kraaimaat, Geenen, & Bijlsma, 1998).
Research also suggests that perceptions of social
support may contribute to positive well-being
(Blixen & Kippes, 1999) by positively affecting
such facets of coping as support seeking as a resource
(e.g., Scheier & Carver, 1987).
There has been some speculation about the
combined role of optimism and social support in
psychological functioning. For example, Finch and
Graziano (2001) reported that greater optimism and
social support were each uniquely related to lower
depressive symptoms in a general sample of older
adults. That is, more optimistic older adults, and
those reporting higher social support, reported fewer
depressive symptoms. However, physical stressors,
such as pain, have not been investigated jointly with
support and optimism in relation to well-being,
particularly for OA. This is a gap that should not
be ignored because physical stressors are strongly
related to poor psychological outcomes such as
greater depressive symptoms (e.g., Evers et al.,
1998).
We suggest that experiencing more pain may be
related to individuals’ tendencies not to view their
world in an optimistic, positive light and thus, these
individuals may report less well-being. While this
hypothesis has not yet been tested in the literature,
less pain, like greater optimism in older adults, is
associated with better psychological well-being in
OA samples (de Vellis et al., 1986). In addition,
we suggest that experiencing more pain may be
related to individuals’ tendencies not to view their
relationships as positive and supportive and thus,
these individuals may report less well-being.
Thus, in the present study, the stressor of pain,
a common symptom of OA, as well as social support
and dispositional optimism were investigated in an
effort to understand the role that these different
factors play in the depressive symptoms and life
satisfaction reported by older adults with OA.
Hypotheses
1. Greater pain is hypothesized to be associated
with less life satisfaction and greater depressive
symptoms.
2. Greater optimism and social support are
expected to relate to less depressive symptoms
and greater life satisfaction after accounting
for pain.
3. Two possible mediation models will be tested.
The first will assess the role of optimism in
mediating the relationship of pain to life satisfac-
tion and depressive symptoms. The second will
Optimism, pain, social support in well-being 91
assess the role of support in mediating the
relationship of pain to life satisfaction and
depressive symptoms.
Method
Participants and procedure
Ninety-five potential participants were contacted by
telephone from a list of participants from a previous
OA study (see Ferreira & Sherman, 2006).
The original sample had been recruited through
newspaper advertisements, fliers, and recruitment
through a continuing education program for older
adults. Of the original participants, 72 older adults
(52 women and 20 men, ranging in age from 60
to 84, mean age ¼ 72.4 years) volunteered to
participate in the present study (response rate of
76%). Participants completed and returned the
mailed survey. Follow-up data were used rather
than baseline data because optimism was not
measured at baseline.
There were no significant demographic differences
between responders and non-responders.
Participants all resided in the greater Boston area
and spoke fluent English. The majority (92.6%) of
participants considered themselves Caucasian.
Nearly half of the participants (45.2%, n ¼ 33)
were married, 27.4% (n ¼ 20) were widowed, and
26% (n ¼ 19) were single, divorced or separated. See
Table I for additional demographic information.
There were no significant differences in depressive
symptoms (t ¼ �0.80, ns) or pain (t ¼ 1.28, ns) in
those who did or did not respond.
Measures
Optimism was assessed using the Life Orientation
Test-Revised (LOT-R; Scheier, Carver, & Bridges,
1994), which examines outcome expectancies. The
measure consists of 12 items, including four filler
items not included in the analyses, for a total of
eight items. Great debate has surrounded the use of
the LOT in its entirety as a measure of optimism
(with negatively worded items being reverse coded)
or as a measure of both optimism and pessimism
(with two subscales being conceptualized as separate
constructs. While Scheier and Carver (1987) have
suggested the scale may be used as a bipolar
measure, research has suggested that optimism and
pessimism are very different constructs (e.g., Brenes,
Rapp, Rejeski, & Miller, 2002; Lai, 1994; Marshall,
Wortman, Kusulas, Hervig, & Vickers, 1992). In
light of this controversy, the four positively worded
items assessing optimism were used. Response
options utilized a five-point Likert scale. Higher
scores indicate greater optimism (M ¼ 13.26,
SD ¼ 2.89, high score ¼ 20). Reliability was 0.76
with this sample.
Social support was assessed using the Medical
Outcomes Study (MOS) Social Support Survey
(Sherbourne & Stewart, 1991) which examines
perceived social support (M ¼ 65.06, SD ¼ 18.44,
high score ¼ 95). Higher scores indicate greater
perceived support. Sherbourne & Stewart (1991)
report high internal consistency (Cronbach’s
alpha ¼ 0.97), which was replicated in this sample
(Cronbach’s alpha ¼ 0.97).
Pain was assessed using the pain subscale of the
Medical Outcomes Study (MOS) 36-item short-
form survey (SF-36; Ware & Sherbourne, 1992).
The SF-36 includes self-report items of health
perceptions, physical functioning, role limitations
and pain. The pain subscale includes two items,
which are summed so that a higher score indicates
more pain (M ¼ 5.85, SD ¼ 1.91, high score ¼ 10).
Depressive symptoms were assessed using the
20-item Centre for Epidemiological Studies
Depression scale (CES-D; Radloff, 1977).
The CES-D includes 20 items assessing emotional
(‘I could not stop crying’) and somatic symptoms
(‘I had trouble sleeping’) characteristic of depressed
mood. Response options are on a four-point Likert
type scale with possible responses ranging from
‘all of the time’ to ‘rarely’ (M ¼ 26.25, SD ¼ 8.8,
high score ¼ 40). Reliability was 0.84 with this
sample. Higher scores indicate more depressive
symptomatology.
Life satisfaction was assessed with the Life
Satisfaction Index (LSI; Neugarten, Havinghurst, &
Tobin, 1961). The scale consists of 13 items using a
five-point Likert-type format for response options
(M ¼ 41.31, SD ¼ 10.14, high score ¼ 61). A higher
score means more life satisfaction. Reliability was
0.89 with this sample.
Data analysis
In order to investigate the role of pain, optimism and
perceived social support in depressive symptoms and
life satisfaction, hierarchical multiple regression
analyses were conducted. In the first step of each
Table I. Demographic characteristics, n ¼ 73.
No. (%)
Marital status
Married 33 (45.2)
Widowed 20 (27.4)
Single/divorced/separated 19 (26.0)
No response 1 (1.4)
Education
Bachelor’s degree or greater 42 (57.5)
Some college 13 (17.8)
Associate’s degree 4 (5.5)
High school diploma or less 10 (13.7)
No response 4 (5.5)
Income (annual)
�20,000 23 (31.5)
>20,001 48 (65.8)
No response 2 (2.7)
92 V. M. Ferreira & A. M. Sherman
regression, age was entered. In the second step for
each regression, pain was entered.
To assess the potentially mediating roles of
optimism and support to pain, two multiple regres-
sion models were developed. In these two regression
analyses, life satisfaction and depressive symptoms
were each assessed as an outcome. In each of these
models, after age and pain were entered in steps one
and two, support was entered at the third step of
the model, followed by optimism at the fourth step.
This model investigated the role of either optimism
or support as mediators of pain in relation to the
outcomes (see Figure 1).
In order to assess the role of either support or
optimism as a mediator of pain, three aspects to the
mediation model must be assessed (Baron & Kenny,
1986). In the first leg of the model, the association of
pain to the outcome must be significant. Next, pain
must significantly predict the mediator (support or
optimism). Finally, in the third leg of the model,
the relationship of pain to the outcome must be
reduced to non-significance once the mediator
(support or optimism) is entered into the model.
Only when all three of these criteria are met
will mediation be demonstrated (see Figure 1;
Baron & Kenny, 1986). Follow-up Sobel tests will
then be conducted to test for partial mediation
(Preacher & Leonardelli, 2003).
Results
Bivariate analyses
Correlations between the variables measured in the
present study are reported in Table II. Gender,
marital status, and income were excluded from
further multivariate analyses to conserve power
because they were not related to any of the other
measures. Age was used as a control variable because
older age was correlated with lower life satisfaction.
Pain was significantly correlated with greater depres-
sive symptoms and less life satisfaction. Support
and optimism were both significantly correlated
with fewer depressive symptoms and greater life
satisfaction.
Multivariate analyses
Life satisfaction. In the first hierarchical multiple
regression model with life satisfaction as an outcome,
(a)
(b)
Pain
Social support
Depressive symptoms
Life satisfaction
Pain
Optimism
Depressive symptoms
Life satisfaction
Figure 1. (a) Role of optimism as a mediator; (b) Role of social
support as a mediator.
Table II. Correlations of measures.
1 2 3 4 5 6 7 8 9
Age – �0.12 0.04 �0.04 0.14 �0.14 �0.04 0.10 �0.29*
Gender – – �0.13 0.09 �0.17 0.03 0.01 0.02 �0.09
Income – – – �0.18 �0.06 0.08 0.10 �0.16 0.12
Marital status – – – – �0.01 �0.14 0.01 0.22 0.03
Pain – – – – – �0.28* �0.30* 0.43** �0.46**
Social support – – – – – – 0.07 �0.44** 0.41**
Optimism – – – – – – – �0.53** 0.64**
Depressive symptoms – – – – – – – – �0.64**
Life satisfaction – – – – – – – – –
*p50.05; **p50.01.
Optimism, pain, social support in well-being 93
we assessed the role of pain, perceptions of social
support, and optimism, with optimism as a possible
mediator of the relationship of pain to life
satisfaction. The final model was significant
(F (4,63) ¼ 20.13, p50.01, adjusted R2 ¼ 0.53;
see Table III). Greater age was significantly related
to higher life satisfaction at the first step and
throughout the model (R2 ¼ 0.08, F (1,66) ¼ 5.36,
p50.05). In the second step, less pain was related to
greater life satisfaction (�R2 ¼ 0.12, F (1,65) ¼ 9.69,
p50.01). Perceived social support explained addi-
tional variance (�R2 ¼ 0.06, F (1,64) ¼ 4.98,
p50.01) when entered at the third step. Greater
support was related to more life satisfaction, while
pain remained significant. Support remained sig-
nificant at the fourth step (t ¼ 2.75, p50.01).
However, the relationship of pain to life satisfaction
was reduced to non-significance once optimism was
entered in the fourth step of the model (t ¼ 1.46, ns).
Greater optimism was significantly related
to life satisfaction at this step (�R2 ¼ 0.31,
F (1,63) ¼ 45.08, p50.01). This model suggests
that optimism should be tested as a partial mediator
of pain (Baron & Kenny, 1986). The relationship of
pain as a predictor of optimism was significant
(F (1, 70) ¼ 7.69, p50.01, adjusted R2 ¼ 0.09). This
finding suggests that pain may be partially mediated
by optimism in relation to life satisfaction. A
mediation analysis was conducted assessing opti-
mism as a mediator of pain. The Sobel mediation
test was significant (t ¼ �2.54, p ¼ 0.01), suggesting
that optimism does partially mediate the relationship
of pain to life satisfaction (Preacher & Leonardelli,
2003). Full mediation is not demonstrated because
the beta values were not reduced to zero (Baron &
Kenny, 1986). There was no evidence that support
mediated pain in the analysis.
Depressive symptoms. In the hierarchical multiple
regression model assessing the role of optimism, pain
and support in their relationship to depressive
symptoms, we assessed the possible role of optimism
as a mediator of pain. The final model was
significant (F (4,62) ¼ 14.68, p50.01, adjusted
R
2
¼ 0.45; see Table IV). Age was not significantly
related to depressive symptoms at the first step, or
throughout the model. In the second step, more pain
was related to greater depressive symptoms
(�R2 ¼ 0.16, F (1,64) ¼ 12.13, p50.01). Perceived
social support explained additional variance
(�R2 ¼ 0.12, F (1,63) ¼ 10.85, p50.01) when
entered at the third step. Less support was related
to greater depressive symptoms, while pain remained
significant though was reduced in its statistical
relationship. The relationship of pain to depression
was reduced to non-significance once optimism was
entered in the fourth step of the model, where lower
optimism and support were both related to higher
depressive symptoms (�R2 ¼ 0.45, F (1,62) ¼ 24.06,
p50.01). This model suggests that both optimism
and pain should be tested as possible mediators of
pain in relation to depressive symptoms (Baron &
Kenny, 1986).
Table III. Summary of hierarchical regression analysis for life
satisfaction showing optimism as a mediator (n ¼ 70).
1 2 3 4
Step B SE B � B SE B � B SE B � B SE B �
Age 0.46 0.20 0.27* 0.37 0.19 0.22* 0.34 0.14 0.20* 0.33 0.14
0.20*
Pain – – – �1.62 0.52 �0.35** �1.34 0.52 �0.29* �0.61 0.42
�0.13
Support – – – – – – 0.13 0.06 0.25* 0.12 0.05 0.24**
Optimism – – – – – – – – – 1.93 0.29 0.58**
Adjusted R2 – – – 0.06* – – – 0.17** – – – 0.22* – – – 0.53**
*p50.05; **p50.01.
Table IV. Summary of hierarchical regression analysis for
depressive symptoms showing optimism as a mediator (n ¼ 70).
1 2 3 4
Step B SE B � B SE B � B SE B � B SE B �
Age �0.12 0.19 �0.08 �0.30 0.18 �0.02 0.02 0.17 0.01 0.02
0.14 0.01
Pain – – – 1.74 0.50 0.40** 1.35 0.48 0.31 0.81 0.43 0.19
Support – – – – – – �0.18 0.05 �0.36** �0.17 0.05 �0.35**
Optimism – – – – – – – – – �1.45 0.30 �0.46**
Adjusted R2 – – – 0.01* – – – 0.14** – – – 0.25* – – – 0.45**
*p50.05; **p50.01.
94 V. M. Ferreira & A. M. Sherman
Support as a mediator. The relationship of pain to
support was significant (F (1, 70) ¼ 5.16, p50.05,
adjusted R2 ¼ 0.06). Finally, because the first two
legs of the mediation model were significant, a Sobel
test was used to assess the final leg of the mediation
model. The mediation test was significant (t ¼ 1.98,
p ¼ 0.05). This finding suggests that pain is partially
mediated by support in relation to depressive
symptoms. There was no evidence that optimism
mediated pain in this analysis.
Optimism as a mediator. The relationship of pain
to optimism was assessed to be significant
(F (1, 70) ¼ 7.69, p50.01, adjusted R2 ¼ 0.09).
As was done in the previous analysis, because
the first two legs of the mediation model were
significant, a Sobel test was used to assess the final
leg of the mediation model. The mediation test was
not significant (t ¼ 0.06, ns). This finding suggests
that pain is not mediated by optimism in relation to
depressive symptoms.
Discussion
In the present study, we investigated the role of
social relations, optimism and the common symp-
tom of pain in the well-being of older adults
experiencing OA. The findings suggest that pain,
social support and optimism, are related in complex
ways for this sample. Furthermore, these findings
suggest that these factors relate in unique ways
depending upon the outcome being investigated.
Life satisfaction
In investigating life satisfaction, pain was partially
mediated by optimism, while support was indepen-
dently related to life satisfaction. These results
suggest that optimism is partially responsible for
the relationship between pain and life satisfaction,
possibly by negatively influencing the optimistic
outlook that is associated with life satisfaction. This
finding that optimism partially mediated pain has
important implications for our understanding of the
process by which pain is related to psychological
well-being (Bookwala et al., 2003; Klinger et al.,
1999; Labourde & Powers, 1985; Robert et al.,
1996). An optimistic disposition appears to at least
be partially diminished by reports of pain, a
contextual factor which OA patients may struggle
with on a daily basis through the rest of their lives
(Schumacker, 1988). As discussed previously in our
literature review, although considered to be generally
stable (Scheier & Carver, 1987), research suggests
that optimism may be dependent upon the context
within which it was assessed (Benyamini, 2005).
Optimism may be salient for well-being in older
adults because, similar to personality constructs such
as hardiness (Wallace, Bisconti, & Bergeman, 2001),
an optimistic personality may act as a resource in
helping older adults to compensate for other losses in
resources as they age (Baltes, 1996).
Support did not mediate the relationship of pain
to life satisfaction. Instead, support was directly
linked to this outcome. This finding is consistent
with much research suggesting the strong relation-
ship of support to greater well-being (e.g., Cummins
& Nistico, 2002; Russell & Cutrona, 1991; Walen &
Lachman, 2000). As discussed in the introduction,
support has been demonstrated to play an important
role in both physical health as well as well-being
(Antonucci & Knipscheer, 1990; Cummins &
Nistico, 2002).
Depressive symptoms
In contrast to the findings for life satisfaction, for
depressive symptoms, there was no evidence of
mediation of pain by optimism. However, support
partially mediated pain in relation to depressive
symptoms. That is, the relationship of greater pain to
greater depressive symptoms appears to at least in
part be accounted for by the relationship of less
support to greater depressive symptoms where older
adults experiencing more pain may perceive their
social networks as less supportive and thus, report
greater depressive symptoms.
This mediational role of perceived support con-
tributes support to the work of Antonucci, Langfahl,
and Akiyama (2004) who suggest that new research
should investigate predictors of support perceptions
as many contextual factors may play a role in
perceptions of social relations. In the case of our
findings, the context of consistent pain associated
with OA is demonstrated as a contextual fact playing
a role in support perceptions.
Support seems to be a powerful resource for this
sample, with pain working indirectly through sup-
port to influence depressive symptoms. This finding
is consistent with a wealth of research suggesting not
only that perceived social support cyclically affects
and is affected by health stressors (e.g., Gil et al.,
1987; Reinhardt & Blieszner, 2000), but also that
social support plays a complex role in the relation-
ship of health variables to psychological well-being
outcomes (e.g., Bisconti & Bergeman, 1999).
In summary, in this sample, optimism partially
mediated pain perceptions in relation to life satisfac-
tion while support partially mediated pain percep-
tions in relation to depressive symptoms. Taken
together, the findings of the present study are
difficult to explain. Why does optimism play a
mediational role in the relationship of pain to life
satisfaction while support mediates the relationship
of pain to depressive symptoms? The reasons remain
unclear. Follow-up analyses with different samples
of older adults experiencing OA are necessary for
two reasons. First, such analyses would either
replicate or refute these findings. And second, if
the present findings are supported, differences in the
Optimism, pain, social support in well-being 95
sample may shed light on the mechanisms by which
these unique and interesting findings have occurred.
Longitudinal, as opposed to the cross-sectional data
used in the present study, are suggested in order to
provide a more rigorous test of mediation in follow-
up research. In addition to these limitations, other
limitations to the present study do exist, a few of
which will be highlighted next.
Limitations and future research
The small, non-random nature of our sample may
result in somewhat limited generalizability.
Replication of this study with a more representative
sample may provide stronger statistical evidence for
the role of support and optimism as mediators of
pain in well-being in samples of older adults
with OA. However, our demonstration of
significant patterns of association in such a small
sample indicates that the interplay of these
variables should be a fruitful arena for further
investigation.
In addition, the self-report nature of the measures
means that shared method variance could be a
problem. Future research could replicate this study
with additional observed measures of physical
functioning in order to assess the role of physical
impairment and symptoms in well-being while still
taking into account personality and social relations
factors.
In addition, the findings suggest that future
research might examine whether other health related
stressors such as physical limitations, account for
more of the variance in well-being than pain. In this
way, the physical symptoms of OA might be better
understood in terms of how they affect the overall
experience of the patient.
Additional suggestions for future research include
investigating the role of other dispositional variables
in the well-being outcomes of OA patients, in an
effort to provide insight into how to better improve
the well-being of individuals suffering from pain.
For example, the personality variable of hardiness is
negatively linked to both self-reported and objective
measures of health in older adults (Wallace et al.,
2001). This may indicate the importance of person-
ality as a resource that allows older adults to
compensate for losses and changes as they age
(Baltes, 1996). Finally, longitudinal work is sug-
gested to look at the significance of all three areas of
life (social, personality, and physical) in their
relationships to well-being. As mentioned above,
optimism and support may be a powerful factor in
contributing to well-being due to its value in
compensating for other losses in later life.
Interventions
Although follow-up research is necessary, the pre-
sent findings lead us to suggest further research into
two approaches to intervention aimed at improving
the well-being of older adults experiencing OA.
While pain is a symptom of OA that is difficult to
control entirely, our findings of support acting as a
mediator of pain to depressive symptoms and of
optimism mediating the role of pain in life satisfac-
tion suggests that focusing on these two psychosocial
facets may be an efficacious way to approach
intervention strategies. For example, a focus
might be placed on working with OA patients and
their partners or close family members to strengthen
relationships as well as raise awareness in the
patient of the social support available to them.
Zautra, Hamilton, and Yocum (2000) report that,
in their sample of older women experiencing
rheumatoid arthritis, interventions designed to
enhance social engagement not only improved
psychological well-being immediately, but also
increased illness coping capacity when assessed
four months later. In addition, interventions might
focus on increasing positive outcome expectancies, a
psychosocial factor considered to be less stable in
samples experiencing a chronic condition
(Benyamini, 2005).
Conclusion
In summary, our results indicate that pain has a
complex relationship with facets of well-being, both
life satisfaction and freedom from depressive symp-
toms, in older adults experiencing OA. That is, the
effect of pain on perceptions of well-being is
influenced by both personality and social relations
variables. Being optimistic appears to mediate the
relationship of pain in life satisfaction while support
appears to mediate pain in relation to depressive
symptoms. While the mediational role of support in
health context and well-being relationships is well-
documented, the mediational role of optimism is
much more recent. Thus, investigation of these
findings in additional samples of older adults
experiencing OA, as well as other chronic illness
samples is suggested in order to better understand
these findings.
This is one of the only studies to look at the role of
support, pain, and optimism together in an OA
sample. This investigation has afforded us some
insight into some aspects of life that allow older
adults to maintain a sense of well-being in the face
of the challenging disease of OA. Although all
three variables had been established as individually
important to well-being, the contribution of the
present results lies in showing the importance
of both optimism and support in well-being
independent of other factors, as well as serving as a
mediator of physical factors in relation to depressive
symptoms and life satisfaction. We have demon-
strated the joint contribution of both positive social
relationships as well as a positive outlook on life
96 V. M. Ferreira & A. M. Sherman
in contributing to the well-being of older adults
with OA.
References
Antonucci, T. C. (1993). Attachment: From youth through
adulthood. In R. Kastenbaum (Ed.), Encyclopedia of adult
development (pp. 40–44). Phoenix, AZ: Oryx Press.
Antonucci, T. C., & Knipscheer, C. P. M. (1990). Social
network
research: Review and perspectives. In C. P. M. Knipsheer &
T. C. Antonucci (Eds.), Social network research (pp. 161–174).
Amsterdam: Swets & Zeitlinger.
Antonucci, T. C., Langfahl, E. S., & Akiyama, H. (2004).
Relationships as outcomes and contexts. In F. R. Lang &
K. L. Fingerman (Eds.), Growing together: Personal
relationships
across the lifespan (pp. 24–44). Cambridge: Cambridge
University Press.
Arthritis Foundation (Retrieved May 17, 2005).
www.arthritis.org
Baltes, M. M. (1996). The many faces of dependency in old age.
New York: Cambridge University Press.
Bandura, A. (1988). Self-regulation of motivation and action
through goal systems. In V. Hamilton, G. H. Bower &
N. H. Frijda (Eds.), Cognitive perspectives on emotion and
motivation (pp. 37–61). Dordrecht: Kluwer Academic
Publishers.
Barnwell, A. M., & Kavanaugh, D. J. (1997). Prediction of
psychological adjustment to multiple sclerosis. Social Science
and Medicine, 45, 411–418.
Baron, R. M., & Kenny, D. A. (1986). The moderator-mediator
variable distinction in social psychological research:
Conceptual, strategic, and statistical considerations. Journal of
Personality and Social Psychology, 51, 1173–1182.
Benyamini, Y. (2005). Can high optimism and high pessimism
co-exist? Findings from arthritis patients coping with pain.
Personality & Individual Differences, 38, 1463–1473.
Berkman, L. F., Glass, T., Brissette, I., & Seeman, T. E. (2000).
From social integration to health: Durkheim in the new
millennium. Social Science and Medicine, 51, 843–857.
Bisconti, T. L., & Bergeman, C. S. (1999). Perceived social
control as a mediator of the relationships among social support,
psychological well-being, and perceived health. The
Gerontologist, 39, 94–103.
Blixen, C. E., & Kippes, C. (1999). Depression, social support,
and quality of life in older adults with osteoarthritis. Journal of
Nursing Scholarship, 31, 221–226.
Bookwala, J., Harralson, T. L., & Parmalee, P. A. (2003).
Effects
of pain and well-being in older adults with osteoarthritis of the
knee. Psychology and Aging, 18, 844–850.
Brenes, G. A., Rapp, S. R., Rajeski, W. J., & Miller, M. E.
(2002).
Do optimism and pessimism predict physical functioning?
Journal of Behavioral Medicine, 25, 219–231.
Brenner, G. F., Melamed, B. G., & Panush, R. S. (1994).
Optimism and coping as determinants of psychosocial adjust-
ment to rheumatoid arthritis. Journal of Clinical Psychology in
Medical Settings, 1, 115–134.
Bromberger, J. T., & Matthews, K. A. (1996). A longitudinal
study of the effects of pessimism, trait anxiety, and life stress
on
depressive symptoms in middle-aged women. Psychology and
Aging, 11, 207–213.
Carver, C. S., Scheier, M. F., & Weintraub, J. K. (1989).
Assessing coping strategies: A theoretically based
approach. Journal of Personality and Social Psychology,
56, 267–283.
Cummins, R. A., & Nistico, H. (2002). Maintaining life
satisfaction: The role of positive cognitive bias. Journal of
Happiness Studies, 3, 37–69.
deRidder, D., Scheier, K., & Bensing, J. (2000). The relative
benefits of being optimistic: Optimism as a coping resource in
multiple sclerosis and Parkinson’s disease. British Journal of
Health Psychology, 5, 141–155.
de Vellis, R. F., McEvoy, de vellis, B., Sauter, S. V. H.,
Harring, K., & Cohen, J. L. (1986). Predictors of pain and
functioning in arthritis. Health Education Research, 1, 61–67.
Evers, A. M. W., Kraaimaat, F. W., Geenen, R., &
Bijlsma, J. W. J. (1998). Psychosocial predictors of functional
change in recently diagnosed rheumatoid arthritis patients.
Behavior Research and Therapy, 36, 179–193.
Ferreira, V. M., & Sherman, A. M. (2006). Control beliefs and
social relations: Their relationship to well-being outcomes in
older adults with Osteoarthritis. International Journal of Aging
and Human Development, 62, 255–274.
Finch, J. F., & Graziano, W. G. (2001). Predicting depression
from temperament, personality, and patterns of social relations.
Journal of Personality, 69, 27–52.
Fournier, M., de Ridder, D. T. D., & Bensing, J. (2002).
Optimism and adaptation to chronic disease: The role of
optimism in relation to self-care options of type 1 diabetes
mellitus, rheumatoid arthritis and multiple sclerosis. British
Journal of Health Psychology, 7, 409–432.
Gil, K. M., Keefe, F. J., Crisson, J. E., & Van Dalfsen, P. J.
(1987). Social support and pain behavior. Pain, 29, 209–217.
Harju, B. L., & Bolen, L. M. (1998). The effects of optimism
on coping and perceived quality of life of college students.
Journal of Social Behavior and Personality, 13, 185–200.
Isaacowitz, D. M., & Seligman, M. E. P. (2002). Cognitive style
predictors of affect change in older adults. International Journal
of Aging and Human Development, 54, 233–253.
Keefe, F. J., & Bonk, V. (1999). Psychosocial assessment of
pain
in patients having rheumatic diseases. Rheumatic Diseases
Clinics
of North America, 25, 81–103.
Keefe, F. J., Smith, S. J., Buffington, A. L. H., Gibson, J.,
Studts, J. L., & Caldwell, D. S. (2002). Recent advances and
future directions in the biopsychosocial assessment and
treatment of arthritis. Journal of Consulting and Clinical
Psychology, 70, 640–655.
Klinger, L., Spaulding, S. J., Polatajko, H. J., MacKinnon, J. R.,
& Miller, L. (1999). Chronic pain in the elderly: Occupational
adaptation as a means of coping with osteoarthritis of the hip
and/or knee. Clinical Journal of Pain, 15, 275–283.
Labourde, J. M., & Powers, M. J. (1985). Life satisfaction,
health control orientation, and illness-related factors in
persons with Osteoarthritis. Research in Nursing and Health, 8,
183–190.
Lai, J. C. L. (1994). Differential predictive power of the
positively
versus the negatively worded items of the Life Orientation Test.
Psychological Reports, 75, 1507–1515.
Lazarus, R. S., & Folkman, S. (1984). Stress, appraisal, and
coping.
New York: Springer.
Long, B. C., & Sangster, J. L. (1993). Dispositional optimism/
pessimism and coping strategies: Predictors of psychosocial
adjustment of rheumatoid and osteoarthritis patients. Journal of
Applied Social Psychology, 23, 1069–1091.
Marshall, G. N., Wortman, C. B., Kusulas, J. W., Hervig, L. K.,
& Vickers, R. R. (1992). Distinguishing optimism from
pessimism: Relations to fundamental dimensions of mood
and personality. Journal of Personality & Social Psychology,
62,
1067–1074.
Neugarten, B. L., Havinghurst, R. J., & Tobin, S. S. (1961).
The measurement of life satisfaction. Journal of Gerontology,
16,
134–143.
Penninx, B. W. J. H., van Tillburg, T., Boeke, A. J. P.,
Deeg, D. J. H., Kriegsman, D. M. W., & van Eijk, J. Th. M.
(1998). Effects of social support and personal coping resources
on depressive symptoms: Different for various chronic diseases?
Health Psychology, 17, 551–558.
Peterson, C., & Bossio, L. M. (1991). Health and Optimism.
New York: Free Press.
Preacher, K. J., & Leonardelli, G. J. (2003). Calculation for the
Sobel Test: An interactive calculation tool for mediation tests.
Optimism, pain, social support in well-being 97
Retrieved Sept. 24, 2005, from http://www.unc.edu/�preacher/
sobel/sobel.htm
Radloff, L. S. (1977). The CES-D scale: A self-report
depression
scale for research in the general population. Applied
Psychological Measurement, 3, 385–401.
Reinhardt, J. P., & Blieszner, R. (2000). Predictors of perceived
support quality in visually impaired elders. The Journal of
Applied Gerontology, 19, 345–362.
Reker, G. T., & Wong, P. T. P. (1985). Personal optimism,
physical and mental health: The triumph of successful aging.
In J. E. Birren & J. Livingston (Eds.), Cognition, stress and
aging
(pp. 134–173). New York: Prentice Hall.
Roberts, B. L., Matecjyck, M., & Anthony, M. (1996). The
effects of social support on the relationship of functional
limitations and pain to depression. Arthritis Care and Research,
9, 67–73.
Russell, D. W., & Cutrona, C. E. (1991). Social support, stress,
and depressive symptoms among the elderly: Test of a process
model. Psychology and Aging, 6, 190–201.
Sack, K. (1995). Osteoarthritis: A continuing challenge.
Western
Journal of Medicine, 163, 579–586.
Scheier, M. F., & Carver, C. S. (1987). Dispositional optimism
and physical well-being: The influence of generalized outcome
expectancies on health. Journal of Personality, 55, 169–210.
Scheier, M. F., & Carver, C. S. (1992). Effects of optimism on
psychological and physical well-being: Theoretical
overview and empirical update. Cognitive Theory Research, 16,
201–228.
Scheier, M. F., Carver, C. S., & Bridges, M. W. (1994).
Distinguishing optimism from neuroticism (and trait anxiety,
self-mastery, and self-esteem): A re-evaluation of the Life
Orientation Test. Journal of Personality and Social Psychology,
67, 1063–1078.
Schulz, R., Tompkins, C. A., & Rau, M. T. (1988).
A longitudinal study of the psychosocial impact of stroke on
primary support person. Psychology & Aging, 3, 131–141.
Schumacker, H. R. (1988). Primer on the rheumatic diseases
(9th ed.). Atlanta, GA: Arthritis Foundation.
Sherbourne, C. D., & Stewart, A. L. (1991). The MOS social
support survey. Social Science and Medicine, 32, 705–714.
Sherman, A. (2003). Social relations and depressive symptoms
in
older adults with osteoarthritis. Social Science and Medicine,
56,
247–257.
Symister, P., & Friend, R. (2003). The influence of social
support
and problematic support on optimism and depression in
chronic illness: A prospective study evaluating self-esteem as
a mediator. Health Psychology, 22, 123–129.
Walen, H. R., & Lachman, M. E. (2000). Social support and
strain from partner, family, and friends: Costs and benefits for
men and women in adulthood. Journal of Social and Personal
Relationships, 17, 5–30.
Wallace, K. A., Bisconti, T. L., & Bergeman, C. S. (2001). The
mediational effect of hardiness on social support and optimal
outcomes in later life. Basic and Applied Social Psychology, 23,
267–279.
Ware, J. E., & Sherbourne, C. D. (1992). The MOS 36-item
short-form health survey (SF-36): Conceptual framework and
item selection. Medical Care, 30, 473–481.
Zautra, A. J., Hamilton, N., & Yocum, D. (2000). Patterns of
positive social engagement among women with rheumatoid
arthritis. The Occupational Therapy Journal of Research, 20,
21s–40s.
98 V. M. Ferreira & A. M. Sherman
contentserver__4_.pdf
The Relationships among Hope, Pain, Psychological
Distress, and Spiritual Well-Being in Oncology Outpatients
Blake Rawdin, MD, MPH,
1
Carrie Evans, MA,
2
and Michael W. Rabow, MD
3
Abstract
Objective: Limited research in Taiwan and Europe suggest that
hope is inversely correlated with certain di-
mensions of the pain experience. However, the relationship
between hope and pain among oncology out-
patients in the United States has not been evaluated. The aims
of this study were to investigate the relationship
between hope and cancer pain, after accounting for key
psychological, demographic, and clinical characteristics.
Design: We enrolled a convenience sample of 78 patients who
were receiving concurrent oncologic and
symptom-focused care in a comprehensive cancer center. Patient
demographic and clinical information was
obtained from patient report and medical record review. Patients
completed the Herth Hope Index, the Brief
Pain Inventory, the Hospital Anxiety and Depression Scale, and
the Steinhauser Spiritual Concern Probe.
Results: Levels of hope were not associated with age, gender, or
the presence of metastatic disease. Herth Hope
Index scores were negatively correlated with average pain
intensity (p = 0.02), worst pain intensity (p < 0.01),
pain interference with function (p < 0.05), anxiety (p < 0.01),
and depression (p < 0.01), and were positively cor-
related with spiritual well-being scores (p < 0.01). However,
after controlling for depression and spiritual well-
being with regression analysis, the relationship between pain
intensity and hope was no longer significant.
Conclusions: While an association exists between the patients’
experience of pain and levels of hope in this
study, adjustment for depression and spiritual well being
eliminates the relationship initially observed.
Although the causal relationships have yet to be determined, in
our study hope had a stronger connection to
psycho-spiritual factors, than to pain experiences or severity.
Introduction
Maintaining hope in the face of serious illness has longbeen a
goal of patients, families, and clinicians. How-
ever, relatively little is known about the factors that sustain
hope.1,2 Even so, hope is a key clinical and perhaps thera-
peutic variable, affecting cancer patients’ adjustment and
coping skills, overall well-being, immune function, and
quality of life.3–10 Conversely, lack of hope and hopelessness
is associated with physical illness, depression, and wish to
hasten death.11,12 Therefore, developing greater understand-
ing of the demographic and clinical factors that might be as-
sociated with or influence a patient’s degree of hope could
lead to strategies to identify patients at higher risk for hope-
lessness or factors that could be targeted by interventions to
improve hope and coping with cancer.
Defining and operationalizing hope is a complex endeavor
as the term has many different interpretations, meanings, and
usages. Qualitative investigations of hope within nursing lit-
erature have helped describe and define the concept in terms
of its sources, attributes, and goals. According to the
conceptual model developed by Dufault and Martocchio,
hope is a ‘‘multidimensional dynamic life force characterized
by
a confident yet uncertain expectation of achieving a future good
which, to the hoping person, is realistically possible and
personally significant.’’ Furthermore, hope is described as a
‘‘complex of many thoughts, feelings, and actions that change
with time.’’ Based on extensive research, Dufault and Mar-
tocchio conceptualized hope as composed of two spheres,
‘‘generalized hope’’ and ‘‘particularized hope,’’ each consist-
ing of six shared dimensions: cognitive, temporal, affective,
behavioral, affiliative, and contextual.13
As described in reviews by Butt14 and by Chi,15 a number of
studies have investigated the role of hope in different popu-
lations of cancer patients using qualitative and/or quantita-
tive methods. Various instruments have been used to measure
hope, most common of which is the Hearth Hope Scale and its
more concise counterpart, the Herth Hope Index (HHI). Of the
1Department of Psychiatry, 2School of Nursing, 3Division of
General Internal Medicine, University of California, San
Francisco, San Francisco,
California.
Accepted September 21, 2012.
JOURNAL OF PALLIATIVE MEDICINE
Volume 16, Number 2, 2013
ª Mary Ann Liebert, Inc.
DOI: 10.1089/jpm.2012.0223
167
studies that have quantitatively assessed the relationship be-
tween hope and cancer pain, findings have varied.16–21 Some
research has evidenced direct negative correlations between
pain severity and hope.16,18,22 Other studies, however, show
no significant direct correlations between hope scores and
pain intensity or duration.17,20 For example, a cross-sectional
study of hospitalized cancer patients in Norway found HHI
scores correlated negatively with several of the interference
items on the Brief Pain Inventory (BPI), but not with pain
severity per se.20 A study investigating the association be-
tween pain and hope levels in hospitalized Taiwanese cancer
patients concluded that HHI scores did not differ between
patients with and without cancer pain. However, among
those patients with pain, hope levels correlated with patients’
beliefs about their pain symptoms rather than the pain itself
(i.e., pain duration, intensity, and relief ), suggesting that
cognitive and emotional processing may mediate the rela-
tionship between pain and hope.17
To our knowledge, none of the studies focused on hope and
pain levels to date have included metrics of both psycholog-
ical and spiritual well-being. According to Chochinov and
others, spirituality can play a significant role in maintaining
hope, and it has been recognized by the Institute of Medicine
as an important aspect of supportive care at end of life.22–25
Research has also provided empirical support for the hy-
pothesis that spiritual well-being might help to bolster psy-
chological functioning and adjustment to illness.15,26–28
Because the prior literature has delivered inconsistent re-
sults and primarily focused on inpatients, the goal of this
study was to examine the relationship between pain and hope
among oncologic outpatients, while also controlling for psy-
cho-spiritual factors and other potentially significant clinical
and demographic variables. It was also important to evaluate
the relationship between hope and pain among patients in the
US, because prior published studies were set in Europe and
Asia.
Methods
Patients and setting
Patients (n = 78) were recruited from the Symptom Man-
agement Service (SMS), an oncologic outpatient consultation
service at the University of California, San Francisco (UCSF)
Helen Diller Family Comprehensive Cancer Center. Patients
were included if they were able to complete surveys in En-
glish, able to provide informed consent, were >18 years of
age, and had a diagnosis of cancer. Patients with diagnoses of
dementia or psychosis were excluded. Institutional Review
Board approval was received before data collection began.
Medical records were reviewed to confirm cancer diagnoses
and to investigate the presence of metastatic disease.
Study instruments
Patients were recruited in the SMS clinic waiting area. After
obtaining written informed consent, patients completed a
demographic questionnaire, the HHI, BPI, Hospital Anxiety
and Depression Scale (HADS), and Steinhauser Spiritual
Concern Probe (SSCP). We selected these measures based on
the frequency of their use in the literature, ease of adminis-
tration, and construct validity and internal consistency
ratings.
The HHI is a 12-item score questionnaire that uses a 4-point
Likert scale to assess level of hope.29 The HHI, developed in
the oncology setting to operationalize and quantify hope for
research and clinical purposes, is based upon Dufault and
Martocchio’s conceptual framework of hope. Through psy-
chometric validation studies using factor analysis, Herth suc-
cessfully identified three subscales—temporality and future,
positive readiness and expectancy, and interconnectedness.
These three subscales correspond to the cognitive-temporal,
affective-behavioral, and affiliative-contextual dimensions
elucidated in the Dufault and Martocchio model.13 Total
HHI score ranges from 12 to 48 with higher scores corre-
sponding to higher levels of hope. Overall scores provide a
validated and reliable measure of global hope for cancer pa-
tients with an alpha coefficient of 0.97 and a reliability coeffi-
cient of 0.91.29
The BPI is a valid and reliable scale for assessing both pain
intensity and pain interference with daily activities, using an
11-item questionnaire.30 The first part consists of four ques-
tions that addresses pain severity (where zero refers to ‘‘no
pain’’ and 10 to pain as ‘‘bad as you can imagine’’), whereas
the second part asks about pain interference with seven as-
pects of function (where zero refers to ‘‘does not interfere’’ and
10 to ‘‘completely interferes’’). The questionnaire in our study
was based on pain experienced over the past week, as in the
long version of the BPI.
The HADS is a tool designed for physically ill patients to
measure anxiety and depression. It avoids reliance on the
physical symptoms of psychiatric disease that result from the
physical illness itself. This 14-item scale has been widely
validated for use with cancer patients.31
The SSCP uses a 5-point Likert scale to evaluate a patient’s
sense of spiritual well-being by asking to what degree the
patient feels ‘‘at peace.’’ Higher scores signify greater spiritual
well-being. It has been validated as a screen for spiritual
distress, associated with both religious and meaning-making
elements of spirituality.32
Statistical analysis
Data analyses were conducted using SPSS for Mac Release
20.0.0 (SPSS, Inc., Chicago, IL). Descriptive statistics were
generated to assess the sample in terms of demographics and
clinical characteristics. Pearson’s product moment correla-
tions between levels of hope and cancer pain intensity, anxi-
ety, depression, spiritual well-being, and demographic
variables were determined. Based on the patient sample size,
the study achieved power to detect a moderate correlation
(r = 0.25–0.30) at 80% power.33 All tests were two-tailed with
an alpha = 0.05.
A multivariate linear regression model was constructed to
evaluate the effects of potential confounders that might sys-
tematically bias the association found between pain intensity
and HHI scores in the univariate analysis. Each of the vari-
ables of interest had skewness values less than twice their
standard errors, consistent with normal distributions. Hence,
we proceeded with parametric analyses. The dependent var-
iable in the model was HHI score. The predictors were se-
lected by including demographic and clinical variables
deemed important a priori (i.e., age, gender, education, mar-
ital status, religion, and the presence of metastatic disease),
then clinical predictor variables most highly correlated in the
168 RAWDIN ET AL.
univariate correlational analyses (HADS scores, SSCP score,
worst pain in the last week, and pain interference with mood
and function). Multicollinearity was assessed for these vari-
ables with the use of correlation matrices and variance infla-
tion factors, as well as the possibility of interaction between
pain variables included in the model and depression scores.
The final model for the sake of parsimony retained only those
factors found to be statistically significant predictors with a p
value of < 0.05. An overall goodness of fit of the regression
model was calculated.
Results
Patient enrollment
From a convenience sample of SMS patients, 95 patients
were approached to participate and 78 (82%) agreed to par-
ticipate, provided written informed consent, and completed
the questionnaires. Eleven patients (12%) were not enrolled in
the study because they either did not meet the inclusion cri-
teria (n = 4) or declined to participate (n = 7). In addition, six
surveys (6%) were not included in the sample because the
questionnaire was inadequately completed, whether due to
inadvertent omission of key survey elements (n = 2), patients’
time constraints (n = 2), or the patients’ feeling ‘‘too ill’’ to
continue (n = 2). Of the seven patients (7%) who declined to
participate, four did so out of concerns about privacy and/or
reluctance to participate in research more generally. The other
three cited feeling ‘‘too ill’’ or ‘‘too stressed-out.’’
Demographic characteristics
The sample consisted of 64% women and 36% men with a
mean age of 57.6 years (standard deviation [SD] = 13.0)
(Table 1). Nearly 60% of the sample patients were between
the ages of 40 and 64; 32% were ‡ 65 years of age and 9%
were < 40. Representative of the SMS patient population,
69.2% of patients self-identified as white, 10.3% African
American, and 7.7% Asian. The sample patients were highly
educated with 83% having completed college or graduate
school. Over half (52.6%) of the sample patients were mar-
ried or partnered. In terms of religious affiliation, 37.2%
identified as Christian, 14.1% as Jewish, 11.5% as Buddhist,
7.7% as other (usually denoted as ‘‘spiritual’’ by patients),
and 29.5% as ‘‘none.’’
Clinical characteristics
The three most common cancer diagnoses were breast
(28.2%), gynecologic (16.7%), and prostate (15.4%), which is
reflective of the proportions within the SMS at large. Two-
thirds of the patients (66.7%) had metastatic disease.
The majority (87.2%) of the sample patients had pain due to
the cancer or its treatment. The mean pain score among those
with pain over the past week was 3.4 (SD = 2.5) (Table 2). The
mean level of pain at the time of the survey and at its worst
was 2.8 (SD = 2.7) and 4.7 (SD = 3.4), respectively. The mean
total HHI score was 38.2 (SD = 5.09). The mean level of spiri-
tual well-being was 3.3 (SD = 1.01).
Patients had a mean score of 14.3 on the HADS (SD = 6.3)
with 6.6 on the depression subscale (SD = 3.5) and 7.7 on the
anxiety subscale (SD = 3.8). Nearly 50% of patients had scores
in the normal range on the HADS anxiety subscale, 28% had
borderline scores, and 23% had abnormal scores (Table 3). On
the HADS depression subscale, 56% of patients had levels in
the normal range, 31% of patients scored in the borderline
range, and 12% in the abnormal range.
Associations between levels of hope
and demographics, clinical characteristics,
symptoms, and spiritual well-being scores
Among the demographic variables (i.e., age, gender, eth-
nicity, marital status, religion, and education level), only ed-
ucation level showed a significant univariate correlation with
HHI scores (Table 3). Higher education level was associated
with higher HHI scores (r = 0.26, p = 0.02). HHI was not as-
sociated with the presence of metastatic disease.
Among pain variables, total HHI scores were negatively
correlated with ratings of worst pain over the last week (r =
- 0.28, p = 0.01), average pain over the last week (r = - 0.27,
p = 0.01), and with all BPI pain interference items except level
Table 1. Descriptive Data for the Sample
Characteristic n %
Gender
Women 50 64.10%
Men 28 35.90%
Education
Middle school 1 1.28%
High school 12 15.38%
College 39 50.00%
Graduate degree 26 33.33%
Marital Status
Single 37 47.44%
Married/partnered 41 52.56%
Religion
Buddhist 9 11.54%
Christian 29 37.18%
Jewish 11 14.10%
Hindu 0 0%
Muslim 0 0%
None 23 29.49%
Other 6 7.69%
Primary Cancer
Brain 3 3.85%
Breast 22 28.21%
Gastrointestinal 3 3.85%
Gynecologic 13 16.67%
Head/Neck 8 10.26%
Hematologic 2 2.56%
Lung 5 6.41%
Other 5 6.41%
Prostate 12 15.38%
Urological 5 6.41%
Age
age < 40 7 8.97%
age 40-64 46 58.97%
age 65 + 25 32.05%
Metastatic Disease
No 26 33.33%
Yes 52 66.67%
Ever Had Pain Related
to Present Illness?
No 10 12.82%
Yes 68 87.18%
HOPE, PAIN, DISTRESS, AND SPIRITUAL WELL-BEING IN
ONCOLOGY OUTPATIENTS 169
of interference with relationships: work (r = - 0.23, p = 0.04),
sleep (r = - 0.25, p = 0.03), enjoyment (r = - 0.25, p = 0.02),
ability to walk (r = - 0.28, p = 0.01), mood (r = - 0.33, p =
0.004),
and general function (r = - 0.28, p = 0.01).
Depression and anxiety each were negatively correlated
and spiritual well-being positively correlated with total HHI
scores with correlations of - 0.56, - 0.48, and 0.52, respec-
tively, each with p values of < 0.001.
The multivariate linear regression models constructed to
predict HHI score (Table 4) indicate that spiritual well-being
scores and depression scores were statistically significant
predictors of hope. In the final model (Table 4B) SSCP score
had a b coefficient of 1.55 ( p < 0.01), and HADS depression
score had a b coefficient of - 0.63 ( p < 0.01). The overall ad-
justed R2 for the model was 0.38, p < 0.001. Pain intensity, BPI
functional interference scores, gender, education, marital
status, religious affiliation, metastatic disease, and HADS
anxiety scores though initially included in the model were
ultimately not statistically significant, and hence not retained
in the final regression model. Of note, there were no signifi-
cant multiplicative interactions found between pain severity
scores and HADS depression scores.
Discussion
This study is unique in that it is one of the few to examine
the relationship between hope and pain among cancer out-
patients in the United States, and to our knowledge, the only
one of these to also consider spirituality. We also utilized
multivariate linear regression to assess confounding by vari-
ous demographic and clinical factors. We found that symp-
toms of depression and spiritual well-being independently
predicted levels of hope, eclipsing the univariate correlation
between pain severity and hope initially observed.
The pain and levels of hope found in this study are similar
to those found in prior literature, which suggests some degree
of generalizability. The mean hope level found in this study’s
patient population was in the upper range but comparable to
those found in other studies with HHI scores ranging between
32.5 and 39.17–20,34–36 The average pain score in the study
population was also well within the range found in other
Table 2. Scores for Pain, Hope, Depression,
Anxiety, and Spiritual Well-Being
N Mean SD Min Max
BPI
Average Pain Over
the Last Week
78 3.38 2.45 0 9
Current Level of Pain 78 2.79 2.68 0 9
Worst Pain in Last Week 78 4.67 3.35 0 10
HHI 78 38.22 5.09 28 48
SSCP 77 3.32 1.01 1 5
HADS (Total Score) 77 14.28 6.33 2 31
HADS - Depression Subscale* 77 7.66 3.84 0 15
HADS - Anxiety Subscale* 77 6.62 3.5 1 16
*HADS subscale scores between 0 and 7 is ‘‘normal,’’ 8–10 is
‘‘borderline abnormal,’’ and 11–21 is ‘‘abnormal.’’
Table 3. Univariate Correlations with HHI
r p-value* n
Demographics
Married 0.14 0.24 78
Higher Educational Level 0.26 0.02 78
Male Gender 0.06 0.60 78
Age 0.09 0.42 78
Clinical Characteristics
Metastatic Cancer 0.10 0.38 78
Presence of pain due to cancer - 0.01 0.91 78
Worst pain over last 1 week - 0.28 0.01 78
Average pain over last 1 week - 0.27 0.01 78
Pain right now - 0.2 0.08 78
Pain Interference With Function
Work - 0.23 0.04 78
Relationships - 0.20 0.08 78
Sleep - 0.25 0.03 78
Enjoyment - 0.25 0.02 78
Ability to Walk - 0.28 0.01 78
Mood - 0.33 < 0.01 77
General Function - 0.28 0.01 78
HADS (Total Score) - 0.62 <0.01 78
Depression subscale - 0.56 <0.01 77
Anxiety subscale - 0.48 <0.01 77
SSCP 0.52 <0.01 77
*Bold indicates p < 0.05.
Table 4A. Initial Multivariate Linear Regression
Model for HHI Score
Regression variables ß (SE) p-value
Age - 0.05 (0.04) 0.26
Gender (0 = female; 1 = male) - 1.29 (1.04) 0.22
Marital status (0 = single;
1 = married)
1.68 (1.00) 0.10
Metastatic cancer (0 = no; 1 = yes) 1.02 (1.03) 0.33
Any religious affiliation
(0 = no; 1 = yes)
- 0.08 (1.10) 0.95
Education (0-less than college;
1 = at least college degree)
2.48 (1.43) 0.09
Pain (worst in last week) - 0.09 (0.23) 0.69
SSCP 1.46 (0.62) 0.02
HADS- Depression Score - 0.55 (0.16) <0.01
HADS- Anxiety Score - 0.23 (0.19) 0.24
Pain interference w/ general
function
- 0.01 (0.26) 0.97
Pain interference w/ mood 0.16 (0.27) 0.57
R = 0.70, R2 = 0.49; adj R2 = 0.40.
F(12,62) = 5.03; p < 0.001.
Table 4B. Final Multivariate Linear Regression
Model for HHI Score
ß (SE) p-value
SSCP 1.55 (0.53) <0.01
HADS- Depression Score - 0.63 (0.15) <0.01
R = 0.63, R2 = 0.39; adj R2 = 0.38.
F(2,73) = 23.72; p < 0.001.
170 RAWDIN ET AL.
related studies.17,21,34,35 Our results expand on the existing
research in this field by incorporating additional psycho-
spiritual factors into the assessment of the relationship be-
tween pain and hope. These findings clarify the suggestion in
recent literature that hope is related most closely to psycho-
social elements of the pain experience, rather than pain
intensity.20,21
Among its limitations, our study was cross-sectional. To
further explore the causal links between hope, pain, and psycho-
spiritual factors, a longitudinal study would be ideal.
Additionally, this study was limited by the recruitment pool
available within the study site, and the demographics of our
population under-represented certain minority groups. This
study did not control for certain cancer-related symptoms ex-
perienced by patients, such as nausea, dry mouth, insomnia,
anorexia, weight loss, and fatigue, which are other potential
confounders of the relationship between pain and hope. Also,
we
did not control for patients’ beliefs regarding their prognoses,
although we did record diagnoses and were able to control for
the presence of metastases. A final limitation of this study is
that
we minimized the time burden on patients by using a single-
item
probe of spiritual well-being. To further explore the complex
dimensions of spiritual beliefs would require more extensive
quantitative measures than the SSCP or qualitative methods.
The lack of congruency between the univariate correlations
and multivariate modeling in this study highlights the im-
portance of measuring and accounting for factors in multiple
domains simultaneously. Based on our findings, we deduce
that depressive symptoms and spiritual well-being mediate
patients’ experiences of pain, influencing their beliefs about,
attitudes toward, and interpretations of pain. As the experi-
ence of pain is a subjective phenomenon, the affective and
cognitive filtering of pain likely matters more than measure-
able nociceptive and neuropathic intensity in relationship to
levels of hope.37,38
This study buttresses the notion forwarded by other re-
searchers that patients may maintain a sense of hope even
while cancer pain and other symptoms progress, as a function
of cognitive-affective and psycho-spiritual resources and re-
siliency.39 On a practical note, this study suggests that when
confronted with a patient who seems to have ‘‘lost hope,’’ the
physician should look beyond pain measures and explore
psychological adjustment and spiritual concerns. Further-
more, interventions to sustain or promote hope among cancer
patients with pain should carefully consider the role of mental
and spiritual health and well-being.
Acknowledgments
This research was supported by the School of Medicine and
the Department of Psychiatry at University of California, San
Francisco, as well as National Institutes of Health (NIH)
training grant R25060482. The authors would like to express
their deep appreciation to Professor Christine Miaskowsi for
reviewing and editing a draft of this manuscript, and to Jodi
Ross, who assisted with data collection. We also thank the
participants and staff of the UCSF Helen Diller Family Com-
prehensive Cancer Center.
Author Disclosure Statement
No competing financial interests exist.
References
1. Nowotny ML: Every tomorrow, a vision of hope. J Psycho-
soc Oncol 1991;9:117–127.
2. Fanos JH, Gelinas DF, Foster RS, Postone N, Miller RG:
Hope in palliative care: From narcissism to self-transcendence
in amyotrophic lateral sclerosis. J Palliat Med 2008;11:
470–475.
3. Axelsson B, Sjoden PO: Quality of life of cancer patients and
their spouses in palliative home care. Palliative Med
1998;12:29–39.
4. Brandt BT: The relationship between hopelessness and se-
lected variables in women receiving chemotherapy for
breast cancer. Oncol Nurs Forum 1987;14:35–39.
5. Farran CJ, Herth KA, Popovich JM: Hope and Hopelessness:
Critical Clinical Constructs. Thousand Oaks, CA: Sage Pub-
lications, 1995.
6. Taylor EJ: Factors associated with meaning in life among
people with recurrent cancer. Oncol Nurs Forum
1993;20:1399–1405; discussion 1406–1407.
7. Udelman DL, Udelman HD: A preliminary report on anti-
depressant therapy and its effects on hope and immunity.
Soc Sci Med 1985;20:1069–1072.
8. Herth KA: The relationship between level of hope and level
of coping response and other variables in patients with
cancer. Oncol Nurs Forum 1989;16:67–72.
9. Bishara E, Loew F, Forest MI, Fabre J, Rapin CH: Is there a
relationship between psychological well-being and patient-
carers consensus? A clinical pilot study. J Palliat Care
1997;13:14–22.
10. Post-White J: How hope affects healing. Creative Nurs
2003;9:10–11.
11. Breitbart W, Rosenfeld B, Pessin H, et al.: Depression,
hopelessness, and desire for hastened death in terminally ill
patients with cancer. JAMA 2000;284:2907–2911.
12. Gil S, Gilbar O: O. Hopelessness among cancer patients. J
Psychosoc Oncol 2001;19:21–33.
13. Dufault K, Martocchio BC: Symposium on compassionate
care and the dying experience. Hope: Its spheres and di-
mensions. Nurs Clin North Am 1985;20:379–391.
14. Butt CM: Hope in adults with cancer: State of the science.
Oncol Nurs Forum 2011;38:E341–E350.
15. Chi GC: The role of hope in patients with cancer. Oncol
Nurs
Forum 2007;34:415–424.
16. Berendes D, Keefe FJ, Somers TJ, Kothadia SM, Porter LS,
Cheavens JS: Hope in the context of lung cancer: Relation-
ships of hope to symptoms and psychological distress. J Pain
Symptom Manage 2010;40:174–182.
17. Chen ML: Pain and hope in patients with cancer: A role for
cognition. Cancer Nurs 2003;26:61–67.
18. Hsu TH, Lu MS, Tsou TS, Lin CC: The relationship of
pain, uncertainty, and hope in Taiwanese lung cancer pa-
tients. J Pain Symptom Manage 2003;26:835–842.
19. Lin CC, Lai YL, Ward SE: Effect of cancer pain on perfor-
mance status, mood states, and level of hope among Tai-
wanese cancer patients. J Pain Symptom Manage 2003;25:
29–37.
20. Utne I, Miaskowski C, Bjordal K, Paul SM, Jakobsen G,
Rustoen T: The relationship between hope and pain in a
sample of hospitalized oncology patients. Palliat Support
Care 2008;6:327–334.
21. Utne I, Miaskowski C, Bjordal K, Paul SM, Rustoen T: The
relationships between mood disturbances and pain, hope,
and quality of life in hospitalized cancer patients with pain
HOPE, PAIN, DISTRESS, AND SPIRITUAL WELL-BEING IN
ONCOLOGY OUTPATIENTS 171
on regularly scheduled opioid analgesic. J Palliat Med
2010;13:311–318.
22. Chochinov HM, Cann BJ: Interventions to enhance the
spiritual aspects of dying. J Palliat Med 2005;8(Suppl 1):
S103–S115.
23. Buckley J, Herth K: Fostering hope in terminally ill
patients.
Nurs Stand 2004;19:33–41.
24. Field MJ, Cassel CK: Approaching death: Improving care at
the end of life. Health Prog 2011;92:25.
25. McClement SE, Chochinov HM: Hope in advanced cancer
patients. Eur J Cancer (Oxford, England: 1990) 2008;44:1169–
1174.
26. Fehring RJ, Miller JF, Shaw C: Spiritual well-being,
religiosity,
hope, depression, and other mood states in elderly people
coping with cancer. Oncol Nurs Forum 1997;24:663–671.
27. Nelson CJ, Rosenfeld B, Breitbart W, Galietta M:
Spirituality,
religion, and depression in the terminally ill. Psychosomatics
2002;43:213–220.
28. Mystakidou K, Tsilika E, Parpa E, et al.: Exploring the re-
lationships between depression, hopelessness, cognitive
status, pain, and spirituality in patients with advanced
cancer. Arch Psychiatr Nurs 2007;21:150–161.
29. Herth K: Abbreviated instrument to measure hope: Devel-
opment and psychometric evaluation. J Advanced Nurs
1992;17:1251–1259.
30. Cleeland CS, Ryan KM: Pain assessment: Global use of the
Brief Pain Inventory. Ann Acad Med, Singapore 1994;23:
129–138.
31. Snaith RP, Zigmond AS: The hospital anxiety and depres-
sion scale. Br Med J (Clin Res Ed) 1986;292:344.
32. Steinhauser KE, Voils CI, Clipp EC, Bosworth HB,
Christakis
NA, Tulsky JA: ‘‘Are you at peace?’’: One item to probe
spiritual concerns at the end of life. Arch Intern Med 2006;
166:101–105.
33. Faul F, Erdfelder E, Lang AG, Buchner A: G*Power 3: A
flexible statistical power analysis program for the social,
behavioral, and biomedical sciences. Behav Res Methods
2007;39:175–191.
34. Ebright PR, Lyon B: Understanding hope and factors that
enhance hope in women with breast cancer. Oncol Nurs
Forum 2002;29:561–568.
35. Lai YH, Chang JT, Keefe FJ, et al.: Symptom distress, cata-
strophic thinking, and hope in nasopharyngeal carcinoma
patients. Cancer Nurs 2003;26:485–493.
36. Sanatani M, Schreier G, Stitt L: Level and direction of hope
in cancer patients: An exploratory longitudinal study. Sup-
port Care Cancer 2008;16:493–499.
37. Boogaard S, Heymans MW, Patijn J, et al.: Predictors for
persistent neuropathic pain—a Delphi survey. Pain Physi-
cian 2011;14:559–568.
38. Basinski A, Stefaniak T, Stadnyk M, Sheikh A, Vingerhoets
AJ: Influence of religiosity on the quality of life and on pain
intensity in chronic pancreatitis patients after neurolytic ce-
liac plexus block: Case-controlled study. J Relig Health 2011
Feb 1 [Epub ahead of print].
39. Block SD: Perspectives on care at the close of life. Psycho-
logical considerations, growth, and transcendence at the end
of life: The art of the possible. JAMA 2001;285:2898–2905.
Address correspondence to:
Blake Rawdin, MD, MPH
University of California, San Francisco
Langley Porter Hospital and Clinics
401 Parnassus Avenue
Box 0984-RTP
San Francisco, CA 94143
E-mail: [email protected]
172 RAWDIN ET AL.
Copyright of Journal of Palliative Medicine is the property of
Mary Ann Liebert, Inc. and its content may not be
copied or emailed to multiple sites or posted to a listserv
without the copyright holder's express written
permission. However, users may print, download, or email
articles for individual use.
read_and_evaluate_the_following_research_articles1.docx
Read and evaluate the following research articles:
· Rawdin, B., Evans, C., & Rabow, M. W. (2013). The
relationships among hope, pain, psychological distress, and
spiritual well-being in oncology outpatients. Journal of
Palliative Medicine, 16(2), 167-172. doi:10.1089/jpm.2012.0223
Link to Article
· Ferreira, V. M., & Sherman, A. M. (2007). The relationship of
optimism, pain and social support to well-being in older adults
with osteoarthritis. Aging & Mental Health, 11(1), 89-98.
doi:10.1080/13607860600736166
Link to Article
Apply the concepts explored in the articles above by writing a
2-3 page paper in APA format using proper spelling and
grammar. Your paper should address the following:
1. Examine the concept of psychological well-being as it relates
to the experience of pain and stress.
2. Explore how optimism, hope, distress, and social support
play a role in how people experience pain and stress. Be sure to
discuss how these elements of psychological well-being
contribute to overall physical and mental health.
3. Be sure to reference specific concepts from the articles. Use
in-text citations and provide APA formatted References as
appropriate.
Please refer to Rasmussen's APA Guide located on
the Resourcestab for information regarding APA format as well
as APA referencing and citation procedures.
Submit your completed assignment to the drop box below.
Please check the Course Calendar for specific due dates.
Save your assignment as a Microsoft Word document. (Mac
users, please remember to append the ".docx" extension to the
filename.) The name of the file should be your first initial and
last name, followed by an underscore and the name of the
assignment, and an underscore and the date. An example is
shown below:
Jstudent_exampleproblem_101504
Lesson II
Getting Started with Stats
Why Might You Be Involved in Doing Statistical
Research?Manager as research-based decision
makerSubordinate employee as researcherManager as research
services buyer/evaluatorManager as evaluator of secondary data
sourcesResearch specialist
Research Defined
A systematic inquiry at providing information to solve
managerial problemsBeginning researchers should understand
that research is a process of reasoning with factsI like to “let
the data speak to me.”What did you find from your articles for
tonight?
There is much you can do, but what SHOULD you do?
What is the decision dilemma we face?
What can research tell us/accomplish?
How do we define “best”? What type of study do we need to do?
Reporting
Descriptive
Explanatory
Predictive
Research Defined continued…
Basic vs. applied research
Basic – aims to discover new knowledge in a more general
sense; scientists
Applied – an effort to solve an immediate problem; to make a
particular management decision Primary vs. Secondary
researchInitial research vs. Problem solvingSurvey vs.
Experimental research
Research Defined continued…
The Role of Statistics in Research“Statistical thinking is
necessary…for effective decision making in various facets of
business”The science of collecting, organizing, presenting,
analyzing, and interpreting data to assist in making more
effective decisionsCan be to capture a population’s
characteristics & make inferences from a sample’s
characteristicsMany firms have data they don’t mine for regular
decision making insights.
Some ExamplesYou work for Books R Us and have been asked
to look at their sales data to see how to boost sales.What
questions do we need to ask?
To what purpose will the research be put
How do I shape my research to provide valid, quantifiable
results?
If I do an opinion survey, how many people do I need to ask?
How do I craft my questions?
How have similar studies been conducted in the past?
Questions to Ponder…What types of research does your
organization use?How can research help your organization save
money?Do you feel that the amount of research being conducted
has increased or decreased over the past 10 years?How has the
Internet changed the quality of quantity of research?
Creating a Research Plan and Design
Time Series Data for the Economy – in class exercise.
Research DesignsThe general research process contains three
major stages:
Exploration of the situation
Collection of data
Analysis and interpretation of the resultsWhat questions do the
data prompt you to ask?Research study idea: What events
triggered changes in key indicators (i.e., oil prices)? How do
variables interrelate (i.e., inflation, personal taxes & GDP?)
Research DesignsThe essentials of a research design
What data do we need?
Is the data available?
Do we need to “massage” it?
Is it longitudinal vs. cross sectional (which was the Econ data
and the Gas price data)?Quantitative vs. qualitative data
Research Methods
Exploratory StudiesUseful when we lack a clear idea of the
problemSaves time and money Relies more heavily on
qualitative techniquesAn exploratory study is finished when we
have achieved the following:
Established the major dimensions of the task
Defined a set of investigative questions to guide a detailed
research design
Developed several hypotheses about possible causes of the
management dilemma May use a focus group.
Case StudiesMuch of what you’ve done so far at UOP has been
of this nature.Can be qualitative or quantitative.Will tend to use
primary data, but can also use secondary data
What kind of data is the Gas Station data?
What kind of data are the Econ stats?
You might need to interview people – what questions do you
ask & how ask them?
Descriptive StudiesMore formalized study with clearly stated
hypothesis or investigative questionsDescriptions of phenomena
associated with a subject population - subjectsDiscovery or
associations among different variables – correlational studyHow
is this different from a causational study?
Need to ask: Do the variables interact/effect each other?
In other words, can the “dependent variable” impact or effect
the “independent variable”
Causal StudiesHow one variable affects, or is responsible for,
changes in another variablePossible variable relationships
Symmetrical – no direct link, but fluctuate together
Reciprocal – when 2 variables mutually influence or reinforce
each other
Asymmetrical – changes in one variable are responsible for
changes in another
Questions to Ponder…When is it appropriate to use exploratory
research?Descriptive research is usually used in the marketing
and sales business functions. What other areas might
descriptive research be used?When conducting causal research,
how can researchers keep variables constant throughout the
entire research period?What factors should be considered when
conducting a longitudinal study?Can decision-making be
accomplished by using only cross-sectional research?
Theory Building
TheoryTheory – set of systematically interrelated concepts,
definitions, and propositions that are advanced to explain and
predict factsOur ability to make rational decisions is measured
by the degree to which we combine fact and theory, each of
which is necessary for the other to be of valueFor our purposes,
it is helpful to do a literature search of studies that are similar
in nature to see what “guiding principles” we can glean – we
will not be looking to expand the academic literature by coming
up with a new theory.
Reasoning
Deductive reasoning – form of inference; the conclusion must
necessarily follow for the reasons given; imply the conclusion
and represent a proofFor a deduction to be correct, it must be
both true and valid:
Premises (reasons) given for the conclusion must agree with the
real world (true)
The conclusion must necessarily follow from the premises
(valid)Use Research to avoid Thoughtless Thinking!
Inductive vs. Deductive Thinking
Induction vs. Deduction Cont.
Deduction: If A = B, and B = C then A = C
The conclusion is contained in the premise.
If we deny the premise, we deny the conclusion.
Induction: A conclusion drawn from one or more facts.
The conclusion explains the facts.
The facts support the conclusion
What Causes Societal Dysfunction?
“Data Correlations show that in almost all regards, the highly
secular democracies consistently enjoy low rates of societal
dysfunction, while pro-religious and anti-evolution America
performs poorly.” http://moses.creighton.edu/JRS/2005/2005-
11.html
“Since 1962-63 … the judicial rejection of natural law and the
embracing of relativism, the United States has become number
one in the world in violent crime, divorce, and illegal drug use.”
(Barton, David: The Myth of Separation, p. 217, © 1992)
What causes societal dysfunction in the U.S.? What is your
theory?
Hypothesis TestingHypothesis - A tentative explanation for an
observation, phenomenon, or scientific problem that can be
tested by further investigationRole of the hypothesis
Guide the study
Identifies relevant factors
Leads to data collection
Frames work in which to organize conclusions
Refining the Research Problem
Operational DefinitionsRequires the use of concepts, constructs,
and definitions; building blocks of theoryConcept – a generally
accepted collection of meanings or characteristics associated
with certain events, objects, conditions, situations, and
behaviorsThe success of research hinges on:
How clearly we conceptualize and how well others understand
the concepts we use
The challenge is to develop concepts that others will clearly
understand
Concepts and Constructs
Constructs Is an image or idea specifically invented for a given
research and/or theory building purposeOperational definitions
– stated in terms of specific testing or measurement
criteriaVariables – used as a synonym for construct; a symbol to
which we assign numerals and values
BenchmarkingA search for best practices that leads to superior
performance; measurementApplied to many areas
goods and services
business processes
performance measuresKey steps in benchmarking
planning, analysis, integration, action, and maturityTypes of
benchmarking
internal, competitive, functional, and generic
Let’s Develop a Bus. Research Problem: Sell More Phone/Data
LinesConstruct
Market share of lines
Install timeframe
Sales activity level
Pricing
Customer service quality Benchmarks
Market breakeven %
% of orders installed in X time frame
10 new appoint/wk.
10% below SBC Price
2 hr. response time
Learning ObjectivesWhat is the Difference between Descriptive
and Inferential Statistics?What is a Binomial Distribution and
how it relates to StatsWhat is the Variance and Standard
DeviationAn Introduction to the Concept of a Z Distribution
Table
StatisticsThe science of collecting, organizing, presenting,
analyzing, and interpreting data to assist in making more
effective decisionsDescriptive stats – methods for organizing,
summarizing, and presenting data in an informative
wayInferential stats – methods used to determine something
about a population, based on sample
Descriptive StatisticsWith Descriptive Statistics you are simply
describing “what is” or “what the data show.”For example,
“60% of people survey said they prefer Coke”. Or “Both Social
Security and Defense Spending make up 21% of the federal
budget.”
Example of Gas Price DataGas Station NameDayDateTime of
DayLocationGas Price Gas AmericaMonday3/8/2010Morning
21st and Franklin Rd.$2.58 BP Gas
StationTuesday3/9/2010Afternoon21st and Post Rd.$2.75 BP
Gas StationSunday3/7/2010Morning21st and Post Rd.$2.59
Admiral Gas StationTuesday3/9/2010AfternoonE. 21st
Street.$2.59 Marathon Gas StationMonday3/8/2010Evening21st
and Mithoeffer Rd.$2.69 Shell Gas
StationTuesday3/9/2010Afternoon21st and Post Rd.$2.75 Circle
KTuesday3/9/2010Afternoon96th & Meridean$2.75 Meijer Gas
StationSaturday3/6/2010MorningRockville & Raceway$2.62
Speedway Gas StationTuesday3/9/2010AfternoonRockville &
Girlschool$2.69 Speedway Gas
StationTuesday3/9/2010MorningSt. Rd. 32$2.67
Each row is a “case”. Variables are across the top. Which one
is a quantitative measure? Which is qualitative? See p. 4 and 5
*
Inferential StatisticsWith Inferential Statistics you are asking
the data to “speak to you” to infer from the sample data certain
characteristics about the population we are studying. For
example, the formula to the right measures the variation or
dispersion of data above and below the population mean.
2 = S (x- µ)2
N
µ
Variance of a Population
How Long does it Take to Catch a Fish?
µ
Let’s take 4 samples on different parts of the lake to estimate
“The Truth”.
30 seconds
30 min.
1 hour
2 hours
The Impact of StatisticsPositive
Data translation into useful information
Answers questions of uncertainty
Constructive hedgingNegative
Misleading
Abusive
Preemptive bias
The Impact of Statistics continued…Personal
“You might not want to use statistics, but statistics are being
used on you”
Buyer behavior
Product availability
Wage determination
Actuarial tables’ influence on insurance products
Queuing theory
Variables
Types of Variables
Categorical Places individual into one of several groups or
categories
Attribute – gender, age, ethnicity, education levelQuantitative:
Takes Numerical values, allowing adding and calculating
averages
Continuous – can take on fractional values; infinite number of
values b/n units on the scale; always an approximate; height
Types of Variables Variable – trait, attribute that can take on
different values at different timesConstant variable – doesn’t
changeQualitative – based on qualities that can be classified but
not measured; difference of types of kinds; genderQuantitative
– measurable differences in amountDiscrete – no possible
values b/n adjacent units on the scale (whole #’s); dichotomous;
marital status
Flip a coin 10 times.: Either heads or tails (1 or 0)
Results in a Binomial Distribution
Analogy: Product either perfect or imperfect.
We can run statistical tests to predict the probability of H or T,
Good or Bad
Types of Variables continued…Control – most important in
research study; most difficult implications of studyIndependent
– research systematically manipulates; experimental treatment;
measure to observe effect of dependant variableDependant –
researcher measures to observe the effects of independent
variableIntervening or modifying – originates within subject;
psychological or emotional reaction; can cause errors in study;
fear, anxiety, anger, etc. Need to control by getting to know
people, developing rapportExtraneous or confounding – Appears
to be related, but in fact is not related. Can lead to false
conclusions.
Make a List of Variables for Gas Price Data…Make a list of the
variables for your team project.What type of variable are
they?How will you collect the data? What do you know about
the data source? – Would someone dispute this data, recommend
other data to consider, or a different research design to analyze
it?
What Type of Data?
Levels of Measurement Measurement – procedure for assigning
a value (numbers) to an observation (variable) according to
certain rulesNominal – categories are mutually exclusive
Male vs. Female, Yes vs. NoOrdinal – categories have a logical
order
Likert Scale, 1 – 5, Strongly Agree to Strongly Disagree (is Bob
a good prof.?)Interval – equal distance between categories
Time, temp.Ratio – True Zero point exits
Height, weight, distance
Ratio AnalysisHandout of moving average of GDP.Analyze the
Books R Us data – 3 week moving average. (This is on “Books
R US Raw Data” excel file.How do we put this into a research
question that allows us to collect & analyze data?How will we
measure the data we collect?
Role of Statistics
The Language of Statistics DistributionBar GraphHistogram
Pareto ChartTime PlotCross-sectional dataQuartileBox
PlotVariance Coefficient of VariationResistant MeasureDegrees
of freedom
Definitions in StatisticsPopulationSampleStandard deviation
Normal DistributionStatistic versus
parameterRandomMeanMedianModeRight Skew Left
SkewStemplot
hypothesis test! = FactorialH0 = Null hypothesisH1 = Alternate
hypothesis
Measures of Central TendencyCentral Tendency – the tendency
of a set of data to center around certain numerical valuesMean –
computed by summing all the observations in the sample and
dividing the sum by the number of observations; considers the
magnitude of each observation Median – is the observation that
divides the distribution into equal parts; most typical
observation in a distributionMode – the observation that occurs
most frequently; if all the values are different, there is no mode
Means, Medians, and Modes
Age252830303334
Mean =30
Median = 30
Mode = 30
Mean
Median
Mode
Frequency
SX
N
µ =
25+28+30+30+33+34
6
= 30
Measures of Central TendencyThe idea is that the sum of the
differences between any given observed value & the mean =
0S(X –
up to 0?
Calculate Deviation Scores
25 28 30 33 34
-2 +3
-5 +4xx - µ25(25-30)-528(28-30)-230(30-30)030(30-
30)033(33-30)334(34-30)4180/6=300
Population Variance & Population Standard
DeviationPopulation variance – can be used to compare
dispersion in 2 or more sets of observations
On average, 1 standard deviation in student’s ages is 3.0 years
from the mean of 30 years. Population Standard deviation –
square root of the variance (the more alike they are, more
reliable they are)
The value s = 3.0 indicates, that on average, observations fall
3.0 units + or - from the mean
9 = 3
= S (x- µ)2
N
Measures of Dispersion
2 = S (x- µ)2
N
= 54 = 9 variance
6
9 = the measure of variability that indicated how much all of the
scores in a distribution typically deviate or vary from the mean
Population variance also know as ‘mean deviation’ (mean of
squared deviation from the mean)xx - µ(x- µ)225-52528-
2430003000333934416180054
Sample Variance
Properties of the “s”
Gives a measure of dispersion relative to the mean
Sensitive to each score in the distribution
If a score is moved closer to the mean, then the standard
deviation will decrease, if the score shifts away from mean, the
standard deviation increases
3. Tends to underestimate the population variance, so provide
an appropriate correction by subtracting 1 from total
observations (n-1)
Sample Variance Example
s2 = S (X - X )2
n – 1 Sample
variance formula
54
(5-1)
Variance: 13.5 yrs
Standard Deviation: 13.5 = 3.67 yrsxx - x(x-x)2x225-
52562528-247843000900333910893441611561500544554
Let’s Analyze Class AgesMean and Standard Deviation For 5
Learning
TeamsTeam1Team2Team3Team4Team524353135443134244427
302427312547222442272924212125
Calculate means and Standard Deviations.
Create a bar chart
Create a histo gram
Create a Pareto Chart
*
Bar Chart
Chart1Team1Team2Team3Team4Team5
Bar Chart
32.2
28.75
26
33
28.8
Class agesMean and Standard DeviationFor 5 Learning
TeamsClass
AverageTeam1Team2Team3Team4Team5243531354431342444
27302427312547222442272924212125Mean32.228.75263328.8
29.92Sample Stand
Deviation8.70057469376.70198975433.08220700159.14330356
058.84307638787.4238534468Coefficient of
Var0.2702041830.23311268710.11854642310.27706980490.307
05126350.2481234441Note that you go to "Insert" then
"Function" then "Average"to get the formula for the mean.For
contentserver__5_.pdfAging & Mental Health, January 2007; .docx

More Related Content

Similar to contentserver__5_.pdfAging & Mental Health, January 2007; .docx

The association between a history of lifetime traumatic events and pain sever...
The association between a history of lifetime traumatic events and pain sever...The association between a history of lifetime traumatic events and pain sever...
The association between a history of lifetime traumatic events and pain sever...Paul Coelho, MD
 
O Astudypresentation
O AstudypresentationO Astudypresentation
O Astudypresentationgeorgiahoyler
 
CHRONIC PAIN in adolescents final
CHRONIC PAIN in adolescents finalCHRONIC PAIN in adolescents final
CHRONIC PAIN in adolescents finaljuliann trumpower
 
Anxiety Exercise Self Efficacy
Anxiety Exercise Self Efficacy Anxiety Exercise Self Efficacy
Anxiety Exercise Self Efficacy Marlene Garzona
 
Psychological Profiling Preop
Psychological Profiling PreopPsychological Profiling Preop
Psychological Profiling PreopPaul Coelho, MD
 
Over the past several decades
Over the past several decadesOver the past several decades
Over the past several decadeschirag patel
 
Elevated Catastrophizing predicts opioid misuse.
Elevated Catastrophizing predicts opioid misuse.Elevated Catastrophizing predicts opioid misuse.
Elevated Catastrophizing predicts opioid misuse.Paul Coelho, MD
 
Edwards et al-2006 Catastrophizing
Edwards et al-2006 CatastrophizingEdwards et al-2006 Catastrophizing
Edwards et al-2006 CatastrophizingPaul Coelho, MD
 
Catastrophizing and pain in arthritis, FMS, & other rheumatic diseases.
Catastrophizing and pain in arthritis, FMS, & other rheumatic diseases.Catastrophizing and pain in arthritis, FMS, & other rheumatic diseases.
Catastrophizing and pain in arthritis, FMS, & other rheumatic diseases.Paul Coelho, MD
 
Edwards et al-2006-arthritis_care
Edwards et al-2006-arthritis_careEdwards et al-2006-arthritis_care
Edwards et al-2006-arthritis_carePaul Coelho, MD
 
A Cognitive-Behavioral Treatment For Irritable Bowel Syndrome Using Interocep...
A Cognitive-Behavioral Treatment For Irritable Bowel Syndrome Using Interocep...A Cognitive-Behavioral Treatment For Irritable Bowel Syndrome Using Interocep...
A Cognitive-Behavioral Treatment For Irritable Bowel Syndrome Using Interocep...Sarah Marie
 
Relationship between cortisol, perceived stress, and mindfulness meditation
Relationship between cortisol, perceived stress, and mindfulness meditationRelationship between cortisol, perceived stress, and mindfulness meditation
Relationship between cortisol, perceived stress, and mindfulness meditationRachael Blais
 
Quantitative Analysis Template !Instructions When analyzing.docx
Quantitative Analysis Template !Instructions When analyzing.docxQuantitative Analysis Template !Instructions When analyzing.docx
Quantitative Analysis Template !Instructions When analyzing.docxamrit47
 
Would you be happier if you moved more? Physical activity focusing illusion
Would you be happier if you moved more? Physical activity focusing illusionWould you be happier if you moved more? Physical activity focusing illusion
Would you be happier if you moved more? Physical activity focusing illusionMaciej Behnke
 
Psychological determinants-of-problematic-outcomes-following-total-knee-arthr...
Psychological determinants-of-problematic-outcomes-following-total-knee-arthr...Psychological determinants-of-problematic-outcomes-following-total-knee-arthr...
Psychological determinants-of-problematic-outcomes-following-total-knee-arthr...Paul Coelho, MD
 
Temperament, Childhood Illness Burden, and Illness Behavior in.docx
Temperament, Childhood Illness Burden, and Illness Behavior in.docxTemperament, Childhood Illness Burden, and Illness Behavior in.docx
Temperament, Childhood Illness Burden, and Illness Behavior in.docxmanningchassidy
 
Temperament, Childhood Illness Burden, and Illness Behavior in.docx
Temperament, Childhood Illness Burden, and Illness Behavior in.docxTemperament, Childhood Illness Burden, and Illness Behavior in.docx
Temperament, Childhood Illness Burden, and Illness Behavior in.docxbradburgess22840
 
psy 430 research paper (final)
psy 430 research paper (final)psy 430 research paper (final)
psy 430 research paper (final)Tabitha C Smith
 
ALCohoL ReSeARCh C u r r e n t R e v i e w s506 Alcohol .docx
ALCohoL ReSeARCh C u r r e n t  R e v i e w s506 Alcohol .docxALCohoL ReSeARCh C u r r e n t  R e v i e w s506 Alcohol .docx
ALCohoL ReSeARCh C u r r e n t R e v i e w s506 Alcohol .docxADDY50
 

Similar to contentserver__5_.pdfAging & Mental Health, January 2007; .docx (20)

The association between a history of lifetime traumatic events and pain sever...
The association between a history of lifetime traumatic events and pain sever...The association between a history of lifetime traumatic events and pain sever...
The association between a history of lifetime traumatic events and pain sever...
 
O Astudypresentation
O AstudypresentationO Astudypresentation
O Astudypresentation
 
CHRONIC PAIN in adolescents final
CHRONIC PAIN in adolescents finalCHRONIC PAIN in adolescents final
CHRONIC PAIN in adolescents final
 
Anxiety Exercise Self Efficacy
Anxiety Exercise Self Efficacy Anxiety Exercise Self Efficacy
Anxiety Exercise Self Efficacy
 
Psychological Profiling Preop
Psychological Profiling PreopPsychological Profiling Preop
Psychological Profiling Preop
 
UROP Poster
UROP PosterUROP Poster
UROP Poster
 
Over the past several decades
Over the past several decadesOver the past several decades
Over the past several decades
 
Elevated Catastrophizing predicts opioid misuse.
Elevated Catastrophizing predicts opioid misuse.Elevated Catastrophizing predicts opioid misuse.
Elevated Catastrophizing predicts opioid misuse.
 
Edwards et al-2006 Catastrophizing
Edwards et al-2006 CatastrophizingEdwards et al-2006 Catastrophizing
Edwards et al-2006 Catastrophizing
 
Catastrophizing and pain in arthritis, FMS, & other rheumatic diseases.
Catastrophizing and pain in arthritis, FMS, & other rheumatic diseases.Catastrophizing and pain in arthritis, FMS, & other rheumatic diseases.
Catastrophizing and pain in arthritis, FMS, & other rheumatic diseases.
 
Edwards et al-2006-arthritis_care
Edwards et al-2006-arthritis_careEdwards et al-2006-arthritis_care
Edwards et al-2006-arthritis_care
 
A Cognitive-Behavioral Treatment For Irritable Bowel Syndrome Using Interocep...
A Cognitive-Behavioral Treatment For Irritable Bowel Syndrome Using Interocep...A Cognitive-Behavioral Treatment For Irritable Bowel Syndrome Using Interocep...
A Cognitive-Behavioral Treatment For Irritable Bowel Syndrome Using Interocep...
 
Relationship between cortisol, perceived stress, and mindfulness meditation
Relationship between cortisol, perceived stress, and mindfulness meditationRelationship between cortisol, perceived stress, and mindfulness meditation
Relationship between cortisol, perceived stress, and mindfulness meditation
 
Quantitative Analysis Template !Instructions When analyzing.docx
Quantitative Analysis Template !Instructions When analyzing.docxQuantitative Analysis Template !Instructions When analyzing.docx
Quantitative Analysis Template !Instructions When analyzing.docx
 
Would you be happier if you moved more? Physical activity focusing illusion
Would you be happier if you moved more? Physical activity focusing illusionWould you be happier if you moved more? Physical activity focusing illusion
Would you be happier if you moved more? Physical activity focusing illusion
 
Psychological determinants-of-problematic-outcomes-following-total-knee-arthr...
Psychological determinants-of-problematic-outcomes-following-total-knee-arthr...Psychological determinants-of-problematic-outcomes-following-total-knee-arthr...
Psychological determinants-of-problematic-outcomes-following-total-knee-arthr...
 
Temperament, Childhood Illness Burden, and Illness Behavior in.docx
Temperament, Childhood Illness Burden, and Illness Behavior in.docxTemperament, Childhood Illness Burden, and Illness Behavior in.docx
Temperament, Childhood Illness Burden, and Illness Behavior in.docx
 
Temperament, Childhood Illness Burden, and Illness Behavior in.docx
Temperament, Childhood Illness Burden, and Illness Behavior in.docxTemperament, Childhood Illness Burden, and Illness Behavior in.docx
Temperament, Childhood Illness Burden, and Illness Behavior in.docx
 
psy 430 research paper (final)
psy 430 research paper (final)psy 430 research paper (final)
psy 430 research paper (final)
 
ALCohoL ReSeARCh C u r r e n t R e v i e w s506 Alcohol .docx
ALCohoL ReSeARCh C u r r e n t  R e v i e w s506 Alcohol .docxALCohoL ReSeARCh C u r r e n t  R e v i e w s506 Alcohol .docx
ALCohoL ReSeARCh C u r r e n t R e v i e w s506 Alcohol .docx
 

More from donnajames55

KATIES POST The crisis case I chose to discuss this week is th.docx
KATIES POST The crisis case I chose to discuss this week is th.docxKATIES POST The crisis case I chose to discuss this week is th.docx
KATIES POST The crisis case I chose to discuss this week is th.docxdonnajames55
 
Kate Chopins concise The Story of an Hour.  What does Joseph.docx
Kate Chopins concise The Story of an Hour.  What does Joseph.docxKate Chopins concise The Story of an Hour.  What does Joseph.docx
Kate Chopins concise The Story of an Hour.  What does Joseph.docxdonnajames55
 
Kadyr AkovaCosc 1437D. KirkEnemy.javaimport java.util..docx
Kadyr AkovaCosc 1437D. KirkEnemy.javaimport java.util..docxKadyr AkovaCosc 1437D. KirkEnemy.javaimport java.util..docx
Kadyr AkovaCosc 1437D. KirkEnemy.javaimport java.util..docxdonnajames55
 
K-2nd Grade3rd-5th Grade6th-8th GradeMajor Concepts,.docx
K-2nd Grade3rd-5th Grade6th-8th GradeMajor Concepts,.docxK-2nd Grade3rd-5th Grade6th-8th GradeMajor Concepts,.docx
K-2nd Grade3rd-5th Grade6th-8th GradeMajor Concepts,.docxdonnajames55
 
JWI 505 Business Communications and Executive Presence Lect.docx
JWI 505 Business Communications and Executive Presence Lect.docxJWI 505 Business Communications and Executive Presence Lect.docx
JWI 505 Business Communications and Executive Presence Lect.docxdonnajames55
 
Just Walk on By by Brent Staples My firs.docx
Just Walk on By by Brent Staples               My firs.docxJust Walk on By by Brent Staples               My firs.docx
Just Walk on By by Brent Staples My firs.docxdonnajames55
 
Just make it simple. and not have to be good, its the first draft. .docx
Just make it simple. and not have to be good, its the first draft. .docxJust make it simple. and not have to be good, its the first draft. .docx
Just make it simple. and not have to be good, its the first draft. .docxdonnajames55
 
JUST 497 Senior Seminar and Internship ExperienceInternationa.docx
JUST 497 Senior Seminar and Internship ExperienceInternationa.docxJUST 497 Senior Seminar and Internship ExperienceInternationa.docx
JUST 497 Senior Seminar and Internship ExperienceInternationa.docxdonnajames55
 
July 2002, Vol 92, No. 7 American Journal of Public Health E.docx
July 2002, Vol 92, No. 7  American Journal of Public Health E.docxJuly 2002, Vol 92, No. 7  American Journal of Public Health E.docx
July 2002, Vol 92, No. 7 American Journal of Public Health E.docxdonnajames55
 
Journals are to be 2 pages long with an introduction, discussion and.docx
Journals are to be 2 pages long with an introduction, discussion and.docxJournals are to be 2 pages long with an introduction, discussion and.docx
Journals are to be 2 pages long with an introduction, discussion and.docxdonnajames55
 
Judgement in Managerial Decision MakingBased on examples fro.docx
Judgement in Managerial Decision MakingBased on examples fro.docxJudgement in Managerial Decision MakingBased on examples fro.docx
Judgement in Managerial Decision MakingBased on examples fro.docxdonnajames55
 
Joyce is a 34-year-old woman who has been married 10 years. She .docx
Joyce is a 34-year-old woman who has been married 10 years. She .docxJoyce is a 34-year-old woman who has been married 10 years. She .docx
Joyce is a 34-year-old woman who has been married 10 years. She .docxdonnajames55
 
Journal Write in 300-500 words about the following topic.After .docx
Journal Write in 300-500 words about the following topic.After .docxJournal Write in 300-500 words about the following topic.After .docx
Journal Write in 300-500 words about the following topic.After .docxdonnajames55
 
Journal Supervision and Management StyleWhen it comes to superv.docx
Journal Supervision and Management StyleWhen it comes to superv.docxJournal Supervision and Management StyleWhen it comes to superv.docx
Journal Supervision and Management StyleWhen it comes to superv.docxdonnajames55
 
Journal of Soc. & Psy. Sci. 2018 Volume 11 (1) 51-55 Ava.docx
Journal of Soc. & Psy. Sci. 2018 Volume 11 (1) 51-55  Ava.docxJournal of Soc. & Psy. Sci. 2018 Volume 11 (1) 51-55  Ava.docx
Journal of Soc. & Psy. Sci. 2018 Volume 11 (1) 51-55 Ava.docxdonnajames55
 
Journal of Social Work Values & Ethics, Fall 2018, Vol. 15, No.docx
Journal of Social Work Values & Ethics, Fall 2018, Vol. 15, No.docxJournal of Social Work Values & Ethics, Fall 2018, Vol. 15, No.docx
Journal of Social Work Values & Ethics, Fall 2018, Vol. 15, No.docxdonnajames55
 
Journal of Policy Practice, 9220–239, 2010 Copyright © Taylor &.docx
Journal of Policy Practice, 9220–239, 2010 Copyright © Taylor &.docxJournal of Policy Practice, 9220–239, 2010 Copyright © Taylor &.docx
Journal of Policy Practice, 9220–239, 2010 Copyright © Taylor &.docxdonnajames55
 
Journal of Personality 862, April 2018VC 2016 Wiley Perio.docx
Journal of Personality 862, April 2018VC 2016 Wiley Perio.docxJournal of Personality 862, April 2018VC 2016 Wiley Perio.docx
Journal of Personality 862, April 2018VC 2016 Wiley Perio.docxdonnajames55
 
Journal of Personality and Social Psychology1977, Vol. 35, N.docx
Journal of Personality and Social Psychology1977, Vol. 35, N.docxJournal of Personality and Social Psychology1977, Vol. 35, N.docx
Journal of Personality and Social Psychology1977, Vol. 35, N.docxdonnajames55
 
Journal of Pcnonaluy and Social Psychology1»M. Vd 47, No 6. .docx
Journal of Pcnonaluy and Social Psychology1»M. Vd 47, No 6. .docxJournal of Pcnonaluy and Social Psychology1»M. Vd 47, No 6. .docx
Journal of Pcnonaluy and Social Psychology1»M. Vd 47, No 6. .docxdonnajames55
 

More from donnajames55 (20)

KATIES POST The crisis case I chose to discuss this week is th.docx
KATIES POST The crisis case I chose to discuss this week is th.docxKATIES POST The crisis case I chose to discuss this week is th.docx
KATIES POST The crisis case I chose to discuss this week is th.docx
 
Kate Chopins concise The Story of an Hour.  What does Joseph.docx
Kate Chopins concise The Story of an Hour.  What does Joseph.docxKate Chopins concise The Story of an Hour.  What does Joseph.docx
Kate Chopins concise The Story of an Hour.  What does Joseph.docx
 
Kadyr AkovaCosc 1437D. KirkEnemy.javaimport java.util..docx
Kadyr AkovaCosc 1437D. KirkEnemy.javaimport java.util..docxKadyr AkovaCosc 1437D. KirkEnemy.javaimport java.util..docx
Kadyr AkovaCosc 1437D. KirkEnemy.javaimport java.util..docx
 
K-2nd Grade3rd-5th Grade6th-8th GradeMajor Concepts,.docx
K-2nd Grade3rd-5th Grade6th-8th GradeMajor Concepts,.docxK-2nd Grade3rd-5th Grade6th-8th GradeMajor Concepts,.docx
K-2nd Grade3rd-5th Grade6th-8th GradeMajor Concepts,.docx
 
JWI 505 Business Communications and Executive Presence Lect.docx
JWI 505 Business Communications and Executive Presence Lect.docxJWI 505 Business Communications and Executive Presence Lect.docx
JWI 505 Business Communications and Executive Presence Lect.docx
 
Just Walk on By by Brent Staples My firs.docx
Just Walk on By by Brent Staples               My firs.docxJust Walk on By by Brent Staples               My firs.docx
Just Walk on By by Brent Staples My firs.docx
 
Just make it simple. and not have to be good, its the first draft. .docx
Just make it simple. and not have to be good, its the first draft. .docxJust make it simple. and not have to be good, its the first draft. .docx
Just make it simple. and not have to be good, its the first draft. .docx
 
JUST 497 Senior Seminar and Internship ExperienceInternationa.docx
JUST 497 Senior Seminar and Internship ExperienceInternationa.docxJUST 497 Senior Seminar and Internship ExperienceInternationa.docx
JUST 497 Senior Seminar and Internship ExperienceInternationa.docx
 
July 2002, Vol 92, No. 7 American Journal of Public Health E.docx
July 2002, Vol 92, No. 7  American Journal of Public Health E.docxJuly 2002, Vol 92, No. 7  American Journal of Public Health E.docx
July 2002, Vol 92, No. 7 American Journal of Public Health E.docx
 
Journals are to be 2 pages long with an introduction, discussion and.docx
Journals are to be 2 pages long with an introduction, discussion and.docxJournals are to be 2 pages long with an introduction, discussion and.docx
Journals are to be 2 pages long with an introduction, discussion and.docx
 
Judgement in Managerial Decision MakingBased on examples fro.docx
Judgement in Managerial Decision MakingBased on examples fro.docxJudgement in Managerial Decision MakingBased on examples fro.docx
Judgement in Managerial Decision MakingBased on examples fro.docx
 
Joyce is a 34-year-old woman who has been married 10 years. She .docx
Joyce is a 34-year-old woman who has been married 10 years. She .docxJoyce is a 34-year-old woman who has been married 10 years. She .docx
Joyce is a 34-year-old woman who has been married 10 years. She .docx
 
Journal Write in 300-500 words about the following topic.After .docx
Journal Write in 300-500 words about the following topic.After .docxJournal Write in 300-500 words about the following topic.After .docx
Journal Write in 300-500 words about the following topic.After .docx
 
Journal Supervision and Management StyleWhen it comes to superv.docx
Journal Supervision and Management StyleWhen it comes to superv.docxJournal Supervision and Management StyleWhen it comes to superv.docx
Journal Supervision and Management StyleWhen it comes to superv.docx
 
Journal of Soc. & Psy. Sci. 2018 Volume 11 (1) 51-55 Ava.docx
Journal of Soc. & Psy. Sci. 2018 Volume 11 (1) 51-55  Ava.docxJournal of Soc. & Psy. Sci. 2018 Volume 11 (1) 51-55  Ava.docx
Journal of Soc. & Psy. Sci. 2018 Volume 11 (1) 51-55 Ava.docx
 
Journal of Social Work Values & Ethics, Fall 2018, Vol. 15, No.docx
Journal of Social Work Values & Ethics, Fall 2018, Vol. 15, No.docxJournal of Social Work Values & Ethics, Fall 2018, Vol. 15, No.docx
Journal of Social Work Values & Ethics, Fall 2018, Vol. 15, No.docx
 
Journal of Policy Practice, 9220–239, 2010 Copyright © Taylor &.docx
Journal of Policy Practice, 9220–239, 2010 Copyright © Taylor &.docxJournal of Policy Practice, 9220–239, 2010 Copyright © Taylor &.docx
Journal of Policy Practice, 9220–239, 2010 Copyright © Taylor &.docx
 
Journal of Personality 862, April 2018VC 2016 Wiley Perio.docx
Journal of Personality 862, April 2018VC 2016 Wiley Perio.docxJournal of Personality 862, April 2018VC 2016 Wiley Perio.docx
Journal of Personality 862, April 2018VC 2016 Wiley Perio.docx
 
Journal of Personality and Social Psychology1977, Vol. 35, N.docx
Journal of Personality and Social Psychology1977, Vol. 35, N.docxJournal of Personality and Social Psychology1977, Vol. 35, N.docx
Journal of Personality and Social Psychology1977, Vol. 35, N.docx
 
Journal of Pcnonaluy and Social Psychology1»M. Vd 47, No 6. .docx
Journal of Pcnonaluy and Social Psychology1»M. Vd 47, No 6. .docxJournal of Pcnonaluy and Social Psychology1»M. Vd 47, No 6. .docx
Journal of Pcnonaluy and Social Psychology1»M. Vd 47, No 6. .docx
 

Recently uploaded

Class 11 Legal Studies Ch-1 Concept of State .pdf
Class 11 Legal Studies Ch-1 Concept of State .pdfClass 11 Legal Studies Ch-1 Concept of State .pdf
Class 11 Legal Studies Ch-1 Concept of State .pdfakmcokerachita
 
“Oh GOSH! Reflecting on Hackteria's Collaborative Practices in a Global Do-It...
“Oh GOSH! Reflecting on Hackteria's Collaborative Practices in a Global Do-It...“Oh GOSH! Reflecting on Hackteria's Collaborative Practices in a Global Do-It...
“Oh GOSH! Reflecting on Hackteria's Collaborative Practices in a Global Do-It...Marc Dusseiller Dusjagr
 
Accessible design: Minimum effort, maximum impact
Accessible design: Minimum effort, maximum impactAccessible design: Minimum effort, maximum impact
Accessible design: Minimum effort, maximum impactdawncurless
 
Call Girls in Dwarka Mor Delhi Contact Us 9654467111
Call Girls in Dwarka Mor Delhi Contact Us 9654467111Call Girls in Dwarka Mor Delhi Contact Us 9654467111
Call Girls in Dwarka Mor Delhi Contact Us 9654467111Sapana Sha
 
Employee wellbeing at the workplace.pptx
Employee wellbeing at the workplace.pptxEmployee wellbeing at the workplace.pptx
Employee wellbeing at the workplace.pptxNirmalaLoungPoorunde1
 
call girls in Kamla Market (DELHI) 🔝 >༒9953330565🔝 genuine Escort Service 🔝✔️✔️
call girls in Kamla Market (DELHI) 🔝 >༒9953330565🔝 genuine Escort Service 🔝✔️✔️call girls in Kamla Market (DELHI) 🔝 >༒9953330565🔝 genuine Escort Service 🔝✔️✔️
call girls in Kamla Market (DELHI) 🔝 >༒9953330565🔝 genuine Escort Service 🔝✔️✔️9953056974 Low Rate Call Girls In Saket, Delhi NCR
 
Science 7 - LAND and SEA BREEZE and its Characteristics
Science 7 - LAND and SEA BREEZE and its CharacteristicsScience 7 - LAND and SEA BREEZE and its Characteristics
Science 7 - LAND and SEA BREEZE and its CharacteristicsKarinaGenton
 
How to Make a Pirate ship Primary Education.pptx
How to Make a Pirate ship Primary Education.pptxHow to Make a Pirate ship Primary Education.pptx
How to Make a Pirate ship Primary Education.pptxmanuelaromero2013
 
URLs and Routing in the Odoo 17 Website App
URLs and Routing in the Odoo 17 Website AppURLs and Routing in the Odoo 17 Website App
URLs and Routing in the Odoo 17 Website AppCeline George
 
Concept of Vouching. B.Com(Hons) /B.Compdf
Concept of Vouching. B.Com(Hons) /B.CompdfConcept of Vouching. B.Com(Hons) /B.Compdf
Concept of Vouching. B.Com(Hons) /B.CompdfUmakantAnnand
 
Mastering the Unannounced Regulatory Inspection
Mastering the Unannounced Regulatory InspectionMastering the Unannounced Regulatory Inspection
Mastering the Unannounced Regulatory InspectionSafetyChain Software
 
Introduction to AI in Higher Education_draft.pptx
Introduction to AI in Higher Education_draft.pptxIntroduction to AI in Higher Education_draft.pptx
Introduction to AI in Higher Education_draft.pptxpboyjonauth
 
How to Configure Email Server in Odoo 17
How to Configure Email Server in Odoo 17How to Configure Email Server in Odoo 17
How to Configure Email Server in Odoo 17Celine George
 
_Math 4-Q4 Week 5.pptx Steps in Collecting Data
_Math 4-Q4 Week 5.pptx Steps in Collecting Data_Math 4-Q4 Week 5.pptx Steps in Collecting Data
_Math 4-Q4 Week 5.pptx Steps in Collecting DataJhengPantaleon
 
Crayon Activity Handout For the Crayon A
Crayon Activity Handout For the Crayon ACrayon Activity Handout For the Crayon A
Crayon Activity Handout For the Crayon AUnboundStockton
 
Presiding Officer Training module 2024 lok sabha elections
Presiding Officer Training module 2024 lok sabha electionsPresiding Officer Training module 2024 lok sabha elections
Presiding Officer Training module 2024 lok sabha electionsanshu789521
 
Alper Gobel In Media Res Media Component
Alper Gobel In Media Res Media ComponentAlper Gobel In Media Res Media Component
Alper Gobel In Media Res Media ComponentInMediaRes1
 
Organic Name Reactions for the students and aspirants of Chemistry12th.pptx
Organic Name Reactions  for the students and aspirants of Chemistry12th.pptxOrganic Name Reactions  for the students and aspirants of Chemistry12th.pptx
Organic Name Reactions for the students and aspirants of Chemistry12th.pptxVS Mahajan Coaching Centre
 
The Most Excellent Way | 1 Corinthians 13
The Most Excellent Way | 1 Corinthians 13The Most Excellent Way | 1 Corinthians 13
The Most Excellent Way | 1 Corinthians 13Steve Thomason
 

Recently uploaded (20)

Class 11 Legal Studies Ch-1 Concept of State .pdf
Class 11 Legal Studies Ch-1 Concept of State .pdfClass 11 Legal Studies Ch-1 Concept of State .pdf
Class 11 Legal Studies Ch-1 Concept of State .pdf
 
“Oh GOSH! Reflecting on Hackteria's Collaborative Practices in a Global Do-It...
“Oh GOSH! Reflecting on Hackteria's Collaborative Practices in a Global Do-It...“Oh GOSH! Reflecting on Hackteria's Collaborative Practices in a Global Do-It...
“Oh GOSH! Reflecting on Hackteria's Collaborative Practices in a Global Do-It...
 
Accessible design: Minimum effort, maximum impact
Accessible design: Minimum effort, maximum impactAccessible design: Minimum effort, maximum impact
Accessible design: Minimum effort, maximum impact
 
Call Girls in Dwarka Mor Delhi Contact Us 9654467111
Call Girls in Dwarka Mor Delhi Contact Us 9654467111Call Girls in Dwarka Mor Delhi Contact Us 9654467111
Call Girls in Dwarka Mor Delhi Contact Us 9654467111
 
Employee wellbeing at the workplace.pptx
Employee wellbeing at the workplace.pptxEmployee wellbeing at the workplace.pptx
Employee wellbeing at the workplace.pptx
 
call girls in Kamla Market (DELHI) 🔝 >༒9953330565🔝 genuine Escort Service 🔝✔️✔️
call girls in Kamla Market (DELHI) 🔝 >༒9953330565🔝 genuine Escort Service 🔝✔️✔️call girls in Kamla Market (DELHI) 🔝 >༒9953330565🔝 genuine Escort Service 🔝✔️✔️
call girls in Kamla Market (DELHI) 🔝 >༒9953330565🔝 genuine Escort Service 🔝✔️✔️
 
Science 7 - LAND and SEA BREEZE and its Characteristics
Science 7 - LAND and SEA BREEZE and its CharacteristicsScience 7 - LAND and SEA BREEZE and its Characteristics
Science 7 - LAND and SEA BREEZE and its Characteristics
 
How to Make a Pirate ship Primary Education.pptx
How to Make a Pirate ship Primary Education.pptxHow to Make a Pirate ship Primary Education.pptx
How to Make a Pirate ship Primary Education.pptx
 
URLs and Routing in the Odoo 17 Website App
URLs and Routing in the Odoo 17 Website AppURLs and Routing in the Odoo 17 Website App
URLs and Routing in the Odoo 17 Website App
 
Concept of Vouching. B.Com(Hons) /B.Compdf
Concept of Vouching. B.Com(Hons) /B.CompdfConcept of Vouching. B.Com(Hons) /B.Compdf
Concept of Vouching. B.Com(Hons) /B.Compdf
 
Mastering the Unannounced Regulatory Inspection
Mastering the Unannounced Regulatory InspectionMastering the Unannounced Regulatory Inspection
Mastering the Unannounced Regulatory Inspection
 
Introduction to AI in Higher Education_draft.pptx
Introduction to AI in Higher Education_draft.pptxIntroduction to AI in Higher Education_draft.pptx
Introduction to AI in Higher Education_draft.pptx
 
How to Configure Email Server in Odoo 17
How to Configure Email Server in Odoo 17How to Configure Email Server in Odoo 17
How to Configure Email Server in Odoo 17
 
_Math 4-Q4 Week 5.pptx Steps in Collecting Data
_Math 4-Q4 Week 5.pptx Steps in Collecting Data_Math 4-Q4 Week 5.pptx Steps in Collecting Data
_Math 4-Q4 Week 5.pptx Steps in Collecting Data
 
Crayon Activity Handout For the Crayon A
Crayon Activity Handout For the Crayon ACrayon Activity Handout For the Crayon A
Crayon Activity Handout For the Crayon A
 
Presiding Officer Training module 2024 lok sabha elections
Presiding Officer Training module 2024 lok sabha electionsPresiding Officer Training module 2024 lok sabha elections
Presiding Officer Training module 2024 lok sabha elections
 
Alper Gobel In Media Res Media Component
Alper Gobel In Media Res Media ComponentAlper Gobel In Media Res Media Component
Alper Gobel In Media Res Media Component
 
Organic Name Reactions for the students and aspirants of Chemistry12th.pptx
Organic Name Reactions  for the students and aspirants of Chemistry12th.pptxOrganic Name Reactions  for the students and aspirants of Chemistry12th.pptx
Organic Name Reactions for the students and aspirants of Chemistry12th.pptx
 
The Most Excellent Way | 1 Corinthians 13
The Most Excellent Way | 1 Corinthians 13The Most Excellent Way | 1 Corinthians 13
The Most Excellent Way | 1 Corinthians 13
 
TataKelola dan KamSiber Kecerdasan Buatan v022.pdf
TataKelola dan KamSiber Kecerdasan Buatan v022.pdfTataKelola dan KamSiber Kecerdasan Buatan v022.pdf
TataKelola dan KamSiber Kecerdasan Buatan v022.pdf
 

contentserver__5_.pdfAging & Mental Health, January 2007; .docx

  • 1. contentserver__5_.pdf Aging & Mental Health, January 2007; 11(1): 89–98 ORIGINAL ARTICLE The relationship of optimism, pain and social support to well- being in older adults with osteoarthritis V. M. FERREIRA & A. M. SHERMAN Brandeis University, Waltham, MA, US (Received 30 August 2005; accepted 13 March 2006) Abstract Improving the psychological well-being of individuals with osteoarthritis (OA) is an important concern because the condition is highly prevalent and has no known cure. Few studies have assessed the joint contribution of social, personality, and physical factors in relation to well-being for OA patients. In a cross-sectional sample of older adults with OA (n ¼ 73, 73% female), we assessed the role of support perceptions, optimism and pain in depressive symptoms and life satisfaction. Greater optimism and support were significantly related to both greater life satisfaction and lower depressive symptoms. Further, optimism partially mediated the relationship of pain to life satisfaction, while support partially mediated the role of pain in depressive symptoms. The interplay of these variables in
  • 2. relation to well-being is discussed in the context of chronic illness and older adulthood. Introduction Many older adults (85% of those over 75) currently experience a painful and often disabling disease, osteoarthritis (OA), for which there is no known cure (Sack, 1995). Osteoarthritis can negatively impact many aspects of life, including both social and physical functioning (Bookwala, Harralson, & Parmalee, 2003) through pain, physical and psycho- social limitations on valued activities, as well as comorbid depressive symptoms (Penninx et al., 1998). It is important to investigate factors that relate to psychological health outcomes of OA patients in order to better understand how to improve well-being. As Keefe and his colleagues suggest (Keefe & Bonk, 1999; Keefe et al., 2002), there exists a complex interplay of symptomology, social and psychological factors in arthritis patients. In the following sections, we review the role of optimism, social support, and pain as important correlates of psychological well-being, particularly for older adults. Pain The common and persistent nature of pain asso- ciated with OA (Schumacker, 1988) may be a reason for the variability in the well-being of OA patients (e.g., de Vellis et al., 1986; Klinger, Spaulding, Polatajko, MacKinnon, & Miller, 1999). Pain has a strong relationship with many other health- related variables in older adults with arthritis
  • 3. (Roberts, Matecjyck, & Anthony, 1996). In OA samples, greater pain is a stressor linked to lower social support and well-being (de Vellis et al., 1986). Pain is also associated with greater depressive symptoms (Bookwala et al., 2003; Klinger et al., 1999) and lower life satisfaction (Laborde & Powers, 1985) in patients with OA. However, Blixen and Kippes (1999) present contrasting evidence showing that pain from OA is unrelated to life satisfaction when social support is accounted for, suggesting that support mediates the negative impact of pain. Such a finding suggests that the role of psycho- social factors in the well-being of OA patients may be important to investigate. While the pain associated with OA is difficult to control, often with negative effects on well-being, understanding factors that may serve as points of intervention would allow for a better understanding of how to improve patients’ well- being. Thus, in the following sections, we review optimism and social support, two factors commonly linked to psychological well-being outcomes such as life satisfaction and depressive symptoms. Optimism Optimism, defined as an individual’s positive outlook on life (Scheier, Carver, & Bridges, 1994), is a dispositional (i.e., temperament) variable related to adaptation to chronic illness (Lazarus & Folkman, 1984). Optimism is related to both improved Correspondence: V. M. Ferreira, Brandeis University, Waltham, MA, US. E-mail: [email protected] ISSN 1360-7863 print/ISSN 1364-6915 online/07/010089–98 � 2007 Taylor & Francis
  • 4. DOI: 10.1080/13607860600736166 psychosocial and physical health outcomes (Barnwell & Kavanaugh, 1997; Brenner, Melamed, & Panush, 1994), as well as less frequent harmful health behaviours (i.e., frequent and excessive drinking in college students; Harju & Bolen, 1998). Greater optimism is also related to greater self-reported quality of life in adult samples (Barnwell & Kavanaugh, 1997). Scheier and Carver (1987) argue that optimism plays a protective role in chronic illness by promot- ing more beneficial health outcomes, health habits, and effective disease coping. For example, optimism is not only associated with less severe physical symptomology (Reker & Wong, 1985), but also with electing to follow health-promoting practices as well as coping in healthy, helpful ways with chronic illness (Fournier, deRidder, & Bensing, 2002). However, the beneficial role of optimism differs across chronic illnesses. For example, Fournier et al. (2002) report differing beneficial effects of optimistic beliefs on various facets of coping with chronic diseases such as type I diabetes, rheumatoid arthritis (RA), and multiple sclerosis (MS) in adults. That is, in the chronic illnesses which are controllable (type I diabetes), or at least in part controllable (MS), positive outcome expectancies are associated with greater physical functioning. This is not the case with the much less controllable illness of RA. Further, in a study comparing patients with
  • 5. Parkinson’s disease to those with MS, greater optimism was related to greater physical adjustment to disease symptoms as well as greater use of effective coping strategies (deRidder, Scheier, & Bensing, 2000). However, the relationship between optimism and coping was stronger among MS patients, compared to patients experiencing Parkinson’s. The authors suggest the need to focus on a specific chronic illness in understanding the role of optimism in disease. Fournier et al. (2002) discuss the several types of optimism that have been established and that, when the illness is controllable (i.e., when symptoms or side effects can be controlled by patients’ behaviors), positive outcome expectancies are the most bene- ficial type of optimism for chronically ill patients. Holding positive outcome expectancies suggests that individuals are generally oriented towards positive expectations of future events (Scheier & Carver, 1992). Fournier et al. (2002) discuss the benefit of positive outcome expectancies in the cases of such illnesses as Type I diabetes and, to some extent, RA, because in such cases optimistic (i.e., positive outcome) beliefs may lead to effective-self care as well as physical and mental health. In the present study, positive outcome expectancies were assessed. Although OA is not necessarily controllable, the pain experienced from OA can often be controlled through self-management strategies such as exercise or the use of pain medication, behaviours closely associated with optimistic beliefs, even though the occurrence of pain is often unpredictable (Sack, 1995), thus making positive outcome expectancies an appropriate choice for this sample.
  • 6. Positive outcome expectancies, also known as dispositional optimism, are predictive of more positive affect and less negative affect over time in older adults (Isaacowitz & Seligman, 2002). Optimism is also predictive of psychological well- being. For example, greater optimism predicts less depression three years after baseline in menopausal women after controlling for initial depression (Bromberger & Matthews, 1996). Dispositional optimism is related to greater psychological well- being in older adults, including fewer depressive symptoms and greater life satisfaction (Peterson & Bossio, 1991). Optimism is believed to be related to greater psychological well-being because being optimistic is associated with effective coping strate- gies (e.g., Carver, Scheier, & Weintraub, 1989). For example, optimists are more likely to use problem-focused coping strategies (e.g., Scheier & Carver, 1987). In Long and Sangster’s (1993) work on optimism and coping specifically in the context of arthritis, greater optimism influenced the use of active or problem-solving coping techniques, a type of effective coping beneficial to health and well-being. This active coping reduced negative symptoms such as depressive symptoms in RA patients. In looking specifically at an OA sample of older adults, greater dispositional optimism was related to use of pain-coping strategies more frequently, even when level of pain was controlled (Benyamini, 2005). However, little research currently explores the relationship between optimism and the pain asso- ciated with OA, especially in later life. In one study
  • 7. that specifically addressed the role of dispositional optimism in the physical functioning of older adults with knee OA, Brenes and colleagues (2002) report that optimism was positively related to task perfor- mance in walking. However, optimism was not related to performance in lifting objects, climbing stairs, or getting in and out of cars in their sample. Brenes, Rapp, and Rejeski (2002) did not explore the role of optimism and physical factors such as pain, or psychological well-being in their investi- gation. These factors will be addressed in the present study. Stability of optimism. While optimism is considered to be generally stable (Scheier & Carver, 1987), Benyamini (2005) suggests that reports of optimism, as measured by items on the LOT-R, the measure used in the present study, may be dependent on the time-frame and/or context within which the measure was administered. Benyamini (2005) argues that, in his sample of older adults experiencing OA, optimism may be more easily influenced than with other samples for two reasons; because participants 90 V. M. Ferreira & A. M. Sherman are experiencing late life as well as a stressful health context. If this is the case, it is conceivable that perceived social support, reported to both affect and be affected by health stressors such as physical functioning (Reinhardt & Blieszner, 2000), may play a role in reports of optimism. In addition, adaptation to chronic illness (Gil, Keefe, Crisson, & Van Dalfsen, 1987) as well as pain (de Vellis et al.,
  • 8. 1986) may both be contextual factors affecting reports of optimism. In an example of the less- stable nature of optimism in chronic illness samples, Symister and Friend (2003) report that in a sample of end-stage renal disease patients, social support was predictive of optimism. The role of optimism along with other psychosocial as well as symptomol- ogy variables such as pain in the well-being of older adults has not yet thoroughly been investigated. Understanding such relationships is important in that these variables together may play a more complex role in well-being than is currently believed to be the case. For example, health-related interven- tions may need to be sensitive to personality dimensions such as optimism. In addition, beliefs in optimistic expectancies do decrease in the context of significant, repetitive stress (e.g., Bandura, 1988; Carver et al., 1998) such as the disability and persistent pain associated with OA. While not yet thoroughly investigated, some literature does suggest that reports of optimism may be influenced by health context (Schulz, Tompkins, & Rau, 1988). Schulz et al. (1988) report that in stroke victims and their support persons, optimism scores dropped over the six month period after the stroke. In addition, Benyamini (2005) discusses the possibility that, particularly in older adults, reports of optimistic expectations may be dependent upon more short- term contextual factors, such as the health context of pain. While an individual’s disposition, including optimism, is an important predictor of well-being, so too is the social aspect of one’s life (Finch & Graziano, 2001). Thus, social support perceptions, one facet of social support, will be reviewed in the following section.
  • 9. Social support Social support is defined as the resources perceived as available from others in social networks (Antonucci, 1993; Berkman, Glass, Brissette, & Seeman, 2000; Bisconti & Bergeman, 1999). Support involves the beneficial receipt of provisions in relationships, including informational, emotional, or tangible aid. Support is often assessed subjectively as an individual’s perception of the support they perceive as available to them. Perceptions of support are related to health, including symptoms associated with chronic illness, in addition to well-being variables such as life satisfaction (Antonucci & Knipscheer, 1990; Cummins & Nistico, 2002). In older adults, perceived support is linked to fewer depressive symptoms (Finch & Graziano, 2001; Russell & Cutrona, 1991) and greater life satisfaction (Walen & Lachman, 2000). Looking specifically at older adults with OA, social support is associated with fewer depressive symptoms (Sherman, 2003) as well as less arthritis pain (Evers, Kraaimaat, Geenen, & Bijlsma, 1998). Research also suggests that perceptions of social support may contribute to positive well-being (Blixen & Kippes, 1999) by positively affecting such facets of coping as support seeking as a resource (e.g., Scheier & Carver, 1987). There has been some speculation about the combined role of optimism and social support in psychological functioning. For example, Finch and Graziano (2001) reported that greater optimism and social support were each uniquely related to lower depressive symptoms in a general sample of older
  • 10. adults. That is, more optimistic older adults, and those reporting higher social support, reported fewer depressive symptoms. However, physical stressors, such as pain, have not been investigated jointly with support and optimism in relation to well-being, particularly for OA. This is a gap that should not be ignored because physical stressors are strongly related to poor psychological outcomes such as greater depressive symptoms (e.g., Evers et al., 1998). We suggest that experiencing more pain may be related to individuals’ tendencies not to view their world in an optimistic, positive light and thus, these individuals may report less well-being. While this hypothesis has not yet been tested in the literature, less pain, like greater optimism in older adults, is associated with better psychological well-being in OA samples (de Vellis et al., 1986). In addition, we suggest that experiencing more pain may be related to individuals’ tendencies not to view their relationships as positive and supportive and thus, these individuals may report less well-being. Thus, in the present study, the stressor of pain, a common symptom of OA, as well as social support and dispositional optimism were investigated in an effort to understand the role that these different factors play in the depressive symptoms and life satisfaction reported by older adults with OA. Hypotheses 1. Greater pain is hypothesized to be associated with less life satisfaction and greater depressive symptoms.
  • 11. 2. Greater optimism and social support are expected to relate to less depressive symptoms and greater life satisfaction after accounting for pain. 3. Two possible mediation models will be tested. The first will assess the role of optimism in mediating the relationship of pain to life satisfac- tion and depressive symptoms. The second will Optimism, pain, social support in well-being 91 assess the role of support in mediating the relationship of pain to life satisfaction and depressive symptoms. Method Participants and procedure Ninety-five potential participants were contacted by telephone from a list of participants from a previous OA study (see Ferreira & Sherman, 2006). The original sample had been recruited through newspaper advertisements, fliers, and recruitment through a continuing education program for older adults. Of the original participants, 72 older adults (52 women and 20 men, ranging in age from 60 to 84, mean age ¼ 72.4 years) volunteered to participate in the present study (response rate of 76%). Participants completed and returned the mailed survey. Follow-up data were used rather than baseline data because optimism was not
  • 12. measured at baseline. There were no significant demographic differences between responders and non-responders. Participants all resided in the greater Boston area and spoke fluent English. The majority (92.6%) of participants considered themselves Caucasian. Nearly half of the participants (45.2%, n ¼ 33) were married, 27.4% (n ¼ 20) were widowed, and 26% (n ¼ 19) were single, divorced or separated. See Table I for additional demographic information. There were no significant differences in depressive symptoms (t ¼ �0.80, ns) or pain (t ¼ 1.28, ns) in those who did or did not respond. Measures Optimism was assessed using the Life Orientation Test-Revised (LOT-R; Scheier, Carver, & Bridges, 1994), which examines outcome expectancies. The measure consists of 12 items, including four filler items not included in the analyses, for a total of eight items. Great debate has surrounded the use of the LOT in its entirety as a measure of optimism (with negatively worded items being reverse coded) or as a measure of both optimism and pessimism (with two subscales being conceptualized as separate constructs. While Scheier and Carver (1987) have suggested the scale may be used as a bipolar measure, research has suggested that optimism and pessimism are very different constructs (e.g., Brenes, Rapp, Rejeski, & Miller, 2002; Lai, 1994; Marshall, Wortman, Kusulas, Hervig, & Vickers, 1992). In light of this controversy, the four positively worded items assessing optimism were used. Response
  • 13. options utilized a five-point Likert scale. Higher scores indicate greater optimism (M ¼ 13.26, SD ¼ 2.89, high score ¼ 20). Reliability was 0.76 with this sample. Social support was assessed using the Medical Outcomes Study (MOS) Social Support Survey (Sherbourne & Stewart, 1991) which examines perceived social support (M ¼ 65.06, SD ¼ 18.44, high score ¼ 95). Higher scores indicate greater perceived support. Sherbourne & Stewart (1991) report high internal consistency (Cronbach’s alpha ¼ 0.97), which was replicated in this sample (Cronbach’s alpha ¼ 0.97). Pain was assessed using the pain subscale of the Medical Outcomes Study (MOS) 36-item short- form survey (SF-36; Ware & Sherbourne, 1992). The SF-36 includes self-report items of health perceptions, physical functioning, role limitations and pain. The pain subscale includes two items, which are summed so that a higher score indicates more pain (M ¼ 5.85, SD ¼ 1.91, high score ¼ 10). Depressive symptoms were assessed using the 20-item Centre for Epidemiological Studies Depression scale (CES-D; Radloff, 1977). The CES-D includes 20 items assessing emotional (‘I could not stop crying’) and somatic symptoms (‘I had trouble sleeping’) characteristic of depressed mood. Response options are on a four-point Likert type scale with possible responses ranging from ‘all of the time’ to ‘rarely’ (M ¼ 26.25, SD ¼ 8.8, high score ¼ 40). Reliability was 0.84 with this sample. Higher scores indicate more depressive symptomatology.
  • 14. Life satisfaction was assessed with the Life Satisfaction Index (LSI; Neugarten, Havinghurst, & Tobin, 1961). The scale consists of 13 items using a five-point Likert-type format for response options (M ¼ 41.31, SD ¼ 10.14, high score ¼ 61). A higher score means more life satisfaction. Reliability was 0.89 with this sample. Data analysis In order to investigate the role of pain, optimism and perceived social support in depressive symptoms and life satisfaction, hierarchical multiple regression analyses were conducted. In the first step of each Table I. Demographic characteristics, n ¼ 73. No. (%) Marital status Married 33 (45.2) Widowed 20 (27.4) Single/divorced/separated 19 (26.0) No response 1 (1.4) Education Bachelor’s degree or greater 42 (57.5) Some college 13 (17.8) Associate’s degree 4 (5.5) High school diploma or less 10 (13.7) No response 4 (5.5) Income (annual) �20,000 23 (31.5) >20,001 48 (65.8)
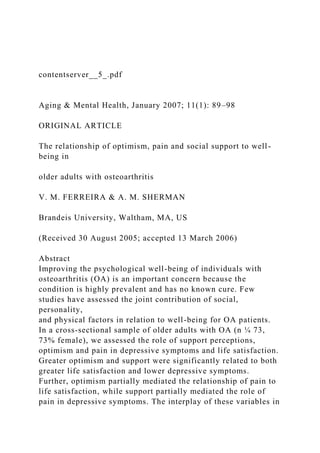
  • 15. No response 2 (2.7) 92 V. M. Ferreira & A. M. Sherman regression, age was entered. In the second step for each regression, pain was entered. To assess the potentially mediating roles of optimism and support to pain, two multiple regres- sion models were developed. In these two regression analyses, life satisfaction and depressive symptoms were each assessed as an outcome. In each of these models, after age and pain were entered in steps one and two, support was entered at the third step of the model, followed by optimism at the fourth step. This model investigated the role of either optimism or support as mediators of pain in relation to the outcomes (see Figure 1). In order to assess the role of either support or optimism as a mediator of pain, three aspects to the mediation model must be assessed (Baron & Kenny, 1986). In the first leg of the model, the association of pain to the outcome must be significant. Next, pain must significantly predict the mediator (support or optimism). Finally, in the third leg of the model, the relationship of pain to the outcome must be reduced to non-significance once the mediator (support or optimism) is entered into the model. Only when all three of these criteria are met will mediation be demonstrated (see Figure 1; Baron & Kenny, 1986). Follow-up Sobel tests will then be conducted to test for partial mediation
  • 16. (Preacher & Leonardelli, 2003). Results Bivariate analyses Correlations between the variables measured in the present study are reported in Table II. Gender, marital status, and income were excluded from further multivariate analyses to conserve power because they were not related to any of the other measures. Age was used as a control variable because older age was correlated with lower life satisfaction. Pain was significantly correlated with greater depres- sive symptoms and less life satisfaction. Support and optimism were both significantly correlated with fewer depressive symptoms and greater life satisfaction. Multivariate analyses Life satisfaction. In the first hierarchical multiple regression model with life satisfaction as an outcome, (a) (b) Pain Social support Depressive symptoms Life satisfaction Pain
  • 17. Optimism Depressive symptoms Life satisfaction Figure 1. (a) Role of optimism as a mediator; (b) Role of social support as a mediator. Table II. Correlations of measures. 1 2 3 4 5 6 7 8 9 Age – �0.12 0.04 �0.04 0.14 �0.14 �0.04 0.10 �0.29* Gender – – �0.13 0.09 �0.17 0.03 0.01 0.02 �0.09 Income – – – �0.18 �0.06 0.08 0.10 �0.16 0.12 Marital status – – – – �0.01 �0.14 0.01 0.22 0.03 Pain – – – – – �0.28* �0.30* 0.43** �0.46** Social support – – – – – – 0.07 �0.44** 0.41** Optimism – – – – – – – �0.53** 0.64** Depressive symptoms – – – – – – – – �0.64** Life satisfaction – – – – – – – – – *p50.05; **p50.01. Optimism, pain, social support in well-being 93 we assessed the role of pain, perceptions of social support, and optimism, with optimism as a possible mediator of the relationship of pain to life satisfaction. The final model was significant (F (4,63) ¼ 20.13, p50.01, adjusted R2 ¼ 0.53; see Table III). Greater age was significantly related to higher life satisfaction at the first step and
  • 18. throughout the model (R2 ¼ 0.08, F (1,66) ¼ 5.36, p50.05). In the second step, less pain was related to greater life satisfaction (�R2 ¼ 0.12, F (1,65) ¼ 9.69, p50.01). Perceived social support explained addi- tional variance (�R2 ¼ 0.06, F (1,64) ¼ 4.98, p50.01) when entered at the third step. Greater support was related to more life satisfaction, while pain remained significant. Support remained sig- nificant at the fourth step (t ¼ 2.75, p50.01). However, the relationship of pain to life satisfaction was reduced to non-significance once optimism was entered in the fourth step of the model (t ¼ 1.46, ns). Greater optimism was significantly related to life satisfaction at this step (�R2 ¼ 0.31, F (1,63) ¼ 45.08, p50.01). This model suggests that optimism should be tested as a partial mediator of pain (Baron & Kenny, 1986). The relationship of pain as a predictor of optimism was significant (F (1, 70) ¼ 7.69, p50.01, adjusted R2 ¼ 0.09). This finding suggests that pain may be partially mediated by optimism in relation to life satisfaction. A mediation analysis was conducted assessing opti- mism as a mediator of pain. The Sobel mediation test was significant (t ¼ �2.54, p ¼ 0.01), suggesting that optimism does partially mediate the relationship of pain to life satisfaction (Preacher & Leonardelli, 2003). Full mediation is not demonstrated because the beta values were not reduced to zero (Baron & Kenny, 1986). There was no evidence that support mediated pain in the analysis. Depressive symptoms. In the hierarchical multiple regression model assessing the role of optimism, pain and support in their relationship to depressive symptoms, we assessed the possible role of optimism
  • 19. as a mediator of pain. The final model was significant (F (4,62) ¼ 14.68, p50.01, adjusted R 2 ¼ 0.45; see Table IV). Age was not significantly related to depressive symptoms at the first step, or throughout the model. In the second step, more pain was related to greater depressive symptoms (�R2 ¼ 0.16, F (1,64) ¼ 12.13, p50.01). Perceived social support explained additional variance (�R2 ¼ 0.12, F (1,63) ¼ 10.85, p50.01) when entered at the third step. Less support was related to greater depressive symptoms, while pain remained significant though was reduced in its statistical relationship. The relationship of pain to depression was reduced to non-significance once optimism was entered in the fourth step of the model, where lower optimism and support were both related to higher depressive symptoms (�R2 ¼ 0.45, F (1,62) ¼ 24.06, p50.01). This model suggests that both optimism and pain should be tested as possible mediators of pain in relation to depressive symptoms (Baron & Kenny, 1986). Table III. Summary of hierarchical regression analysis for life satisfaction showing optimism as a mediator (n ¼ 70). 1 2 3 4 Step B SE B � B SE B � B SE B � B SE B � Age 0.46 0.20 0.27* 0.37 0.19 0.22* 0.34 0.14 0.20* 0.33 0.14 0.20* Pain – – – �1.62 0.52 �0.35** �1.34 0.52 �0.29* �0.61 0.42
  • 20. �0.13 Support – – – – – – 0.13 0.06 0.25* 0.12 0.05 0.24** Optimism – – – – – – – – – 1.93 0.29 0.58** Adjusted R2 – – – 0.06* – – – 0.17** – – – 0.22* – – – 0.53** *p50.05; **p50.01. Table IV. Summary of hierarchical regression analysis for depressive symptoms showing optimism as a mediator (n ¼ 70). 1 2 3 4 Step B SE B � B SE B � B SE B � B SE B � Age �0.12 0.19 �0.08 �0.30 0.18 �0.02 0.02 0.17 0.01 0.02 0.14 0.01 Pain – – – 1.74 0.50 0.40** 1.35 0.48 0.31 0.81 0.43 0.19 Support – – – – – – �0.18 0.05 �0.36** �0.17 0.05 �0.35** Optimism – – – – – – – – – �1.45 0.30 �0.46** Adjusted R2 – – – 0.01* – – – 0.14** – – – 0.25* – – – 0.45** *p50.05; **p50.01. 94 V. M. Ferreira & A. M. Sherman Support as a mediator. The relationship of pain to support was significant (F (1, 70) ¼ 5.16, p50.05, adjusted R2 ¼ 0.06). Finally, because the first two legs of the mediation model were significant, a Sobel test was used to assess the final leg of the mediation model. The mediation test was significant (t ¼ 1.98, p ¼ 0.05). This finding suggests that pain is partially mediated by support in relation to depressive symptoms. There was no evidence that optimism
  • 21. mediated pain in this analysis. Optimism as a mediator. The relationship of pain to optimism was assessed to be significant (F (1, 70) ¼ 7.69, p50.01, adjusted R2 ¼ 0.09). As was done in the previous analysis, because the first two legs of the mediation model were significant, a Sobel test was used to assess the final leg of the mediation model. The mediation test was not significant (t ¼ 0.06, ns). This finding suggests that pain is not mediated by optimism in relation to depressive symptoms. Discussion In the present study, we investigated the role of social relations, optimism and the common symp- tom of pain in the well-being of older adults experiencing OA. The findings suggest that pain, social support and optimism, are related in complex ways for this sample. Furthermore, these findings suggest that these factors relate in unique ways depending upon the outcome being investigated. Life satisfaction In investigating life satisfaction, pain was partially mediated by optimism, while support was indepen- dently related to life satisfaction. These results suggest that optimism is partially responsible for the relationship between pain and life satisfaction, possibly by negatively influencing the optimistic outlook that is associated with life satisfaction. This finding that optimism partially mediated pain has important implications for our understanding of the process by which pain is related to psychological
  • 22. well-being (Bookwala et al., 2003; Klinger et al., 1999; Labourde & Powers, 1985; Robert et al., 1996). An optimistic disposition appears to at least be partially diminished by reports of pain, a contextual factor which OA patients may struggle with on a daily basis through the rest of their lives (Schumacker, 1988). As discussed previously in our literature review, although considered to be generally stable (Scheier & Carver, 1987), research suggests that optimism may be dependent upon the context within which it was assessed (Benyamini, 2005). Optimism may be salient for well-being in older adults because, similar to personality constructs such as hardiness (Wallace, Bisconti, & Bergeman, 2001), an optimistic personality may act as a resource in helping older adults to compensate for other losses in resources as they age (Baltes, 1996). Support did not mediate the relationship of pain to life satisfaction. Instead, support was directly linked to this outcome. This finding is consistent with much research suggesting the strong relation- ship of support to greater well-being (e.g., Cummins & Nistico, 2002; Russell & Cutrona, 1991; Walen & Lachman, 2000). As discussed in the introduction, support has been demonstrated to play an important role in both physical health as well as well-being (Antonucci & Knipscheer, 1990; Cummins & Nistico, 2002). Depressive symptoms In contrast to the findings for life satisfaction, for depressive symptoms, there was no evidence of mediation of pain by optimism. However, support
  • 23. partially mediated pain in relation to depressive symptoms. That is, the relationship of greater pain to greater depressive symptoms appears to at least in part be accounted for by the relationship of less support to greater depressive symptoms where older adults experiencing more pain may perceive their social networks as less supportive and thus, report greater depressive symptoms. This mediational role of perceived support con- tributes support to the work of Antonucci, Langfahl, and Akiyama (2004) who suggest that new research should investigate predictors of support perceptions as many contextual factors may play a role in perceptions of social relations. In the case of our findings, the context of consistent pain associated with OA is demonstrated as a contextual fact playing a role in support perceptions. Support seems to be a powerful resource for this sample, with pain working indirectly through sup- port to influence depressive symptoms. This finding is consistent with a wealth of research suggesting not only that perceived social support cyclically affects and is affected by health stressors (e.g., Gil et al., 1987; Reinhardt & Blieszner, 2000), but also that social support plays a complex role in the relation- ship of health variables to psychological well-being outcomes (e.g., Bisconti & Bergeman, 1999). In summary, in this sample, optimism partially mediated pain perceptions in relation to life satisfac- tion while support partially mediated pain percep- tions in relation to depressive symptoms. Taken together, the findings of the present study are difficult to explain. Why does optimism play a
  • 24. mediational role in the relationship of pain to life satisfaction while support mediates the relationship of pain to depressive symptoms? The reasons remain unclear. Follow-up analyses with different samples of older adults experiencing OA are necessary for two reasons. First, such analyses would either replicate or refute these findings. And second, if the present findings are supported, differences in the Optimism, pain, social support in well-being 95 sample may shed light on the mechanisms by which these unique and interesting findings have occurred. Longitudinal, as opposed to the cross-sectional data used in the present study, are suggested in order to provide a more rigorous test of mediation in follow- up research. In addition to these limitations, other limitations to the present study do exist, a few of which will be highlighted next. Limitations and future research The small, non-random nature of our sample may result in somewhat limited generalizability. Replication of this study with a more representative sample may provide stronger statistical evidence for the role of support and optimism as mediators of pain in well-being in samples of older adults with OA. However, our demonstration of significant patterns of association in such a small sample indicates that the interplay of these variables should be a fruitful arena for further investigation.
  • 25. In addition, the self-report nature of the measures means that shared method variance could be a problem. Future research could replicate this study with additional observed measures of physical functioning in order to assess the role of physical impairment and symptoms in well-being while still taking into account personality and social relations factors. In addition, the findings suggest that future research might examine whether other health related stressors such as physical limitations, account for more of the variance in well-being than pain. In this way, the physical symptoms of OA might be better understood in terms of how they affect the overall experience of the patient. Additional suggestions for future research include investigating the role of other dispositional variables in the well-being outcomes of OA patients, in an effort to provide insight into how to better improve the well-being of individuals suffering from pain. For example, the personality variable of hardiness is negatively linked to both self-reported and objective measures of health in older adults (Wallace et al., 2001). This may indicate the importance of person- ality as a resource that allows older adults to compensate for losses and changes as they age (Baltes, 1996). Finally, longitudinal work is sug- gested to look at the significance of all three areas of life (social, personality, and physical) in their relationships to well-being. As mentioned above, optimism and support may be a powerful factor in contributing to well-being due to its value in compensating for other losses in later life.
  • 26. Interventions Although follow-up research is necessary, the pre- sent findings lead us to suggest further research into two approaches to intervention aimed at improving the well-being of older adults experiencing OA. While pain is a symptom of OA that is difficult to control entirely, our findings of support acting as a mediator of pain to depressive symptoms and of optimism mediating the role of pain in life satisfac- tion suggests that focusing on these two psychosocial facets may be an efficacious way to approach intervention strategies. For example, a focus might be placed on working with OA patients and their partners or close family members to strengthen relationships as well as raise awareness in the patient of the social support available to them. Zautra, Hamilton, and Yocum (2000) report that, in their sample of older women experiencing rheumatoid arthritis, interventions designed to enhance social engagement not only improved psychological well-being immediately, but also increased illness coping capacity when assessed four months later. In addition, interventions might focus on increasing positive outcome expectancies, a psychosocial factor considered to be less stable in samples experiencing a chronic condition (Benyamini, 2005). Conclusion In summary, our results indicate that pain has a complex relationship with facets of well-being, both life satisfaction and freedom from depressive symp- toms, in older adults experiencing OA. That is, the
  • 27. effect of pain on perceptions of well-being is influenced by both personality and social relations variables. Being optimistic appears to mediate the relationship of pain in life satisfaction while support appears to mediate pain in relation to depressive symptoms. While the mediational role of support in health context and well-being relationships is well- documented, the mediational role of optimism is much more recent. Thus, investigation of these findings in additional samples of older adults experiencing OA, as well as other chronic illness samples is suggested in order to better understand these findings. This is one of the only studies to look at the role of support, pain, and optimism together in an OA sample. This investigation has afforded us some insight into some aspects of life that allow older adults to maintain a sense of well-being in the face of the challenging disease of OA. Although all three variables had been established as individually important to well-being, the contribution of the present results lies in showing the importance of both optimism and support in well-being independent of other factors, as well as serving as a mediator of physical factors in relation to depressive symptoms and life satisfaction. We have demon- strated the joint contribution of both positive social relationships as well as a positive outlook on life 96 V. M. Ferreira & A. M. Sherman in contributing to the well-being of older adults with OA.
  • 28. References Antonucci, T. C. (1993). Attachment: From youth through adulthood. In R. Kastenbaum (Ed.), Encyclopedia of adult development (pp. 40–44). Phoenix, AZ: Oryx Press. Antonucci, T. C., & Knipscheer, C. P. M. (1990). Social network research: Review and perspectives. In C. P. M. Knipsheer & T. C. Antonucci (Eds.), Social network research (pp. 161–174). Amsterdam: Swets & Zeitlinger. Antonucci, T. C., Langfahl, E. S., & Akiyama, H. (2004). Relationships as outcomes and contexts. In F. R. Lang & K. L. Fingerman (Eds.), Growing together: Personal relationships across the lifespan (pp. 24–44). Cambridge: Cambridge University Press. Arthritis Foundation (Retrieved May 17, 2005). www.arthritis.org Baltes, M. M. (1996). The many faces of dependency in old age. New York: Cambridge University Press. Bandura, A. (1988). Self-regulation of motivation and action through goal systems. In V. Hamilton, G. H. Bower & N. H. Frijda (Eds.), Cognitive perspectives on emotion and motivation (pp. 37–61). Dordrecht: Kluwer Academic Publishers. Barnwell, A. M., & Kavanaugh, D. J. (1997). Prediction of psychological adjustment to multiple sclerosis. Social Science and Medicine, 45, 411–418.
  • 29. Baron, R. M., & Kenny, D. A. (1986). The moderator-mediator variable distinction in social psychological research: Conceptual, strategic, and statistical considerations. Journal of Personality and Social Psychology, 51, 1173–1182. Benyamini, Y. (2005). Can high optimism and high pessimism co-exist? Findings from arthritis patients coping with pain. Personality & Individual Differences, 38, 1463–1473. Berkman, L. F., Glass, T., Brissette, I., & Seeman, T. E. (2000). From social integration to health: Durkheim in the new millennium. Social Science and Medicine, 51, 843–857. Bisconti, T. L., & Bergeman, C. S. (1999). Perceived social control as a mediator of the relationships among social support, psychological well-being, and perceived health. The Gerontologist, 39, 94–103. Blixen, C. E., & Kippes, C. (1999). Depression, social support, and quality of life in older adults with osteoarthritis. Journal of Nursing Scholarship, 31, 221–226. Bookwala, J., Harralson, T. L., & Parmalee, P. A. (2003). Effects of pain and well-being in older adults with osteoarthritis of the knee. Psychology and Aging, 18, 844–850. Brenes, G. A., Rapp, S. R., Rajeski, W. J., & Miller, M. E. (2002). Do optimism and pessimism predict physical functioning? Journal of Behavioral Medicine, 25, 219–231. Brenner, G. F., Melamed, B. G., & Panush, R. S. (1994). Optimism and coping as determinants of psychosocial adjust- ment to rheumatoid arthritis. Journal of Clinical Psychology in Medical Settings, 1, 115–134.
  • 30. Bromberger, J. T., & Matthews, K. A. (1996). A longitudinal study of the effects of pessimism, trait anxiety, and life stress on depressive symptoms in middle-aged women. Psychology and Aging, 11, 207–213. Carver, C. S., Scheier, M. F., & Weintraub, J. K. (1989). Assessing coping strategies: A theoretically based approach. Journal of Personality and Social Psychology, 56, 267–283. Cummins, R. A., & Nistico, H. (2002). Maintaining life satisfaction: The role of positive cognitive bias. Journal of Happiness Studies, 3, 37–69. deRidder, D., Scheier, K., & Bensing, J. (2000). The relative benefits of being optimistic: Optimism as a coping resource in multiple sclerosis and Parkinson’s disease. British Journal of Health Psychology, 5, 141–155. de Vellis, R. F., McEvoy, de vellis, B., Sauter, S. V. H., Harring, K., & Cohen, J. L. (1986). Predictors of pain and functioning in arthritis. Health Education Research, 1, 61–67. Evers, A. M. W., Kraaimaat, F. W., Geenen, R., & Bijlsma, J. W. J. (1998). Psychosocial predictors of functional change in recently diagnosed rheumatoid arthritis patients. Behavior Research and Therapy, 36, 179–193. Ferreira, V. M., & Sherman, A. M. (2006). Control beliefs and social relations: Their relationship to well-being outcomes in older adults with Osteoarthritis. International Journal of Aging and Human Development, 62, 255–274.
  • 31. Finch, J. F., & Graziano, W. G. (2001). Predicting depression from temperament, personality, and patterns of social relations. Journal of Personality, 69, 27–52. Fournier, M., de Ridder, D. T. D., & Bensing, J. (2002). Optimism and adaptation to chronic disease: The role of optimism in relation to self-care options of type 1 diabetes mellitus, rheumatoid arthritis and multiple sclerosis. British Journal of Health Psychology, 7, 409–432. Gil, K. M., Keefe, F. J., Crisson, J. E., & Van Dalfsen, P. J. (1987). Social support and pain behavior. Pain, 29, 209–217. Harju, B. L., & Bolen, L. M. (1998). The effects of optimism on coping and perceived quality of life of college students. Journal of Social Behavior and Personality, 13, 185–200. Isaacowitz, D. M., & Seligman, M. E. P. (2002). Cognitive style predictors of affect change in older adults. International Journal of Aging and Human Development, 54, 233–253. Keefe, F. J., & Bonk, V. (1999). Psychosocial assessment of pain in patients having rheumatic diseases. Rheumatic Diseases Clinics of North America, 25, 81–103. Keefe, F. J., Smith, S. J., Buffington, A. L. H., Gibson, J., Studts, J. L., & Caldwell, D. S. (2002). Recent advances and future directions in the biopsychosocial assessment and treatment of arthritis. Journal of Consulting and Clinical Psychology, 70, 640–655. Klinger, L., Spaulding, S. J., Polatajko, H. J., MacKinnon, J. R., & Miller, L. (1999). Chronic pain in the elderly: Occupational adaptation as a means of coping with osteoarthritis of the hip
  • 32. and/or knee. Clinical Journal of Pain, 15, 275–283. Labourde, J. M., & Powers, M. J. (1985). Life satisfaction, health control orientation, and illness-related factors in persons with Osteoarthritis. Research in Nursing and Health, 8, 183–190. Lai, J. C. L. (1994). Differential predictive power of the positively versus the negatively worded items of the Life Orientation Test. Psychological Reports, 75, 1507–1515. Lazarus, R. S., & Folkman, S. (1984). Stress, appraisal, and coping. New York: Springer. Long, B. C., & Sangster, J. L. (1993). Dispositional optimism/ pessimism and coping strategies: Predictors of psychosocial adjustment of rheumatoid and osteoarthritis patients. Journal of Applied Social Psychology, 23, 1069–1091. Marshall, G. N., Wortman, C. B., Kusulas, J. W., Hervig, L. K., & Vickers, R. R. (1992). Distinguishing optimism from pessimism: Relations to fundamental dimensions of mood and personality. Journal of Personality & Social Psychology, 62, 1067–1074. Neugarten, B. L., Havinghurst, R. J., & Tobin, S. S. (1961). The measurement of life satisfaction. Journal of Gerontology, 16, 134–143. Penninx, B. W. J. H., van Tillburg, T., Boeke, A. J. P., Deeg, D. J. H., Kriegsman, D. M. W., & van Eijk, J. Th. M. (1998). Effects of social support and personal coping resources
  • 33. on depressive symptoms: Different for various chronic diseases? Health Psychology, 17, 551–558. Peterson, C., & Bossio, L. M. (1991). Health and Optimism. New York: Free Press. Preacher, K. J., & Leonardelli, G. J. (2003). Calculation for the Sobel Test: An interactive calculation tool for mediation tests. Optimism, pain, social support in well-being 97 Retrieved Sept. 24, 2005, from http://www.unc.edu/�preacher/ sobel/sobel.htm Radloff, L. S. (1977). The CES-D scale: A self-report depression scale for research in the general population. Applied Psychological Measurement, 3, 385–401. Reinhardt, J. P., & Blieszner, R. (2000). Predictors of perceived support quality in visually impaired elders. The Journal of Applied Gerontology, 19, 345–362. Reker, G. T., & Wong, P. T. P. (1985). Personal optimism, physical and mental health: The triumph of successful aging. In J. E. Birren & J. Livingston (Eds.), Cognition, stress and aging (pp. 134–173). New York: Prentice Hall. Roberts, B. L., Matecjyck, M., & Anthony, M. (1996). The effects of social support on the relationship of functional limitations and pain to depression. Arthritis Care and Research, 9, 67–73.
  • 34. Russell, D. W., & Cutrona, C. E. (1991). Social support, stress, and depressive symptoms among the elderly: Test of a process model. Psychology and Aging, 6, 190–201. Sack, K. (1995). Osteoarthritis: A continuing challenge. Western Journal of Medicine, 163, 579–586. Scheier, M. F., & Carver, C. S. (1987). Dispositional optimism and physical well-being: The influence of generalized outcome expectancies on health. Journal of Personality, 55, 169–210. Scheier, M. F., & Carver, C. S. (1992). Effects of optimism on psychological and physical well-being: Theoretical overview and empirical update. Cognitive Theory Research, 16, 201–228. Scheier, M. F., Carver, C. S., & Bridges, M. W. (1994). Distinguishing optimism from neuroticism (and trait anxiety, self-mastery, and self-esteem): A re-evaluation of the Life Orientation Test. Journal of Personality and Social Psychology, 67, 1063–1078. Schulz, R., Tompkins, C. A., & Rau, M. T. (1988). A longitudinal study of the psychosocial impact of stroke on primary support person. Psychology & Aging, 3, 131–141. Schumacker, H. R. (1988). Primer on the rheumatic diseases (9th ed.). Atlanta, GA: Arthritis Foundation. Sherbourne, C. D., & Stewart, A. L. (1991). The MOS social support survey. Social Science and Medicine, 32, 705–714. Sherman, A. (2003). Social relations and depressive symptoms in
  • 35. older adults with osteoarthritis. Social Science and Medicine, 56, 247–257. Symister, P., & Friend, R. (2003). The influence of social support and problematic support on optimism and depression in chronic illness: A prospective study evaluating self-esteem as a mediator. Health Psychology, 22, 123–129. Walen, H. R., & Lachman, M. E. (2000). Social support and strain from partner, family, and friends: Costs and benefits for men and women in adulthood. Journal of Social and Personal Relationships, 17, 5–30. Wallace, K. A., Bisconti, T. L., & Bergeman, C. S. (2001). The mediational effect of hardiness on social support and optimal outcomes in later life. Basic and Applied Social Psychology, 23, 267–279. Ware, J. E., & Sherbourne, C. D. (1992). The MOS 36-item short-form health survey (SF-36): Conceptual framework and item selection. Medical Care, 30, 473–481. Zautra, A. J., Hamilton, N., & Yocum, D. (2000). Patterns of positive social engagement among women with rheumatoid arthritis. The Occupational Therapy Journal of Research, 20, 21s–40s. 98 V. M. Ferreira & A. M. Sherman contentserver__4_.pdf
  • 36. The Relationships among Hope, Pain, Psychological Distress, and Spiritual Well-Being in Oncology Outpatients Blake Rawdin, MD, MPH, 1 Carrie Evans, MA, 2 and Michael W. Rabow, MD 3 Abstract Objective: Limited research in Taiwan and Europe suggest that hope is inversely correlated with certain di- mensions of the pain experience. However, the relationship between hope and pain among oncology out- patients in the United States has not been evaluated. The aims of this study were to investigate the relationship between hope and cancer pain, after accounting for key psychological, demographic, and clinical characteristics. Design: We enrolled a convenience sample of 78 patients who were receiving concurrent oncologic and symptom-focused care in a comprehensive cancer center. Patient demographic and clinical information was obtained from patient report and medical record review. Patients completed the Herth Hope Index, the Brief Pain Inventory, the Hospital Anxiety and Depression Scale, and the Steinhauser Spiritual Concern Probe. Results: Levels of hope were not associated with age, gender, or the presence of metastatic disease. Herth Hope Index scores were negatively correlated with average pain intensity (p = 0.02), worst pain intensity (p < 0.01), pain interference with function (p < 0.05), anxiety (p < 0.01),
  • 37. and depression (p < 0.01), and were positively cor- related with spiritual well-being scores (p < 0.01). However, after controlling for depression and spiritual well- being with regression analysis, the relationship between pain intensity and hope was no longer significant. Conclusions: While an association exists between the patients’ experience of pain and levels of hope in this study, adjustment for depression and spiritual well being eliminates the relationship initially observed. Although the causal relationships have yet to be determined, in our study hope had a stronger connection to psycho-spiritual factors, than to pain experiences or severity. Introduction Maintaining hope in the face of serious illness has longbeen a goal of patients, families, and clinicians. How- ever, relatively little is known about the factors that sustain hope.1,2 Even so, hope is a key clinical and perhaps thera- peutic variable, affecting cancer patients’ adjustment and coping skills, overall well-being, immune function, and quality of life.3–10 Conversely, lack of hope and hopelessness is associated with physical illness, depression, and wish to hasten death.11,12 Therefore, developing greater understand- ing of the demographic and clinical factors that might be as- sociated with or influence a patient’s degree of hope could lead to strategies to identify patients at higher risk for hope- lessness or factors that could be targeted by interventions to improve hope and coping with cancer. Defining and operationalizing hope is a complex endeavor as the term has many different interpretations, meanings, and usages. Qualitative investigations of hope within nursing lit- erature have helped describe and define the concept in terms of its sources, attributes, and goals. According to the
  • 38. conceptual model developed by Dufault and Martocchio, hope is a ‘‘multidimensional dynamic life force characterized by a confident yet uncertain expectation of achieving a future good which, to the hoping person, is realistically possible and personally significant.’’ Furthermore, hope is described as a ‘‘complex of many thoughts, feelings, and actions that change with time.’’ Based on extensive research, Dufault and Mar- tocchio conceptualized hope as composed of two spheres, ‘‘generalized hope’’ and ‘‘particularized hope,’’ each consist- ing of six shared dimensions: cognitive, temporal, affective, behavioral, affiliative, and contextual.13 As described in reviews by Butt14 and by Chi,15 a number of studies have investigated the role of hope in different popu- lations of cancer patients using qualitative and/or quantita- tive methods. Various instruments have been used to measure hope, most common of which is the Hearth Hope Scale and its more concise counterpart, the Herth Hope Index (HHI). Of the 1Department of Psychiatry, 2School of Nursing, 3Division of General Internal Medicine, University of California, San Francisco, San Francisco, California. Accepted September 21, 2012. JOURNAL OF PALLIATIVE MEDICINE Volume 16, Number 2, 2013 ª Mary Ann Liebert, Inc. DOI: 10.1089/jpm.2012.0223 167
  • 39. studies that have quantitatively assessed the relationship be- tween hope and cancer pain, findings have varied.16–21 Some research has evidenced direct negative correlations between pain severity and hope.16,18,22 Other studies, however, show no significant direct correlations between hope scores and pain intensity or duration.17,20 For example, a cross-sectional study of hospitalized cancer patients in Norway found HHI scores correlated negatively with several of the interference items on the Brief Pain Inventory (BPI), but not with pain severity per se.20 A study investigating the association be- tween pain and hope levels in hospitalized Taiwanese cancer patients concluded that HHI scores did not differ between patients with and without cancer pain. However, among those patients with pain, hope levels correlated with patients’ beliefs about their pain symptoms rather than the pain itself (i.e., pain duration, intensity, and relief ), suggesting that cognitive and emotional processing may mediate the rela- tionship between pain and hope.17 To our knowledge, none of the studies focused on hope and pain levels to date have included metrics of both psycholog- ical and spiritual well-being. According to Chochinov and others, spirituality can play a significant role in maintaining hope, and it has been recognized by the Institute of Medicine as an important aspect of supportive care at end of life.22–25 Research has also provided empirical support for the hy- pothesis that spiritual well-being might help to bolster psy- chological functioning and adjustment to illness.15,26–28 Because the prior literature has delivered inconsistent re- sults and primarily focused on inpatients, the goal of this study was to examine the relationship between pain and hope among oncologic outpatients, while also controlling for psy- cho-spiritual factors and other potentially significant clinical and demographic variables. It was also important to evaluate
  • 40. the relationship between hope and pain among patients in the US, because prior published studies were set in Europe and Asia. Methods Patients and setting Patients (n = 78) were recruited from the Symptom Man- agement Service (SMS), an oncologic outpatient consultation service at the University of California, San Francisco (UCSF) Helen Diller Family Comprehensive Cancer Center. Patients were included if they were able to complete surveys in En- glish, able to provide informed consent, were >18 years of age, and had a diagnosis of cancer. Patients with diagnoses of dementia or psychosis were excluded. Institutional Review Board approval was received before data collection began. Medical records were reviewed to confirm cancer diagnoses and to investigate the presence of metastatic disease. Study instruments Patients were recruited in the SMS clinic waiting area. After obtaining written informed consent, patients completed a demographic questionnaire, the HHI, BPI, Hospital Anxiety and Depression Scale (HADS), and Steinhauser Spiritual Concern Probe (SSCP). We selected these measures based on the frequency of their use in the literature, ease of adminis- tration, and construct validity and internal consistency ratings. The HHI is a 12-item score questionnaire that uses a 4-point Likert scale to assess level of hope.29 The HHI, developed in the oncology setting to operationalize and quantify hope for research and clinical purposes, is based upon Dufault and Martocchio’s conceptual framework of hope. Through psy-
  • 41. chometric validation studies using factor analysis, Herth suc- cessfully identified three subscales—temporality and future, positive readiness and expectancy, and interconnectedness. These three subscales correspond to the cognitive-temporal, affective-behavioral, and affiliative-contextual dimensions elucidated in the Dufault and Martocchio model.13 Total HHI score ranges from 12 to 48 with higher scores corre- sponding to higher levels of hope. Overall scores provide a validated and reliable measure of global hope for cancer pa- tients with an alpha coefficient of 0.97 and a reliability coeffi- cient of 0.91.29 The BPI is a valid and reliable scale for assessing both pain intensity and pain interference with daily activities, using an 11-item questionnaire.30 The first part consists of four ques- tions that addresses pain severity (where zero refers to ‘‘no pain’’ and 10 to pain as ‘‘bad as you can imagine’’), whereas the second part asks about pain interference with seven as- pects of function (where zero refers to ‘‘does not interfere’’ and 10 to ‘‘completely interferes’’). The questionnaire in our study was based on pain experienced over the past week, as in the long version of the BPI. The HADS is a tool designed for physically ill patients to measure anxiety and depression. It avoids reliance on the physical symptoms of psychiatric disease that result from the physical illness itself. This 14-item scale has been widely validated for use with cancer patients.31 The SSCP uses a 5-point Likert scale to evaluate a patient’s sense of spiritual well-being by asking to what degree the patient feels ‘‘at peace.’’ Higher scores signify greater spiritual well-being. It has been validated as a screen for spiritual distress, associated with both religious and meaning-making elements of spirituality.32
  • 42. Statistical analysis Data analyses were conducted using SPSS for Mac Release 20.0.0 (SPSS, Inc., Chicago, IL). Descriptive statistics were generated to assess the sample in terms of demographics and clinical characteristics. Pearson’s product moment correla- tions between levels of hope and cancer pain intensity, anxi- ety, depression, spiritual well-being, and demographic variables were determined. Based on the patient sample size, the study achieved power to detect a moderate correlation (r = 0.25–0.30) at 80% power.33 All tests were two-tailed with an alpha = 0.05. A multivariate linear regression model was constructed to evaluate the effects of potential confounders that might sys- tematically bias the association found between pain intensity and HHI scores in the univariate analysis. Each of the vari- ables of interest had skewness values less than twice their standard errors, consistent with normal distributions. Hence, we proceeded with parametric analyses. The dependent var- iable in the model was HHI score. The predictors were se- lected by including demographic and clinical variables deemed important a priori (i.e., age, gender, education, mar- ital status, religion, and the presence of metastatic disease), then clinical predictor variables most highly correlated in the 168 RAWDIN ET AL. univariate correlational analyses (HADS scores, SSCP score, worst pain in the last week, and pain interference with mood and function). Multicollinearity was assessed for these vari- ables with the use of correlation matrices and variance infla- tion factors, as well as the possibility of interaction between pain variables included in the model and depression scores.
  • 43. The final model for the sake of parsimony retained only those factors found to be statistically significant predictors with a p value of < 0.05. An overall goodness of fit of the regression model was calculated. Results Patient enrollment From a convenience sample of SMS patients, 95 patients were approached to participate and 78 (82%) agreed to par- ticipate, provided written informed consent, and completed the questionnaires. Eleven patients (12%) were not enrolled in the study because they either did not meet the inclusion cri- teria (n = 4) or declined to participate (n = 7). In addition, six surveys (6%) were not included in the sample because the questionnaire was inadequately completed, whether due to inadvertent omission of key survey elements (n = 2), patients’ time constraints (n = 2), or the patients’ feeling ‘‘too ill’’ to continue (n = 2). Of the seven patients (7%) who declined to participate, four did so out of concerns about privacy and/or reluctance to participate in research more generally. The other three cited feeling ‘‘too ill’’ or ‘‘too stressed-out.’’ Demographic characteristics The sample consisted of 64% women and 36% men with a mean age of 57.6 years (standard deviation [SD] = 13.0) (Table 1). Nearly 60% of the sample patients were between the ages of 40 and 64; 32% were ‡ 65 years of age and 9% were < 40. Representative of the SMS patient population, 69.2% of patients self-identified as white, 10.3% African American, and 7.7% Asian. The sample patients were highly educated with 83% having completed college or graduate school. Over half (52.6%) of the sample patients were mar-
  • 44. ried or partnered. In terms of religious affiliation, 37.2% identified as Christian, 14.1% as Jewish, 11.5% as Buddhist, 7.7% as other (usually denoted as ‘‘spiritual’’ by patients), and 29.5% as ‘‘none.’’ Clinical characteristics The three most common cancer diagnoses were breast (28.2%), gynecologic (16.7%), and prostate (15.4%), which is reflective of the proportions within the SMS at large. Two- thirds of the patients (66.7%) had metastatic disease. The majority (87.2%) of the sample patients had pain due to the cancer or its treatment. The mean pain score among those with pain over the past week was 3.4 (SD = 2.5) (Table 2). The mean level of pain at the time of the survey and at its worst was 2.8 (SD = 2.7) and 4.7 (SD = 3.4), respectively. The mean total HHI score was 38.2 (SD = 5.09). The mean level of spiri- tual well-being was 3.3 (SD = 1.01). Patients had a mean score of 14.3 on the HADS (SD = 6.3) with 6.6 on the depression subscale (SD = 3.5) and 7.7 on the anxiety subscale (SD = 3.8). Nearly 50% of patients had scores in the normal range on the HADS anxiety subscale, 28% had borderline scores, and 23% had abnormal scores (Table 3). On the HADS depression subscale, 56% of patients had levels in the normal range, 31% of patients scored in the borderline range, and 12% in the abnormal range. Associations between levels of hope and demographics, clinical characteristics, symptoms, and spiritual well-being scores Among the demographic variables (i.e., age, gender, eth- nicity, marital status, religion, and education level), only ed- ucation level showed a significant univariate correlation with
  • 45. HHI scores (Table 3). Higher education level was associated with higher HHI scores (r = 0.26, p = 0.02). HHI was not as- sociated with the presence of metastatic disease. Among pain variables, total HHI scores were negatively correlated with ratings of worst pain over the last week (r = - 0.28, p = 0.01), average pain over the last week (r = - 0.27, p = 0.01), and with all BPI pain interference items except level Table 1. Descriptive Data for the Sample Characteristic n % Gender Women 50 64.10% Men 28 35.90% Education Middle school 1 1.28% High school 12 15.38% College 39 50.00% Graduate degree 26 33.33% Marital Status Single 37 47.44% Married/partnered 41 52.56% Religion Buddhist 9 11.54% Christian 29 37.18% Jewish 11 14.10% Hindu 0 0% Muslim 0 0% None 23 29.49% Other 6 7.69%
  • 46. Primary Cancer Brain 3 3.85% Breast 22 28.21% Gastrointestinal 3 3.85% Gynecologic 13 16.67% Head/Neck 8 10.26% Hematologic 2 2.56% Lung 5 6.41% Other 5 6.41% Prostate 12 15.38% Urological 5 6.41% Age age < 40 7 8.97% age 40-64 46 58.97% age 65 + 25 32.05% Metastatic Disease No 26 33.33% Yes 52 66.67% Ever Had Pain Related to Present Illness? No 10 12.82% Yes 68 87.18% HOPE, PAIN, DISTRESS, AND SPIRITUAL WELL-BEING IN ONCOLOGY OUTPATIENTS 169 of interference with relationships: work (r = - 0.23, p = 0.04), sleep (r = - 0.25, p = 0.03), enjoyment (r = - 0.25, p = 0.02), ability to walk (r = - 0.28, p = 0.01), mood (r = - 0.33, p = 0.004), and general function (r = - 0.28, p = 0.01).
  • 47. Depression and anxiety each were negatively correlated and spiritual well-being positively correlated with total HHI scores with correlations of - 0.56, - 0.48, and 0.52, respec- tively, each with p values of < 0.001. The multivariate linear regression models constructed to predict HHI score (Table 4) indicate that spiritual well-being scores and depression scores were statistically significant predictors of hope. In the final model (Table 4B) SSCP score had a b coefficient of 1.55 ( p < 0.01), and HADS depression score had a b coefficient of - 0.63 ( p < 0.01). The overall ad- justed R2 for the model was 0.38, p < 0.001. Pain intensity, BPI functional interference scores, gender, education, marital status, religious affiliation, metastatic disease, and HADS anxiety scores though initially included in the model were ultimately not statistically significant, and hence not retained in the final regression model. Of note, there were no signifi- cant multiplicative interactions found between pain severity scores and HADS depression scores. Discussion This study is unique in that it is one of the few to examine the relationship between hope and pain among cancer out- patients in the United States, and to our knowledge, the only one of these to also consider spirituality. We also utilized multivariate linear regression to assess confounding by vari- ous demographic and clinical factors. We found that symp- toms of depression and spiritual well-being independently predicted levels of hope, eclipsing the univariate correlation between pain severity and hope initially observed. The pain and levels of hope found in this study are similar to those found in prior literature, which suggests some degree
  • 48. of generalizability. The mean hope level found in this study’s patient population was in the upper range but comparable to those found in other studies with HHI scores ranging between 32.5 and 39.17–20,34–36 The average pain score in the study population was also well within the range found in other Table 2. Scores for Pain, Hope, Depression, Anxiety, and Spiritual Well-Being N Mean SD Min Max BPI Average Pain Over the Last Week 78 3.38 2.45 0 9 Current Level of Pain 78 2.79 2.68 0 9 Worst Pain in Last Week 78 4.67 3.35 0 10 HHI 78 38.22 5.09 28 48 SSCP 77 3.32 1.01 1 5 HADS (Total Score) 77 14.28 6.33 2 31 HADS - Depression Subscale* 77 7.66 3.84 0 15 HADS - Anxiety Subscale* 77 6.62 3.5 1 16 *HADS subscale scores between 0 and 7 is ‘‘normal,’’ 8–10 is ‘‘borderline abnormal,’’ and 11–21 is ‘‘abnormal.’’ Table 3. Univariate Correlations with HHI r p-value* n Demographics
  • 49. Married 0.14 0.24 78 Higher Educational Level 0.26 0.02 78 Male Gender 0.06 0.60 78 Age 0.09 0.42 78 Clinical Characteristics Metastatic Cancer 0.10 0.38 78 Presence of pain due to cancer - 0.01 0.91 78 Worst pain over last 1 week - 0.28 0.01 78 Average pain over last 1 week - 0.27 0.01 78 Pain right now - 0.2 0.08 78 Pain Interference With Function Work - 0.23 0.04 78 Relationships - 0.20 0.08 78 Sleep - 0.25 0.03 78 Enjoyment - 0.25 0.02 78 Ability to Walk - 0.28 0.01 78 Mood - 0.33 < 0.01 77 General Function - 0.28 0.01 78 HADS (Total Score) - 0.62 <0.01 78 Depression subscale - 0.56 <0.01 77 Anxiety subscale - 0.48 <0.01 77 SSCP 0.52 <0.01 77 *Bold indicates p < 0.05. Table 4A. Initial Multivariate Linear Regression Model for HHI Score Regression variables ß (SE) p-value Age - 0.05 (0.04) 0.26 Gender (0 = female; 1 = male) - 1.29 (1.04) 0.22
  • 50. Marital status (0 = single; 1 = married) 1.68 (1.00) 0.10 Metastatic cancer (0 = no; 1 = yes) 1.02 (1.03) 0.33 Any religious affiliation (0 = no; 1 = yes) - 0.08 (1.10) 0.95 Education (0-less than college; 1 = at least college degree) 2.48 (1.43) 0.09 Pain (worst in last week) - 0.09 (0.23) 0.69 SSCP 1.46 (0.62) 0.02 HADS- Depression Score - 0.55 (0.16) <0.01 HADS- Anxiety Score - 0.23 (0.19) 0.24 Pain interference w/ general function - 0.01 (0.26) 0.97 Pain interference w/ mood 0.16 (0.27) 0.57 R = 0.70, R2 = 0.49; adj R2 = 0.40. F(12,62) = 5.03; p < 0.001. Table 4B. Final Multivariate Linear Regression Model for HHI Score ß (SE) p-value
  • 51. SSCP 1.55 (0.53) <0.01 HADS- Depression Score - 0.63 (0.15) <0.01 R = 0.63, R2 = 0.39; adj R2 = 0.38. F(2,73) = 23.72; p < 0.001. 170 RAWDIN ET AL. related studies.17,21,34,35 Our results expand on the existing research in this field by incorporating additional psycho- spiritual factors into the assessment of the relationship be- tween pain and hope. These findings clarify the suggestion in recent literature that hope is related most closely to psycho- social elements of the pain experience, rather than pain intensity.20,21 Among its limitations, our study was cross-sectional. To further explore the causal links between hope, pain, and psycho- spiritual factors, a longitudinal study would be ideal. Additionally, this study was limited by the recruitment pool available within the study site, and the demographics of our population under-represented certain minority groups. This study did not control for certain cancer-related symptoms ex- perienced by patients, such as nausea, dry mouth, insomnia, anorexia, weight loss, and fatigue, which are other potential confounders of the relationship between pain and hope. Also, we did not control for patients’ beliefs regarding their prognoses, although we did record diagnoses and were able to control for the presence of metastases. A final limitation of this study is that we minimized the time burden on patients by using a single- item probe of spiritual well-being. To further explore the complex
  • 52. dimensions of spiritual beliefs would require more extensive quantitative measures than the SSCP or qualitative methods. The lack of congruency between the univariate correlations and multivariate modeling in this study highlights the im- portance of measuring and accounting for factors in multiple domains simultaneously. Based on our findings, we deduce that depressive symptoms and spiritual well-being mediate patients’ experiences of pain, influencing their beliefs about, attitudes toward, and interpretations of pain. As the experi- ence of pain is a subjective phenomenon, the affective and cognitive filtering of pain likely matters more than measure- able nociceptive and neuropathic intensity in relationship to levels of hope.37,38 This study buttresses the notion forwarded by other re- searchers that patients may maintain a sense of hope even while cancer pain and other symptoms progress, as a function of cognitive-affective and psycho-spiritual resources and re- siliency.39 On a practical note, this study suggests that when confronted with a patient who seems to have ‘‘lost hope,’’ the physician should look beyond pain measures and explore psychological adjustment and spiritual concerns. Further- more, interventions to sustain or promote hope among cancer patients with pain should carefully consider the role of mental and spiritual health and well-being. Acknowledgments This research was supported by the School of Medicine and the Department of Psychiatry at University of California, San Francisco, as well as National Institutes of Health (NIH) training grant R25060482. The authors would like to express their deep appreciation to Professor Christine Miaskowsi for reviewing and editing a draft of this manuscript, and to Jodi Ross, who assisted with data collection. We also thank the
  • 53. participants and staff of the UCSF Helen Diller Family Com- prehensive Cancer Center. Author Disclosure Statement No competing financial interests exist. References 1. Nowotny ML: Every tomorrow, a vision of hope. J Psycho- soc Oncol 1991;9:117–127. 2. Fanos JH, Gelinas DF, Foster RS, Postone N, Miller RG: Hope in palliative care: From narcissism to self-transcendence in amyotrophic lateral sclerosis. J Palliat Med 2008;11: 470–475. 3. Axelsson B, Sjoden PO: Quality of life of cancer patients and their spouses in palliative home care. Palliative Med 1998;12:29–39. 4. Brandt BT: The relationship between hopelessness and se- lected variables in women receiving chemotherapy for breast cancer. Oncol Nurs Forum 1987;14:35–39. 5. Farran CJ, Herth KA, Popovich JM: Hope and Hopelessness: Critical Clinical Constructs. Thousand Oaks, CA: Sage Pub- lications, 1995. 6. Taylor EJ: Factors associated with meaning in life among people with recurrent cancer. Oncol Nurs Forum 1993;20:1399–1405; discussion 1406–1407. 7. Udelman DL, Udelman HD: A preliminary report on anti- depressant therapy and its effects on hope and immunity. Soc Sci Med 1985;20:1069–1072.
  • 54. 8. Herth KA: The relationship between level of hope and level of coping response and other variables in patients with cancer. Oncol Nurs Forum 1989;16:67–72. 9. Bishara E, Loew F, Forest MI, Fabre J, Rapin CH: Is there a relationship between psychological well-being and patient- carers consensus? A clinical pilot study. J Palliat Care 1997;13:14–22. 10. Post-White J: How hope affects healing. Creative Nurs 2003;9:10–11. 11. Breitbart W, Rosenfeld B, Pessin H, et al.: Depression, hopelessness, and desire for hastened death in terminally ill patients with cancer. JAMA 2000;284:2907–2911. 12. Gil S, Gilbar O: O. Hopelessness among cancer patients. J Psychosoc Oncol 2001;19:21–33. 13. Dufault K, Martocchio BC: Symposium on compassionate care and the dying experience. Hope: Its spheres and di- mensions. Nurs Clin North Am 1985;20:379–391. 14. Butt CM: Hope in adults with cancer: State of the science. Oncol Nurs Forum 2011;38:E341–E350. 15. Chi GC: The role of hope in patients with cancer. Oncol Nurs Forum 2007;34:415–424. 16. Berendes D, Keefe FJ, Somers TJ, Kothadia SM, Porter LS, Cheavens JS: Hope in the context of lung cancer: Relation- ships of hope to symptoms and psychological distress. J Pain Symptom Manage 2010;40:174–182.
  • 55. 17. Chen ML: Pain and hope in patients with cancer: A role for cognition. Cancer Nurs 2003;26:61–67. 18. Hsu TH, Lu MS, Tsou TS, Lin CC: The relationship of pain, uncertainty, and hope in Taiwanese lung cancer pa- tients. J Pain Symptom Manage 2003;26:835–842. 19. Lin CC, Lai YL, Ward SE: Effect of cancer pain on perfor- mance status, mood states, and level of hope among Tai- wanese cancer patients. J Pain Symptom Manage 2003;25: 29–37. 20. Utne I, Miaskowski C, Bjordal K, Paul SM, Jakobsen G, Rustoen T: The relationship between hope and pain in a sample of hospitalized oncology patients. Palliat Support Care 2008;6:327–334. 21. Utne I, Miaskowski C, Bjordal K, Paul SM, Rustoen T: The relationships between mood disturbances and pain, hope, and quality of life in hospitalized cancer patients with pain HOPE, PAIN, DISTRESS, AND SPIRITUAL WELL-BEING IN ONCOLOGY OUTPATIENTS 171 on regularly scheduled opioid analgesic. J Palliat Med 2010;13:311–318. 22. Chochinov HM, Cann BJ: Interventions to enhance the spiritual aspects of dying. J Palliat Med 2005;8(Suppl 1): S103–S115. 23. Buckley J, Herth K: Fostering hope in terminally ill patients. Nurs Stand 2004;19:33–41.
  • 56. 24. Field MJ, Cassel CK: Approaching death: Improving care at the end of life. Health Prog 2011;92:25. 25. McClement SE, Chochinov HM: Hope in advanced cancer patients. Eur J Cancer (Oxford, England: 1990) 2008;44:1169– 1174. 26. Fehring RJ, Miller JF, Shaw C: Spiritual well-being, religiosity, hope, depression, and other mood states in elderly people coping with cancer. Oncol Nurs Forum 1997;24:663–671. 27. Nelson CJ, Rosenfeld B, Breitbart W, Galietta M: Spirituality, religion, and depression in the terminally ill. Psychosomatics 2002;43:213–220. 28. Mystakidou K, Tsilika E, Parpa E, et al.: Exploring the re- lationships between depression, hopelessness, cognitive status, pain, and spirituality in patients with advanced cancer. Arch Psychiatr Nurs 2007;21:150–161. 29. Herth K: Abbreviated instrument to measure hope: Devel- opment and psychometric evaluation. J Advanced Nurs 1992;17:1251–1259. 30. Cleeland CS, Ryan KM: Pain assessment: Global use of the Brief Pain Inventory. Ann Acad Med, Singapore 1994;23: 129–138. 31. Snaith RP, Zigmond AS: The hospital anxiety and depres- sion scale. Br Med J (Clin Res Ed) 1986;292:344. 32. Steinhauser KE, Voils CI, Clipp EC, Bosworth HB, Christakis
  • 57. NA, Tulsky JA: ‘‘Are you at peace?’’: One item to probe spiritual concerns at the end of life. Arch Intern Med 2006; 166:101–105. 33. Faul F, Erdfelder E, Lang AG, Buchner A: G*Power 3: A flexible statistical power analysis program for the social, behavioral, and biomedical sciences. Behav Res Methods 2007;39:175–191. 34. Ebright PR, Lyon B: Understanding hope and factors that enhance hope in women with breast cancer. Oncol Nurs Forum 2002;29:561–568. 35. Lai YH, Chang JT, Keefe FJ, et al.: Symptom distress, cata- strophic thinking, and hope in nasopharyngeal carcinoma patients. Cancer Nurs 2003;26:485–493. 36. Sanatani M, Schreier G, Stitt L: Level and direction of hope in cancer patients: An exploratory longitudinal study. Sup- port Care Cancer 2008;16:493–499. 37. Boogaard S, Heymans MW, Patijn J, et al.: Predictors for persistent neuropathic pain—a Delphi survey. Pain Physi- cian 2011;14:559–568. 38. Basinski A, Stefaniak T, Stadnyk M, Sheikh A, Vingerhoets AJ: Influence of religiosity on the quality of life and on pain intensity in chronic pancreatitis patients after neurolytic ce- liac plexus block: Case-controlled study. J Relig Health 2011 Feb 1 [Epub ahead of print]. 39. Block SD: Perspectives on care at the close of life. Psycho- logical considerations, growth, and transcendence at the end of life: The art of the possible. JAMA 2001;285:2898–2905. Address correspondence to:
  • 58. Blake Rawdin, MD, MPH University of California, San Francisco Langley Porter Hospital and Clinics 401 Parnassus Avenue Box 0984-RTP San Francisco, CA 94143 E-mail: [email protected] 172 RAWDIN ET AL. Copyright of Journal of Palliative Medicine is the property of Mary Ann Liebert, Inc. and its content may not be copied or emailed to multiple sites or posted to a listserv without the copyright holder's express written permission. However, users may print, download, or email articles for individual use. read_and_evaluate_the_following_research_articles1.docx Read and evaluate the following research articles: · Rawdin, B., Evans, C., & Rabow, M. W. (2013). The relationships among hope, pain, psychological distress, and spiritual well-being in oncology outpatients. Journal of Palliative Medicine, 16(2), 167-172. doi:10.1089/jpm.2012.0223 Link to Article · Ferreira, V. M., & Sherman, A. M. (2007). The relationship of optimism, pain and social support to well-being in older adults with osteoarthritis. Aging & Mental Health, 11(1), 89-98.
  • 59. doi:10.1080/13607860600736166 Link to Article Apply the concepts explored in the articles above by writing a 2-3 page paper in APA format using proper spelling and grammar. Your paper should address the following: 1. Examine the concept of psychological well-being as it relates to the experience of pain and stress. 2. Explore how optimism, hope, distress, and social support play a role in how people experience pain and stress. Be sure to discuss how these elements of psychological well-being contribute to overall physical and mental health. 3. Be sure to reference specific concepts from the articles. Use in-text citations and provide APA formatted References as appropriate. Please refer to Rasmussen's APA Guide located on the Resourcestab for information regarding APA format as well as APA referencing and citation procedures. Submit your completed assignment to the drop box below. Please check the Course Calendar for specific due dates. Save your assignment as a Microsoft Word document. (Mac users, please remember to append the ".docx" extension to the filename.) The name of the file should be your first initial and last name, followed by an underscore and the name of the assignment, and an underscore and the date. An example is shown below: Jstudent_exampleproblem_101504 Lesson II Getting Started with Stats
  • 60. Why Might You Be Involved in Doing Statistical Research?Manager as research-based decision makerSubordinate employee as researcherManager as research services buyer/evaluatorManager as evaluator of secondary data sourcesResearch specialist Research Defined A systematic inquiry at providing information to solve managerial problemsBeginning researchers should understand that research is a process of reasoning with factsI like to “let the data speak to me.”What did you find from your articles for tonight? There is much you can do, but what SHOULD you do? What is the decision dilemma we face? What can research tell us/accomplish? How do we define “best”? What type of study do we need to do? Reporting Descriptive Explanatory Predictive Research Defined continued… Basic vs. applied research Basic – aims to discover new knowledge in a more general sense; scientists Applied – an effort to solve an immediate problem; to make a particular management decision Primary vs. Secondary
  • 61. researchInitial research vs. Problem solvingSurvey vs. Experimental research Research Defined continued… The Role of Statistics in Research“Statistical thinking is necessary…for effective decision making in various facets of business”The science of collecting, organizing, presenting, analyzing, and interpreting data to assist in making more effective decisionsCan be to capture a population’s characteristics & make inferences from a sample’s characteristicsMany firms have data they don’t mine for regular decision making insights. Some ExamplesYou work for Books R Us and have been asked to look at their sales data to see how to boost sales.What questions do we need to ask? To what purpose will the research be put How do I shape my research to provide valid, quantifiable results? If I do an opinion survey, how many people do I need to ask? How do I craft my questions? How have similar studies been conducted in the past? Questions to Ponder…What types of research does your organization use?How can research help your organization save money?Do you feel that the amount of research being conducted has increased or decreased over the past 10 years?How has the Internet changed the quality of quantity of research?
  • 62. Creating a Research Plan and Design Time Series Data for the Economy – in class exercise. Research DesignsThe general research process contains three major stages: Exploration of the situation Collection of data Analysis and interpretation of the resultsWhat questions do the data prompt you to ask?Research study idea: What events triggered changes in key indicators (i.e., oil prices)? How do variables interrelate (i.e., inflation, personal taxes & GDP?) Research DesignsThe essentials of a research design What data do we need? Is the data available? Do we need to “massage” it? Is it longitudinal vs. cross sectional (which was the Econ data and the Gas price data)?Quantitative vs. qualitative data Research Methods Exploratory StudiesUseful when we lack a clear idea of the problemSaves time and money Relies more heavily on qualitative techniquesAn exploratory study is finished when we have achieved the following: Established the major dimensions of the task Defined a set of investigative questions to guide a detailed
  • 63. research design Developed several hypotheses about possible causes of the management dilemma May use a focus group. Case StudiesMuch of what you’ve done so far at UOP has been of this nature.Can be qualitative or quantitative.Will tend to use primary data, but can also use secondary data What kind of data is the Gas Station data? What kind of data are the Econ stats? You might need to interview people – what questions do you ask & how ask them? Descriptive StudiesMore formalized study with clearly stated hypothesis or investigative questionsDescriptions of phenomena associated with a subject population - subjectsDiscovery or associations among different variables – correlational studyHow is this different from a causational study? Need to ask: Do the variables interact/effect each other? In other words, can the “dependent variable” impact or effect the “independent variable” Causal StudiesHow one variable affects, or is responsible for, changes in another variablePossible variable relationships Symmetrical – no direct link, but fluctuate together Reciprocal – when 2 variables mutually influence or reinforce each other Asymmetrical – changes in one variable are responsible for changes in another
  • 64. Questions to Ponder…When is it appropriate to use exploratory research?Descriptive research is usually used in the marketing and sales business functions. What other areas might descriptive research be used?When conducting causal research, how can researchers keep variables constant throughout the entire research period?What factors should be considered when conducting a longitudinal study?Can decision-making be accomplished by using only cross-sectional research? Theory Building TheoryTheory – set of systematically interrelated concepts, definitions, and propositions that are advanced to explain and predict factsOur ability to make rational decisions is measured by the degree to which we combine fact and theory, each of which is necessary for the other to be of valueFor our purposes, it is helpful to do a literature search of studies that are similar in nature to see what “guiding principles” we can glean – we will not be looking to expand the academic literature by coming up with a new theory. Reasoning Deductive reasoning – form of inference; the conclusion must necessarily follow for the reasons given; imply the conclusion and represent a proofFor a deduction to be correct, it must be both true and valid: Premises (reasons) given for the conclusion must agree with the real world (true) The conclusion must necessarily follow from the premises
  • 65. (valid)Use Research to avoid Thoughtless Thinking! Inductive vs. Deductive Thinking Induction vs. Deduction Cont. Deduction: If A = B, and B = C then A = C The conclusion is contained in the premise. If we deny the premise, we deny the conclusion. Induction: A conclusion drawn from one or more facts. The conclusion explains the facts. The facts support the conclusion What Causes Societal Dysfunction? “Data Correlations show that in almost all regards, the highly secular democracies consistently enjoy low rates of societal dysfunction, while pro-religious and anti-evolution America performs poorly.” http://moses.creighton.edu/JRS/2005/2005- 11.html “Since 1962-63 … the judicial rejection of natural law and the embracing of relativism, the United States has become number one in the world in violent crime, divorce, and illegal drug use.” (Barton, David: The Myth of Separation, p. 217, © 1992) What causes societal dysfunction in the U.S.? What is your theory? Hypothesis TestingHypothesis - A tentative explanation for an observation, phenomenon, or scientific problem that can be tested by further investigationRole of the hypothesis
  • 66. Guide the study Identifies relevant factors Leads to data collection Frames work in which to organize conclusions Refining the Research Problem Operational DefinitionsRequires the use of concepts, constructs, and definitions; building blocks of theoryConcept – a generally accepted collection of meanings or characteristics associated with certain events, objects, conditions, situations, and behaviorsThe success of research hinges on: How clearly we conceptualize and how well others understand the concepts we use The challenge is to develop concepts that others will clearly understand Concepts and Constructs Constructs Is an image or idea specifically invented for a given research and/or theory building purposeOperational definitions – stated in terms of specific testing or measurement criteriaVariables – used as a synonym for construct; a symbol to which we assign numerals and values BenchmarkingA search for best practices that leads to superior
  • 67. performance; measurementApplied to many areas goods and services business processes performance measuresKey steps in benchmarking planning, analysis, integration, action, and maturityTypes of benchmarking internal, competitive, functional, and generic Let’s Develop a Bus. Research Problem: Sell More Phone/Data LinesConstruct Market share of lines Install timeframe Sales activity level Pricing Customer service quality Benchmarks Market breakeven % % of orders installed in X time frame 10 new appoint/wk. 10% below SBC Price 2 hr. response time Learning ObjectivesWhat is the Difference between Descriptive and Inferential Statistics?What is a Binomial Distribution and how it relates to StatsWhat is the Variance and Standard DeviationAn Introduction to the Concept of a Z Distribution Table StatisticsThe science of collecting, organizing, presenting,
  • 68. analyzing, and interpreting data to assist in making more effective decisionsDescriptive stats – methods for organizing, summarizing, and presenting data in an informative wayInferential stats – methods used to determine something about a population, based on sample Descriptive StatisticsWith Descriptive Statistics you are simply describing “what is” or “what the data show.”For example, “60% of people survey said they prefer Coke”. Or “Both Social Security and Defense Spending make up 21% of the federal budget.” Example of Gas Price DataGas Station NameDayDateTime of DayLocationGas Price Gas AmericaMonday3/8/2010Morning 21st and Franklin Rd.$2.58 BP Gas StationTuesday3/9/2010Afternoon21st and Post Rd.$2.75 BP Gas StationSunday3/7/2010Morning21st and Post Rd.$2.59 Admiral Gas StationTuesday3/9/2010AfternoonE. 21st Street.$2.59 Marathon Gas StationMonday3/8/2010Evening21st and Mithoeffer Rd.$2.69 Shell Gas StationTuesday3/9/2010Afternoon21st and Post Rd.$2.75 Circle KTuesday3/9/2010Afternoon96th & Meridean$2.75 Meijer Gas StationSaturday3/6/2010MorningRockville & Raceway$2.62 Speedway Gas StationTuesday3/9/2010AfternoonRockville & Girlschool$2.69 Speedway Gas StationTuesday3/9/2010MorningSt. Rd. 32$2.67
  • 69. Each row is a “case”. Variables are across the top. Which one is a quantitative measure? Which is qualitative? See p. 4 and 5 * Inferential StatisticsWith Inferential Statistics you are asking the data to “speak to you” to infer from the sample data certain characteristics about the population we are studying. For example, the formula to the right measures the variation or dispersion of data above and below the population mean. 2 = S (x- µ)2 N
  • 70. µ Variance of a Population How Long does it Take to Catch a Fish? µ Let’s take 4 samples on different parts of the lake to estimate “The Truth”. 30 seconds 30 min. 1 hour 2 hours The Impact of StatisticsPositive Data translation into useful information Answers questions of uncertainty Constructive hedgingNegative Misleading
  • 71. Abusive Preemptive bias The Impact of Statistics continued…Personal “You might not want to use statistics, but statistics are being used on you” Buyer behavior Product availability Wage determination Actuarial tables’ influence on insurance products Queuing theory Variables Types of Variables Categorical Places individual into one of several groups or categories Attribute – gender, age, ethnicity, education levelQuantitative: Takes Numerical values, allowing adding and calculating averages Continuous – can take on fractional values; infinite number of values b/n units on the scale; always an approximate; height Types of Variables Variable – trait, attribute that can take on different values at different timesConstant variable – doesn’t changeQualitative – based on qualities that can be classified but not measured; difference of types of kinds; genderQuantitative – measurable differences in amountDiscrete – no possible
  • 72. values b/n adjacent units on the scale (whole #’s); dichotomous; marital status Flip a coin 10 times.: Either heads or tails (1 or 0) Results in a Binomial Distribution Analogy: Product either perfect or imperfect. We can run statistical tests to predict the probability of H or T, Good or Bad Types of Variables continued…Control – most important in research study; most difficult implications of studyIndependent – research systematically manipulates; experimental treatment; measure to observe effect of dependant variableDependant – researcher measures to observe the effects of independent variableIntervening or modifying – originates within subject; psychological or emotional reaction; can cause errors in study; fear, anxiety, anger, etc. Need to control by getting to know people, developing rapportExtraneous or confounding – Appears to be related, but in fact is not related. Can lead to false conclusions. Make a List of Variables for Gas Price Data…Make a list of the variables for your team project.What type of variable are they?How will you collect the data? What do you know about the data source? – Would someone dispute this data, recommend other data to consider, or a different research design to analyze it? What Type of Data?
  • 73. Levels of Measurement Measurement – procedure for assigning a value (numbers) to an observation (variable) according to certain rulesNominal – categories are mutually exclusive Male vs. Female, Yes vs. NoOrdinal – categories have a logical order Likert Scale, 1 – 5, Strongly Agree to Strongly Disagree (is Bob a good prof.?)Interval – equal distance between categories Time, temp.Ratio – True Zero point exits Height, weight, distance Ratio AnalysisHandout of moving average of GDP.Analyze the Books R Us data – 3 week moving average. (This is on “Books R US Raw Data” excel file.How do we put this into a research question that allows us to collect & analyze data?How will we measure the data we collect? Role of Statistics The Language of Statistics DistributionBar GraphHistogram Pareto ChartTime PlotCross-sectional dataQuartileBox PlotVariance Coefficient of VariationResistant MeasureDegrees of freedom Definitions in StatisticsPopulationSampleStandard deviation Normal DistributionStatistic versus parameterRandomMeanMedianModeRight Skew Left SkewStemplot
  • 74. hypothesis test! = FactorialH0 = Null hypothesisH1 = Alternate hypothesis Measures of Central TendencyCentral Tendency – the tendency of a set of data to center around certain numerical valuesMean – computed by summing all the observations in the sample and dividing the sum by the number of observations; considers the magnitude of each observation Median – is the observation that divides the distribution into equal parts; most typical observation in a distributionMode – the observation that occurs most frequently; if all the values are different, there is no mode Means, Medians, and Modes Age252830303334 Mean =30 Median = 30 Mode = 30 Mean Median Mode Frequency SX N
  • 75. µ = 25+28+30+30+33+34 6 = 30 Measures of Central TendencyThe idea is that the sum of the differences between any given observed value & the mean = 0S(X – up to 0? Calculate Deviation Scores 25 28 30 33 34 -2 +3 -5 +4xx - µ25(25-30)-528(28-30)-230(30-30)030(30- 30)033(33-30)334(34-30)4180/6=300 Population Variance & Population Standard DeviationPopulation variance – can be used to compare dispersion in 2 or more sets of observations On average, 1 standard deviation in student’s ages is 3.0 years from the mean of 30 years. Population Standard deviation – square root of the variance (the more alike they are, more reliable they are) The value s = 3.0 indicates, that on average, observations fall
  • 76. 3.0 units + or - from the mean 9 = 3 = S (x- µ)2 N Measures of Dispersion 2 = S (x- µ)2 N = 54 = 9 variance 6 9 = the measure of variability that indicated how much all of the scores in a distribution typically deviate or vary from the mean Population variance also know as ‘mean deviation’ (mean of squared deviation from the mean)xx - µ(x- µ)225-52528- 2430003000333934416180054 Sample Variance Properties of the “s” Gives a measure of dispersion relative to the mean Sensitive to each score in the distribution If a score is moved closer to the mean, then the standard deviation will decrease, if the score shifts away from mean, the standard deviation increases 3. Tends to underestimate the population variance, so provide
  • 77. an appropriate correction by subtracting 1 from total observations (n-1) Sample Variance Example s2 = S (X - X )2 n – 1 Sample variance formula 54 (5-1) Variance: 13.5 yrs Standard Deviation: 13.5 = 3.67 yrsxx - x(x-x)2x225- 52562528-247843000900333910893441611561500544554 Let’s Analyze Class AgesMean and Standard Deviation For 5 Learning TeamsTeam1Team2Team3Team4Team524353135443134244427 302427312547222442272924212125
  • 78. Calculate means and Standard Deviations. Create a bar chart Create a histo gram Create a Pareto Chart * Bar Chart Chart1Team1Team2Team3Team4Team5 Bar Chart 32.2 28.75 26 33 28.8 Class agesMean and Standard DeviationFor 5 Learning TeamsClass AverageTeam1Team2Team3Team4Team5243531354431342444 27302427312547222442272924212125Mean32.228.75263328.8 29.92Sample Stand Deviation8.70057469376.70198975433.08220700159.14330356 058.84307638787.4238534468Coefficient of Var0.2702041830.23311268710.11854642310.27706980490.307 05126350.2481234441Note that you go to "Insert" then "Function" then "Average"to get the formula for the mean.For