1. Forecasting
Resultado de aprendizaje: Realizar intercambios sociales y prácticos muy
breves, con un vocabulario suficiente
Para hacer una exposición o mantener una conversación sencilla sobre temas
técnicos de Forecasting
1. Elabore una simulación pronostica de la demanda del producto o servicio
según su proyecto de formación.
Tenga en cuenta los siguientes elementos:
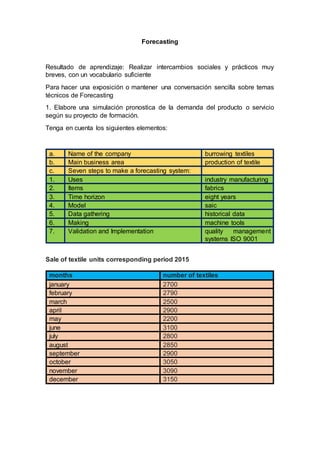
a. Name of the company burrowing textiles
b. Main business area production of textile
c. Seven steps to make a forecasting system:
1. Uses industry manufacturing
2. Items fabrics
3. Time horizon eight years
4. Model saic
5. Data gathering historical data
6. Making machine tools
7. Validation and Implementation quality management
systems ISO 9001
Sale of textile units corresponding period 2015
months number of textiles
january 2700
february 2790
march 2500
april 2900
may 2200
june 3100
july 2800
august 2850
september 2900
october 3050
november 3090
december 3150
2. According to the chart, we can make the following findings:
textile sales between January and April was unchanged from bumps and
more in May which suffered a declibe in sales.
Service was average selling half of 2200-3150 in monthly units.
Sales material are declining in May and with variations in the month of
January, February, March, April and June.
Service sales are stable in July, August, September, October, November
and December.
according to sales trends, the company may choose to hire two more
people for each venue that will cover additional needs arise in the months
of june, october and December.
0
500
1000
1500
2000
2500
3000
3500
0 2 4 6 8 10 12 14
numberoftextiles
months
graphic of the forescat
number of textiles
Linear (number of textiles)