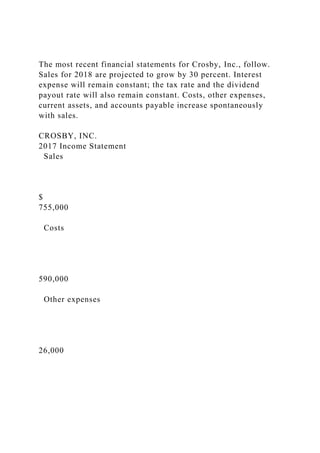
The most recent financial statements for Crosby, Inc., follow. Sales for 2018 are projected to grow by 30 percent. Interest expense will remain constant; the tax rate and the dividend payout rate will also remain constant. Costs, other expenses, current assets, and accounts payable increase spontaneously with sales.
CROSBY, INC.
2017 Income Statement
Sales
$
755,000
Costs
590,000
Other expenses
26,000
Earnings before interest and taxes
$
139,000
Interest paid
22,000
Taxable income
$
117,000
Taxes (22%)
25,740
Net income
$
91,260
Dividends
$
28,291
Addition to retained earnings
62,969
CROSBY, INC.
Balance Sheet as of December 31, 2017
Assets
Liabilities and Owners’ Equity
Current assets
Current liabilities
Cash
$
21,440
Accounts payable
$
55,600
Accounts receivable
44,380
Notes payable
14,800
Inventory
99,960
Total
$
70,400
Total
$
165,780
Long-term debt
$
138,000
Fixed assets
Owners’ equity
Net plant and equipment
$
431,000
Common stock and paid-in surplus
$
118,500
Retained earnings
269,880
Total
$
388,380
Total assets
$
596,780
Total liabilities and owners’ equity
$
596,780
In 2017, the firm operated at 80 percent of capacity. Construct the pro forma income statement and balance sheet for the company. Assume that fixed assets are sold so that the company has a 100 percent asset utilization. (Do not round intermediate calculations.)
Pro Forma Income Statement
Sales
Costs
Other expenses
EBIT
Interest
Taxable income
Taxes
Net income
Pro Forma Balance Sheet
Assets
Liabilities and Owners’ Equity
Current assets
Current liabilities
Cash
Accounts payable
Accounts receivable
Notes payable
Inventory
Total
Total
Long-term debt
Owners’ equity
Fixed assets
Common stock and paid-in surplus
Net plant and equipment
Retained earnings
Total
Total assets
Total liabilities and owners’ equity
What is the EFN? (Do not round intermediate calculations. A negative answer should be indicated by a minus sign.)
EFN =
.
Beyond the EU: DORA and NIS 2 Directive's Global Impact
The most recent financial statements for Crosby, Inc., follow. Sal.docx
1. The most recent financial statements for Crosby, Inc., follow.
Sales for 2018 are projected to grow by 30 percent. Interest
expense will remain constant; the tax rate and the dividend
payout rate will also remain constant. Costs, other expenses,
current assets, and accounts payable increase spontaneously
with sales.
CROSBY, INC.
2017 Income Statement
Sales
$
755,000
Costs
590,000
Other expenses
26,000
2. Earnings before interest and taxes
$
139,000
Interest paid
22,000
Taxable income
$
117,000
Taxes (22%)
4. CROSBY, INC.
Balance Sheet as of December 31, 2017
Assets
Liabilities and Owners’ Equity
Current assets
Current liabilities
Cash
$
21,440
Accounts payable
$
55,600
Accounts receivable
44,380
Notes payable
14,800
8. In 2017, the firm operated at 80 percent of capacity. Construct
the pro forma income statement and balance sheet for the
company. Assume that fixed assets are sold so that the company
has a 100 percent asset utilization. (Do not round intermediate
calculations.)
Pro Forma Income Statement
Sales
Costs
Other expenses
EBIT
Interest
Taxable income
Taxes
Net income
Pro Forma Balance Sheet
Assets
Liabilities and Owners’ Equity
Current assets
Current liabilities
9. Cash
Accounts payable
Accounts receivable
Notes payable
Inventory
Total
Total
Long-term debt
Owners’ equity
Fixed assets
Common stock and paid-in surplus
Net plant and equipment
Retained earnings
Total
Total assets
Total liabilities and owners’ equity
10. What is the EFN? (Do not round intermediate calculations. A
negative answer should be indicated by a minus sign.)
EFN =