Downloaded 23 times
![(
,
:
)
.
(
, NPO, Non-Profit Organization)
.
[1]
(
),
(
)
.
(
(
.
),
)
(
.
.
)](https://image.slidesharecdn.com/20131115-changeon-131114171736-phpapp01/85/2013-2-320.jpg)


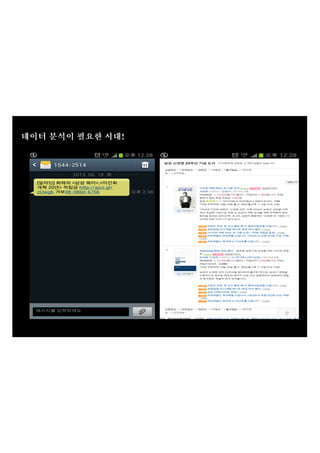
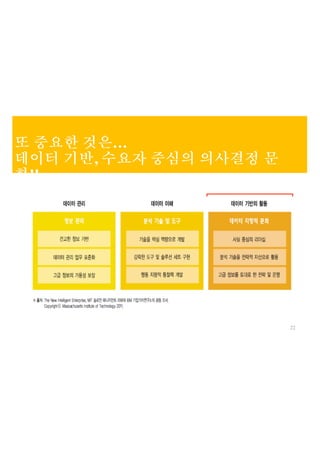
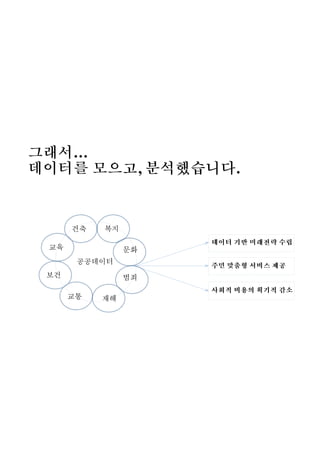
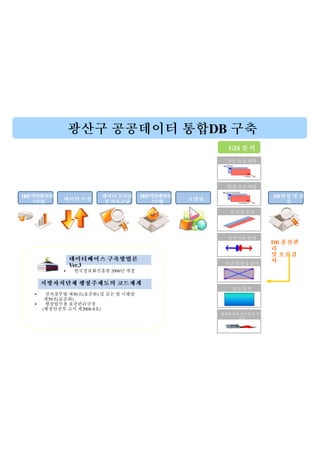
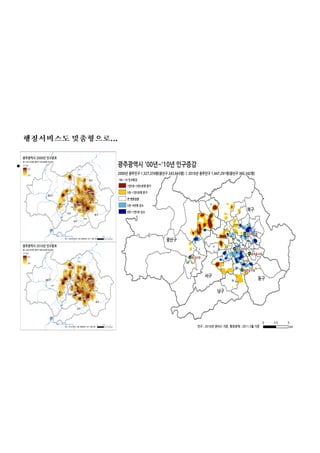
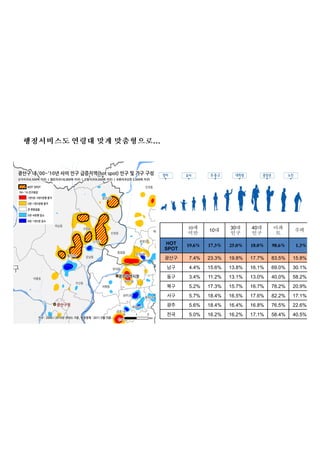
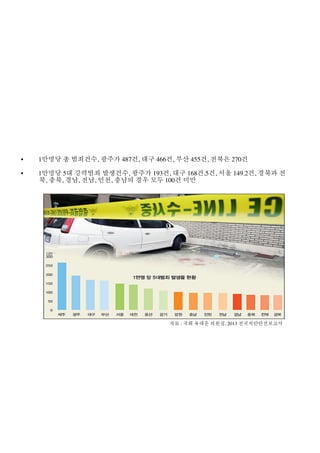
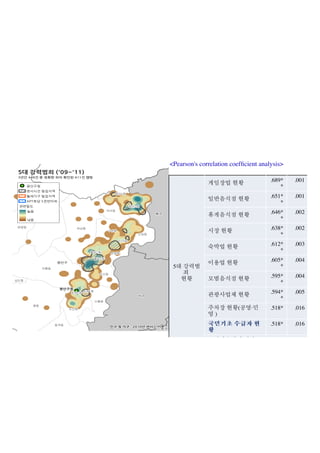
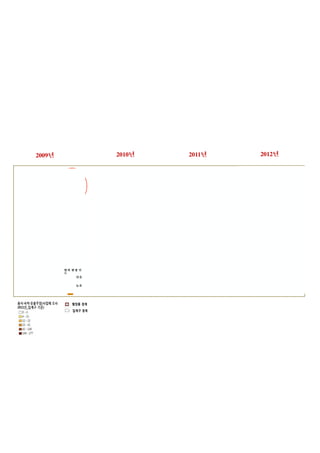
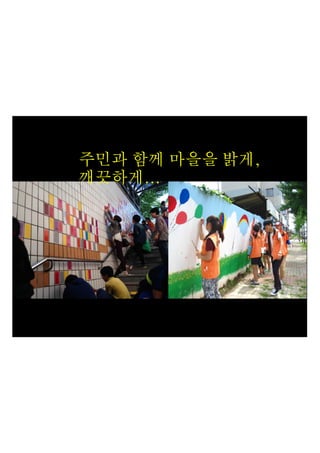
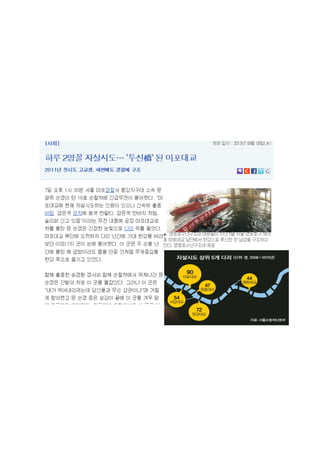

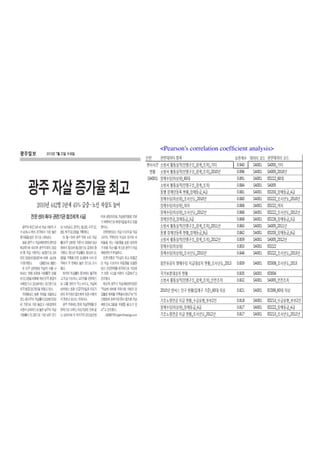
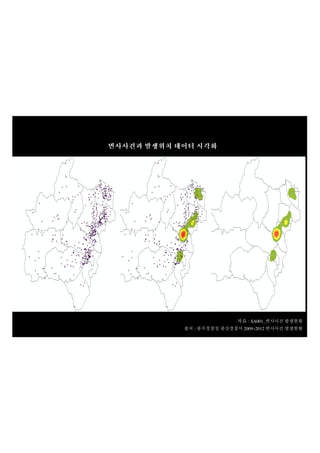
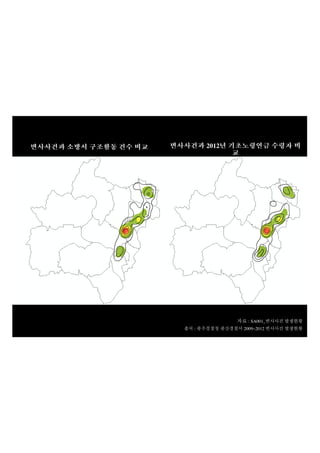
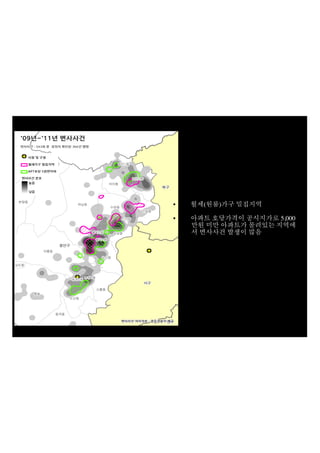

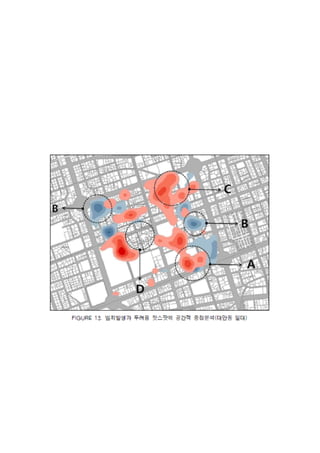
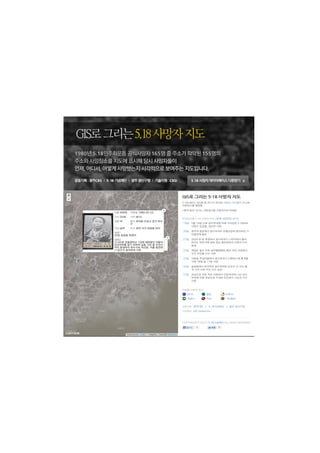
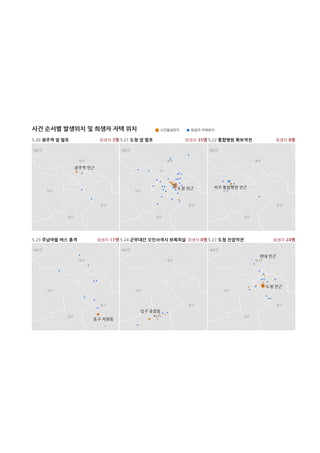

This document discusses using data analysis and visualization to understand social issues and help communities. It provides examples of analyzing government data on welfare recipients and homeless populations to identify service gaps. Maps are shown comparing rates of welfare across districts and over time. Correlation analysis reveals relationships between welfare and unemployment. The document advocates applying these techniques to better understand community needs and allocate resources more effectively.


![[데이터 시각화 3rd 세미나] 공공 데이터 시각화_조용현 통계데이터담당관](https://cdn.slidesharecdn.com/ss_thumbnails/8-150902051915-lva1-app6892-thumbnail.jpg?width=640&height=640&fit=bounds)


![[2020 체인지온] 이슬아와 함께 하는 글쓰기 워크숍](https://cdn.slidesharecdn.com/ss_thumbnails/2020-220318055534-thumbnail.jpg?width=640&height=640&fit=bounds)
![[2020 체인지온] 디지털 너머를 만드는 비영리](https://cdn.slidesharecdn.com/ss_thumbnails/2020-220318055244-thumbnail.jpg?width=640&height=640&fit=bounds)
![[2020 체인지온] 길을 잃고서 길을 보다](https://cdn.slidesharecdn.com/ss_thumbnails/2020-220318054715-thumbnail.jpg?width=640&height=640&fit=bounds)
![[2019 체인지온] 느슨한 연결의 힘 : 우리 모두는 연결되어 있다 - 김민섭 도서출판 <정미소> 대표](https://cdn.slidesharecdn.com/ss_thumbnails/session33-191210062836-thumbnail.jpg?width=640&height=640&fit=bounds)
![[2019 체인지온] 평화운동으로 영리하게 비영리하기 - 문아영 피스모모 대표](https://cdn.slidesharecdn.com/ss_thumbnails/session32-191210062749-thumbnail.jpg?width=640&height=640&fit=bounds)
![[2019 체인지온] 주체성과 꼰대 사이: 페미니즘 리부트 물결 속에서 - 서승희 한국사이버성폭력대응센터 부대표](https://cdn.slidesharecdn.com/ss_thumbnails/session31-191210062625-thumbnail.jpg?width=640&height=640&fit=bounds)
![[2019 체인지온] 디지털 혁신을 넘어 디지털 포용으로 - 민경배 경희사이버대학교 문화커뮤니케이션학부 교수](https://cdn.slidesharecdn.com/ss_thumbnails/session22-191210062430-thumbnail.jpg?width=640&height=640&fit=bounds)
![[2019 체인지온] 인공지능 기술이 만들어가는 모두의 미래 - 김승일 모두의연구소 소장](https://cdn.slidesharecdn.com/ss_thumbnails/session21-191210062246-thumbnail.jpg?width=640&height=640&fit=bounds)
![[2019 체인지온] 예술사회학자의 시선 : 일상의 반지성주의와 혐오 - 이라영 <타락한 저항> 작가](https://cdn.slidesharecdn.com/ss_thumbnails/session12-191210061655-thumbnail.jpg?width=640&height=640&fit=bounds)
![[2018체인지온] 타협하는 말 걸기 - 채반석 MBC 14F 디지털 저널리스트](https://cdn.slidesharecdn.com/ss_thumbnails/10-181218023705-thumbnail.jpg?width=640&height=640&fit=bounds)
![[2018체인지온] 공존의 예의 : 멸종하지 않고, 함께 살아남기 - 이진주 걸스로봇 대표](https://cdn.slidesharecdn.com/ss_thumbnails/9-181218023546-thumbnail.jpg?width=640&height=640&fit=bounds)
![[2018체인지온] 도시청년들에게 농장주를 추천합니다 - 강영수 농업회사법인 희망토(주) 이장](https://cdn.slidesharecdn.com/ss_thumbnails/7-181218023444-thumbnail.jpg?width=640&height=640&fit=bounds)
![[2018체인지온] 비영리, 스타트업으로 재탄생하다](https://cdn.slidesharecdn.com/ss_thumbnails/6-181218023134-thumbnail.jpg?width=640&height=640&fit=bounds)
![[2018체인지온] 인공지능시대의 사회적 과제 - 구본권 한겨레 사람과디지털연구소 소장](https://cdn.slidesharecdn.com/ss_thumbnails/4-181218023018-thumbnail.jpg?width=640&height=640&fit=bounds)
![[2018체인지온] 블록체인, 기술의 시각이 아닌 다른 눈으로 - 이종건 그라운드X 전략이사](https://cdn.slidesharecdn.com/ss_thumbnails/3-181218022922-thumbnail.jpg?width=640&height=640&fit=bounds)
![[2018체인지온] 멸종, 진화의 원동력 - 이정모 서울시립과학관 관장](https://cdn.slidesharecdn.com/ss_thumbnails/2-181218022845-thumbnail.jpg?width=640&height=640&fit=bounds)
![[2018체인지온] 우리가 미처 몰랐던 우리 - 김은미 서울대학교 언론정보학과 교수](https://cdn.slidesharecdn.com/ss_thumbnails/1-181218015423-thumbnail.jpg?width=640&height=640&fit=bounds)
![[2017 체인지온] 체인지온의 10년 이야기 - 방대욱(다음세대재단 대표이사)](https://cdn.slidesharecdn.com/ss_thumbnails/2017-171218032202-thumbnail.jpg?width=640&height=640&fit=bounds)
![[2017 체인지온] 타인에게 물음표를 전하는 방법 - 김민섭('대리사회' 작가)](https://cdn.slidesharecdn.com/ss_thumbnails/2017-171120085733-thumbnail.jpg?width=640&height=640&fit=bounds)
![[2017 체인지온] 디지털 사춘기 시대, 미디어로서 비영리단체 - 강정수(메디아티 대표)](https://cdn.slidesharecdn.com/ss_thumbnails/2017-171120085429-thumbnail.jpg?width=640&height=640&fit=bounds)


![Getting Started with Apache Spark: Big Data Made Simple [Free Meetup]](https://cdn.slidesharecdn.com/ss_thumbnails/apachesparkgettingstarted-260203175547-8361bcc3-thumbnail.jpg?width=640&height=640&fit=bounds)


