Downloaded 103 times


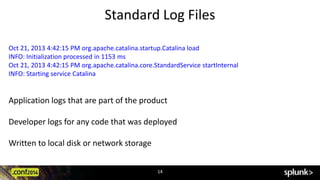
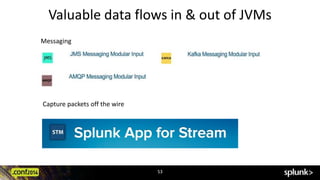
![Garbage Collector Logs
54.736: [Full GC 54.737:
[Tenured: 172798K->18092K(174784K), 2.3792658 secs] 257598K->18092K(259584K),
[Perm : 20476K->20476K(20480K)], 2.4715398 secs] [Times: user=0.56 sys=0.05, real=0.07 secs]
Generated by way of arguments passed to the JVM at startup
15
-verbose:gc
-Xloggc:/home/damien/jvm_logs/gc.log
-XX:+PrintGC
-XX:+PrintGCTimeStamps
-XX:+PrintGCDetails](https://image.slidesharecdn.com/splunkingthejvm-141013104828-conversion-gate02/85/Splunk-Conf-2014-Splunking-the-Java-Virtual-Machine-15-320.jpg)

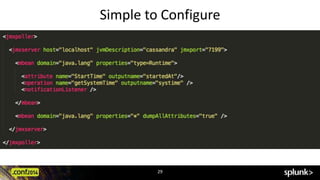


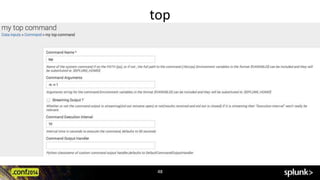


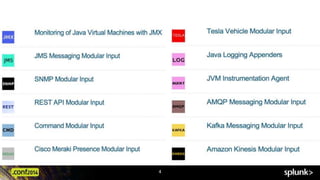
This document discusses monitoring Java Virtual Machines (JVMs) using Splunk. It provides an overview of JVMs and describes various data sources for monitoring JVMs, including logs, JMX, instrumentation agents, and operating system metrics. It also discusses scaling monitoring to multiple JVMs and building Splunk apps for specific JVM-based applications and frameworks.