BACI Sv forecast 2012
•
0 likes•238 views

The document provides an economic forecast for the South Bay and San Francisco regions for 2011-2013. It finds that unemployment is decreasing but remains elevated compared to pre-recession levels. Technology and business services are driving employment growth, though the labor force is aging. Housing is recovering locally in the South Bay while tourism and social media are important in San Francisco. Both regions face challenges from an aging population.

Recommended
More Related Content
Recently uploaded
Recently uploaded (20)
Featured
Featured (20)
BACI Sv forecast 2012
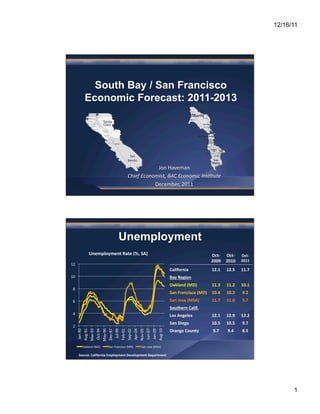
- 1. 12/16/11 South Bay / San Francisco Economic Forecast: 2011-2013 Bodega Bay Petaluma Marin Newark Fremont Milpitas Mountain Vie w Novato Inverness Sunnyvale Palo Alto Santa Cupertino San Jos e Saratog a Los Gatos Clara San Rafael Mill Valley Lexington Hill s Morgan Hill Tiburon San Martin Gilro y San Francisco Daly City Pacifica San Bruno Hollister Montara El Granada Redwood City Menlo Park Half Moon Bay Atherton San Woodside Benito San Mateo Jon Haveman Chief Economist, BAC Economic Ins2tute December, 2011 Unemployment Unemployment Rate (%, SA) Oct-‐ Oct-‐ Oct-‐ 2009 2010 2011 12 California 12.1 12.5 11.7 10 Bay Region Oakland (MD) 11.3 11.2 10.1 8 San Francisco (MD) 10.4 10.3 9.2 6 San Jose (MSA) 11.7 11.0 9.7 Southern Calif. 4 Los Angeles 12.1 12.9 12.2 San Diego 10.5 10.5 9.7 2 Jan-‐90 Aug-‐91 Mar-‐93 Oct-‐94 May-‐96 Dec-‐97 Jul-‐99 Feb-‐01 Sep-‐02 Apr-‐04 Jun-‐07 Nov-‐05 Jan-‐09 Aug-‐10 Orange County 9.7 9.4 8.5 Oakland (MD) San Francisco (MD) San Jose (MSA) Source: California Employment Development Department 1
- 2. 12/16/11 Labor Markets Total NonFarm Employment Peak to Oct-‐ Current 2011 (%) 1,150 1,100 Inland Empire 1,124.1 -‐12.0 1,050 Orange County (MD) 1,378.0 -‐9.7 Oakland (MD) 947.1 -‐9.9 1,000 Los Angeles 5,173.8 -‐8.4 950 CALIFORNIA 14,151.6 -‐7.0 900 San Diego 1,248.1 -‐5.1 850 San Francisco (MD) 953.3 -‐4.9 800 San Jose 882.1 -‐4.2 Jan-‐98 Feb-‐99 Mar-‐00 Apr-‐01 May-‐02 Jun-‐03 Jul-‐04 Aug-‐05 Sep-‐06 Oct-‐07 Dec-‐09 Jan-‐11 Nov-‐08 Oakland (MD) San Francisco (MD) San Jose (MSA) Source: California Employment Development Department Bay Employment Growth San Jose (MSA) Total NonFarm Employment Growth 106 Index = 100 at Onset of Recession 104 102 100 98 96 94 92 90 88 86 84 82 80 0 6 12 18 24 30 36 42 48 54 60 Months Since Onset of Recession 1990 2001 2007 Source: Bureau of Labor StaYsYcs 2
- 3. 12/16/11 Bay Employment Growth San Francisco (MD) Total NonFarm Employment Growth 104 Index = 100 at Onset of Recession 102 100 98 96 94 92 90 88 86 84 0 6 12 18 24 30 36 42 48 54 60 Months Since Onset of Recession 1990 2001 2007 Source: Bureau of Labor StaYsYcs CA Employment Growth Total NonFarm Employment Growth 106 Index = 100 at Onset of Recession 104 102 100 98 96 94 92 90 88 0 6 12 18 24 30 36 42 48 54 60 Months Since Onset of Recession 1990 2001 2007 Source: Bureau of Labor StaYsYcs 3
- 4. 12/16/11 What do we know about SB/SF Economies? South Bay San Francisco • Technology is booming • Bus Srvcs/tourism • Housing is picking up – oriented locally • Social media • Biotech Common Aspects/Issues: • People – Highly educated/high income populaUons – Aging • Business – Business services are important – Venture capital plays a big role – patent heavy! – Significant goods movement gateways • InUmately linked with rest of Bay Area Age Related Challenges San Jose (MSA) PopulaYon Forecast San Francisco (MD) PopulaYon by Age Forecast by Age 35 40 30 35 Percentage of PopulaYon Percentage of PopulaYon 30 25 25 20 20 15 15 10 10 5 5 0 0 20 to 34 35 to 54 55 to 64 65 + 20 to 34 35 to 54 55 to 64 65+ 2010 2020 2010 2020 • Prime working age populaUons shrinking • ReUrement age populaUons growing significantly Source: California Department of Finance 4
- 5. 12/16/11 Educational Opportunity Share of PopulaYon with a Bachelor's Degree or Higher for Selected California CounYes, 2009 Marin San Francisco Santa Clara San Mateo Alameda Contra Costa Orange San Diego Ventura San Luis Obispo California Los Angeles Sacramento Riverside San Bernardino 0 10 20 30 40 50 60 Percentage of PopulaYon Source: US Census Bureau Income Median Household Income for Selected California CounYes, 2009 Marin Santa Clara San Mateo Contra Costa Orange Ventura San Francisco Alameda San Diego California San Luis Obispo Riverside Los Angeles Sacramento San Bernardino 10,000 20,000 30,000 40,000 50,000 60,000 70,000 80,000 90,000 Source: US Census Bureau 5
- 6. 12/16/11 Compensation per Employee $120 $100 Thousands/Year $80 $60 $40 2001 2002 2003 2004 2005 2006 2007 2008 2009 2010 CA San Francisco (MD) Oakland (MD) San Jose (MSA) Source: Bureau of Economic Analysis, California EDD Employment by Industry San Jose (MSA) Employment by Industry – October Professional/Business Manufacturing EducaUon/Health Government Retail Trade Leisure and Hosp. InformaUon Wholesale Trade ConstrucUon Fin. AcUviUes Other Services Transport Warehouse 0 5 10 15 20 25 2011 % Share of Total Non-‐Farm Employment Source: California Employment Development Department 6
- 7. 12/16/11 Employment by Industry San Francisco (MD) Employment by Industry – October Professional/Business Government Leisure and Hosp. EducaUon/Health Retail Trade Fin. AcUviUes InformaUon Other Services Manufacturing Transport Warehouse ConstrucUon Wholesale Trade 0 5 10 15 20 25 2011 % Share of Total Non-‐Farm Employment Source: California Employment Development Department Bay Area Employment Interlinkages Santa Clara San Mateo San Francisco % of Employed Residents Employed Outside of County Marin % of Local Employees from Outside of County Contra Costa Alameda 0 10 20 30 40 50 60 70 Source: U.S. Census Bureau, LEHD 7
- 8. 12/16/11 Job Moves: Santa Clara • 2 largest job trade partners are in Bay Area • ConUguous counUes • Job moves are SMALL in # Job Moves: San Mateo • 3 largest job trade partners are in Bay Area • ConUguous counUes • Job moves are SMALL in # 8
- 9. 12/16/11 Job Moves: SF County • 4 largest job trade partners are in Bay Area • Job moves are SMALL in # • Mecklenberg?? BofA (Charloge) Employment Dynamics San San Jose East Bay Francisco (MSA) San Mateo Job CreaYon (%) -‐ Births 54 51 52 45 -‐ Expansions 39 44 43 44 -‐ Moves 7 5 5 11 Total 100 100 100 100 Job DestrucYon (%) -‐ Deaths 64 60 63 62 -‐ ContracUon 31 30 30 26 -‐ Moves 5 10 7 12 Total 100 100 100 100 Source: NETS 2009, CalculaYons by BACEI 9
- 10. 12/16/11 Manufacturing Manufacturing ProducYvity Manufacturing ProducYvity San Jose (MSA) San Francisco (MSA) 60 250 60 170 Employment Employment Billions of Dollars Billions of Dollars 55 240 50 160 50 230 45 220 40 150 40 210 35 200 30 140 30 190 20 130 25 180 20 170 10 120 15 160 10 150 0 110 2001 2002 2003 2004 2005 2006 2007 2008 2009 2010 2001 2002 2003 2004 2005 2006 2007 2008 2009 2010 Gross Output Employment Gross Output Employment Source: California EDD, Bureau of Labor StaYsYcs National Phenomenon Manufacturing's Share of Total Employment 35 30 25 Percentage of Total Nonfarm 20 15 10 5 0 1990 1992 1994 1996 1998 2000 2002 2004 2006 2008 2010 San Francisco (MD) Oakland (MD) San Jose (MSA) Michigan California Texas Source: Bureau of Labor StaYsYcs 10
- 11. 12/16/11 Employment by Industry San Jose (MSA) Employment by Industry, YTD to Oct. ConstrucUon InformaUon EducaUon/Health Professional/Business Total Nonfarm Manufacturing Wholesale Trade Retail Trade Government Leisure and Hosp. Other Services Transport Warehouse UUl. Fin. AcUviUes -‐6 -‐4 -‐2 0 2 4 6 8 10 12 % Change (Annualized Rate) Source: California Employment 2010 2011 Development Department Tech Sector Growth Oct. 2009 – Oct. 2011 Total 3.8% Computer & Elec Prod Manuf 7.8% InformaUon 16.2% Professional & Business Srvcs 7.2% Source: California Employment Development Department, San Jose MSA 11
- 12. 12/16/11 Employment by Industry San Francisco (MD) Employment by Industry, YTD to Oct. Professional/Business ConstrucUon Leisure and Hosp. Other Services Total Nonfarm EducaUon/Health InformaUon Fin. AcUviUes Government Transport Warehouse UUl. Wholesale Trade Manufacturing Retail Trade -‐8 -‐6 -‐4 -‐2 0 2 4 6 8 % Change (Annualized Rate) 2010 2011 Source: California Employment Development Department Airports – Passenger Flows SJO SFO (Seasonally Adjusted Trend) (Seasonally Adjusted Trend) 1,200 45 2,800 800 InternaYonal Passengers (`000s) DomesYc Passengers (`000s) InternaYonal Passengers (`000s) DomesYc Passengers (`000s 40 2,600 700 1,000 35 600 2,400 800 30 500 25 2,200 600 400 20 2,000 300 400 15 1,800 10 200 200 5 1,600 100 -‐ -‐ 1,400 -‐ Jan-‐00 Jan-‐02 Jan-‐04 Jan-‐06 Jan-‐08 Jan-‐10 Jan-‐00 Oct-‐01 Jul-‐03 Apr-‐05 Jan-‐07 Jul-‐10 Oct-‐08 DomesUc InternaUonal DomesUc InternaUonal Source: RITA 12
- 13. 12/16/11 Venture Capital CA and Bay Shares of U.S. Venture Capital to Q3-‐2011 60 55 Value of All % of Total Q3-‐2011 Deals (Millions) US VC 50 45 California 3,287 47 40 (%) Bay Area 2,668 38 35 30 Oakland (MD) 196 3 25 San Francisco (MD) 1,554 22 20 San Jose (MSA) 897 13 15 Q1-‐95 Q2-‐96 Q3-‐97 Q4-‐98 Q1-‐00 Q2-‐01 Q3-‐02 Q4-‐03 Q1-‐05 Q2-‐06 Q3-‐07 Q4-‐08 Q1-‐10 Q2-‐11 United States 6,952 Bay California Source: PriceWaterhouseCoopers MoneyTree Venture Capital Top 10 VC Investments of 2011 in San Jose (MSA) Amount Company City ($ Millions) Industry Electronics PlasUc Logic Ltd. Mountain View 200 InstrumentaUon PalanUr Technologies Inc. Palo Alto 118 Solware Tabula Inc. Santa Clara 108 Semiconductors Coupons.com Inc. Mountain View 100 Media and Entertainment SoloPower Inc. San Jose 79 Industrial Energy Alta Devices Inc. Santa Clara 72 Biotechnology Medical Devices and Intrapace Inc. Mountain View 61 Equipment CardioDX Inc. Palo Alto 58 Biotechnology iControl Networks Inc. Palo Alto 52 Solware Flipboard Inc. Palo Alto 50 Media and Entertainment Source: PriceWaterhouseCoopers MoneyTree 13
- 14. 12/16/11 Venture Capital Top 10 VC Investments of 2011 in SF (MSA) Amount Company City ($ Millions) Industry BrightSource Energy Oakland 201 Industrial Energy Airbnb Inc. San Francisco 112 Media and Entertainment Square Inc. San Francisco 100 IT Services Kabam Inc. Redwood City 85 Solware Fulcrum BioEnergy Pleasanton 75 Industrial Energy BridgeLux Inc. Livermore 67 Semiconductors Adchemy Inc. Foster City 61 IT Services Nevro CorporaUon Menlo Park 5 Medical Devices and Equipment Yapstone Inc. San Francisco 50 IT Services Eventbrite Inc. San Francisco 50 IT Services Source: PriceWaterhouseCoopers MoneyTree Venture Capital Top VC Investment by Sector in 2011 to Q3 Bay Area East Bay San Francisco San Jose 1 Solware Industrial Energy Solware Solware Media and Medical Devices Media and 2 Entertainment and Equipment Entertainment Semiconductors Medical Devices Medical Devices 3 and Equipment Solware IT Services and Equipment 4 Industrial Energy Biotechnology Biotechnology Industrial Energy Source: PriceWaterhouseCoopers MoneyTree 14
- 15. 12/16/11 Patents Granted Rank Among Total CounYes County 2009 2010 (‘06-‐’10) 1 Santa Clara 7,805 10,047 40,290 2 King, WA 3,026 3,637 13,075 3 Los Angeles 2,216 2,817 11,800 4 San Diego 1,964 2,993 11,120 5 San Mateo 1,954 2,664 10,103 6 Middlesex, MA 1,822 2,564 9,899 7 Alameda 1,690 2,191 8,971 8 Orange 1,648 2,175 8,782 29 Contra Costa 500 659 2,516 Source: US Patent and Trademark Office Local Housing Markets Sales Volume Median Price Oct-‐10 Oct-‐11 % Chng Oct-‐10 Oct-‐11 % Chng Santa Clara 1,374 1,417 3.10% $502,500 $450,000 -‐10.40% Contra Costa 1,333 1,329 -‐0.30% $260,000 $250,750 -‐3.60% Marin 205 230 12.20% $630,000 $602,909 -‐4.30% Riverside 3,264 3,026 -‐7.30% $198,000 $187,000 -‐5.60% San Bernardino 2,343 2,300 -‐1.80% $150,000 $150,000 0.00% Sonoma 386 490 26.90% $309,000 $283,500 -‐8.30% Orange 2,298 2,241 -‐2.50% $438,000 $405,000 -‐7.50% Alameda 1,252 1,308 4.50% $365,000 $340,000 -‐6.80% Los Angeles 5,470 5,830 6.60% $325,000 $300,000 -‐7.70% Solano 517 554 7.20% $205,500 $188,000 -‐8.50% San Diego 2,750 2,759 0.30% $334,500 $315,000 -‐5.80% San Mateo 528 566 7.20% $561,250 $525,000 -‐6.50% Ventura 619 673 8.70% $355,000 $335,000 -‐5.60% San Francisco 436 448 2.80% $652,000 $635,000 -‐2.60% Napa 91 102 12.10% $307,000 $310,000 1.00% Source: DataQuick 15
- 16. 12/16/11 Median Home Prices Through Q3-2011 $1,200 • Price Declines – Peak to $1,000 Current – Bay Area: -‐39% $800 – Marin: -‐18% Thousands MARIN – San Francisco: -‐19% $600 SAN FRANCISCO SAN MATEO – San Mateo: -‐21% $400 SANTA CLARA – Santa Clara -‐27% BAY AREA $200 $0 1989Q3 1991Q2 1993Q1 1994Q4 1996Q3 1998Q2 2000Q1 2001Q4 2003Q3 2005Q2 2007Q1 2008Q4 Source: DataQuick How Many Underwater? as of Q3-11 # Mortgages NegaUve Equity State Underwater Share Nevada 328,369 58.3 Arizona 617,876 47.1 Florida 1,911,419 43.9 Michigan 477,104 34.5 California 2,030,292 29.7 Georgia 488,310 30.0 United States Total 10,723,410 22.1 Local MSAs Oakland-‐Fremont-‐Hayward 157,146 29.0 San Jose-‐Sunnyvale-‐Santa Clara 60,382 17.5 San Francisco-‐San Mateo-‐Redwood City 33,036 10.2 Source: First American CoreLogic 16
- 17. 12/16/11 Home Price Forecast 1,000 Thousands of Dollars 900 San Francisco 800 700 600 500 East Bay San Jose 400 300 200 100 0 Q1-‐1995 Q1-‐1996 Q1-‐1999 Q1-‐2000 Q1-‐2001 Q1-‐2002 Q1-‐2003 Q1-‐2005 Q1-‐2006 Q1-‐2009 Q1-‐2010 Q1-‐2011 Q1-‐2012 Q1-‐2013 Q1-‐2015 Q1-‐2016 Q1-‐1997 Q1-‐1998 Q1-‐2004 Q1-‐2007 Q1-‐2008 Q1-‐2014 SF Actual EB Actual SJ Actual SF Forecast EB Forecast SJ Forecast Source: Beacon Economics Foreclosures Through Q3-2011 9.0 • Current Rates 8.0 – Bay Area: 2.6 7.0 – Alameda: 2.6 Foreclosures / 1,000 Homes 6.0 – Contra Costa: 4.2 5.0 San Francisco (MD) – San Francisco: 0.7 4.0 Oakland (MD) – San Mateo: 1.3 San Jose (MSA) – Marin: 1.2 3.0 – Santa Clara: 1.4 2.0 1.0 0.0 1995Q1 1996Q2 1997Q3 1998Q4 2000Q1 2001Q2 2002Q3 2003Q4 2005Q1 2006Q2 2007Q3 2008Q4 2010Q1 2011Q2 Source: DataQuick 17