
Recommended
More Related Content
What's hot
What's hot (12)
Similar to Excel Financial Analysis Techniques
Similar to Excel Financial Analysis Techniques (20)
More from crmbasel
More from crmbasel (20)
Recently uploaded
Recently uploaded (20)
Excel Financial Analysis Techniques
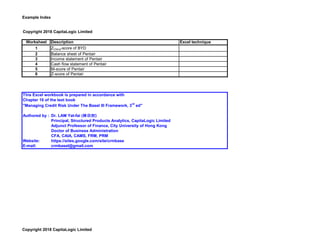
- 1. Example Index Copyright 2018 CapitaLogic Limited Worksheet Description Excel technique 1 ZChina-score of BYD 2 Balance sheet of Pentair 3 Income statement of Pentair 4 Cash flow statement of Pentair 5 M-score of Pentair 6 Z-score of Pentair This Excel workbook is prepared in accordance with Chapter 10 of the text book "Managing Credit Risk Under The Basel III Framework, 3rd ed" Authored by : Dr. LAM Yat-fai (林日辉) Principal, Structured Products Analytics, CapitaLogic Limited Adjunct Professor of Finance, City University of Hong Kong Doctor of Business Administration CFA, CAIA, CAMS, FRM, PRM Website: https://sites.google.com/site/crmbase E-mail: crmbasel@gmail.com Copyright 2018 CapitaLogic Limited
- 2. Example 1 Z China-score of BYD BYD 31 Dec 2016 30 Dec 2015 30 Dec 2014 31 Dec 2016 30 Dec 2015 30 Dec 2014 Total liabilities 8,999 8,966 7,929 X6 0.614980 0.618046 0.592070 α6 -0.46 Total assets 14,633 14,507 13,392 Net profit 78 548 397 X7 0.005330 0.037775 0.029645 α7 9.32 Total assets 14,633 14,507 13,392 Current assets 7,759 7,824 7,041 X8 0.029386 -0.000551 0.028226 α8 0.388 Current liabilities 7,329 7,832 6,663 Total assets 14,633 14,507 13,392 Retain earnings 307 307 238 X9 0.020980 0.021162 0.017772 α9 1.158 Total assets 14,633 14,507 13,392 ZChina-score 0.319485 0.609052 0.552467 Copyright 2018 CapitaLogic Limited
- 3. Example 2 Balance sheet Pentair Ltd. 31 Dec 2012 30 Dec 2011 31 Dec 2010 Assets Current Assets Cash And Cash Equivalents 261,341 50,077 46,056 Short Term Investments - - - Net Receivables 1,292,648 569,204 573,254 Inventory 1,380,271 449,863 405,356 Other Current Assets 326,108 168,691 44,631 Total Current Assets 3,260,368 1,237,835 1,069,297 Long Term Investments - - - Property Plant and Equipment 1,224,488 387,525 329,435 Goodwill 4,894,512 2,273,918 2,066,044 Intangible Assets 1,909,656 592,285 453,570 Accumulated Amortization - - - Other Assets 506,287 94,750 55,187 Deferred Long Term Asset Charges - - - Total Assets 11,795,311 4,586,313 3,973,533 Liabilities Current Liabilities Accounts Payable 864,663 413,271 460,903 Short/Current Long Term Debt 3,096 4,862 4,951 Other Current Liabilities 670,162 223,708 80,942 Total Current Liabilities 1,537,921 641,841 546,796 Long Term Debt 2,454,278 1,304,225 702,521 Other Liabilities 831,653 403,898 349,986 Deferred Long Term Liability Charges 488,102 188,957 169,198 Minority Interest 116,497 114,063 111,879 Negative Goodwill - - - Total Liabilities 5,428,451 2,652,984 1,880,380 Copyright 2018 CapitaLogic Limited
- 4. Example 3 Income statement Pentair Ltd. 31 Dec 2012 30 Dec 2011 31 Dec 2010 Total Revenue 4,416,146 3,456,686 3,030,773 Cost of Revenue 3,146,554 2,382,964 2,100,133 Gross Profit 1,269,592 1,073,722 930,640 Operating Expenses Research Development 93,557 78,158 67,156 Selling General and Administrative 1,158,436 694,841 550,501 Non Recurring 60,718 200,520 - Others - - - Total Operating Expenses - - - Operating Income or Loss -43,119 100,203 312,983 Income from Continuing Operations Total Other Income/Expenses Net -72,465 1,432 1,263 Earnings Before Interest And Taxes -113,428 103,533 316,354 Interest Expense 70,537 60,267 37,379 Income Before Tax -183,965 43,266 278,975 Income Tax Expense -79,353 46,417 88,943 Minority Interest -2,574 -4,299 -4,493 Net Income From Continuing Ops -104,612 -3,151 190,032 Non-recurring Events Discontinued Operations - - -626 Extraordinary Items - - - Effect Of Accounting Changes - - - Other Items - - - Copyright 2018 CapitaLogic Limited
- 5. Example 4 Cash flow statement Pentair Ltd. 31 Dec 2012 30 Dec 2011 31 Dec 2010 Net Income -107,186 -7,450 184,913 Operating Activities Cash Flows Provided By or Used In Depreciation 163,792 108,132 84,179 Adjustments To Net Income -54,850 254,202 28,325 Changes In Accounts Receivables 55,720 1,348 -62,344 Changes In Liabilities -116,125 -52,770 81,778 Changes In Inventories 125,099 18,263 -44,495 Changes In Other Operating Activities -1,064 -5,798 -6,473 Total Cash Flow From Operating Activities 67,960 320,226 270,376 Investing Activities Cash Flows Provided By or Used In Capital Expenditures -94,532 -73,348 -59,523 Investments - - - Other Cash flows from Investing Activities 470,109 -734,738 -790 Total Cash Flows From Investing Activities 375,577 -808,086 -60,313 Financing Activities Cash Flows Provided By or Used In Dividends Paid -113,951 -79,537 -80,112 Sale Purchase of Stock -265,982 537 -14,771 Net Borrowings 227,107 588,216 -98,344 Other Cash Flows from Financing Activities -74,752 - - Total Cash Flows From Financing Activities -232,306 503,553 -190,591 Effect Of Exchange Rate Changes 33 -11,672 -6,812 Change In Cash and Cash Equivalents 211,264 4,021 12,660 Copyright 2018 CapitaLogic Limited
- 6. Example 5 M-score of Pentair Pentair Ltd. 31 Dec 2012 30 Dec 2011 Net Income -107,186 -7,450 Total Cash Flow From Operating Activities 67,960 320,226 Total Assets 11,795,311 4,586,313 Total Revenue 4,416,146 3,456,686 Net Receivables 1,292,648 569,204 Total Revenue 4,416,146 3,456,686 Fixed Assets 8,534,943 3,348,478 Property Plant and Equipment 1,224,488 387,525 Total Assets 11,795,311 4,586,313 Total Liabilities 5,428,451 2,652,984 Total Assets 11,795,311 4,586,313 Selling General and Administrative 1,158,436 694,841 Total Revenue 4,416,146 3,456,686 Gross Profit 1,269,592 1,073,722 Total Revenue 4,416,146 3,456,686 Depreciation 163,792 108,132 Property Plant and Equipment 1,224,488 387,525 Ratio Beta TATA -0.01484878 -0.01484878 -4.679 SGI 4416146 3456686 1.277566432 -0.892 DSRI 0.292709525 0.164667546 1.777578722 -0.92 AQI 0.619776367 0.645606395 0.95999106 -0.404 LVGI 0.4602211 0.578456813 0.795601486 0.327 SGAI 0.26231832 0.20101363 1.304977779 0.172 GMI 0.287488684 0.310621792 1.080466153 -0.528 DEPI 0.117981963 0.218158928 1.849087118 -0.115 M-score 1.448166097 Copyright 2018 CapitaLogic Limited
- 7. Example 6 Z-score of Pentair Pentair Ltd. 31 Dec 2012 30 Dec 2011 31 Dec 2010 31 Dec 2012 30 Dec 2011 31 Dec 2010 Market value of equity 10,135,231 6,864,737 7,528,734 X1 1.867058 2.587553 4.003836 α1 0.6 Book value of liabilities 5,428,451 2,652,984 1,880,380 Current assets 3,260,368 1,237,835 1,069,297 X2 0.146028 0.129951 0.131495 α2 1.2 Current liabilities 1,537,921 641,841 546,796 Total assets 11,795,311 4,586,313 3,973,533 Retain earnings 1,292,288 1,465,780 1,624,605 X3 0.109559 0.319599 0.408857 α3 1.4 Total assets 11,795,311 4,586,313 3,973,533 EBIT -113,428 103,533 316,354 X4 -0.009616 0.022574 0.079615 α4 3.3 Total assets 11,795,311 4,586,313 3,973,533 Sales 4,416,146 3,456,686 3,030,773 X5 0.374398 0.753696 0.762740 α5 0.999 Total assets 11,795,311 4,586,313 3,973,533 Z-score 1.791142 2.983349 4.157203 Copyright 2018 CapitaLogic Limited