SlideShare a Scribd company logo
1 of 4
Research &
Forecast Report
HOUSTON | RETAIL
Q3 2020
Lisa Bridges Director of Market Research | Houston
Retail Trends
Commentary by Hannah Tosch
As COVID-19 continues to press on, tenants and landlords are
working on their real estate strategy for the future. Many months
later, we must all now accept the fact that COVID-19 has made its
permanent imprint on the real estate decision-making process. As
a result of this impact, we see a discrepancy between landlord and
tenant expectations for new leases. To state the obvious, the active
tenants in today’s market are looking for deals. Deals can come
in many forms, whether it be percentage rent, step rent, flexible
commencement dates, more substantial landlord concessions, etc.
While it certainly is a tenant’s market right now, the tenant does not
necessarily hold all the cards. Based on what Colliers sees in the
Houston market, there is a misconception that the tenant is entirely
in the driver’s seat. What is not evident is that most landlords are
not desperate for just any deal put in front of them. In fact, their
approach proves to be far from that.
The majority of the real panic around COVID-19 has mostly settled,
and landlords are no longer making rushed decisions to keep their
centers full. In fact, many landlords are becoming extra cautious
about which tenants they allow in their centers. We see stronger
landlord involvement in vetting and interviewing prospective
tenants. Landlords want to know a tenant’s marketing plan, how
they intend to achieve success and how their other locations
are performing. Of course, these are all boxes they have always
checked, but not quite to this degree. They need to know that a
prospective tenant is substantial and qualified.
Not only are landlords becoming more methodical on who they
allow in, but many are actually more interested in short-term
leases to give themselves more flexibility for the future. Brokers
are getting creative in structuring deals right now, especially when
talking about rent for the beginning of the term. Of late, we have
often seen percentage rent at the beginning of the lease term in
order to get tenants comfortable enough to move forward. While
this structure is often bridging the gap to make deals, this is not
something a landlord would want to entertain long-term.
Houston’s retail landlords work creatively but
cautiously with vetted tenants to close the deal
Summary Statistics
Houston Retail Market Q3 2019 Q2 2020 Q3 2020
Vacancy Rate 5.3% 5.9% 6.1%
Net Absorption (SF)
(million square feet)
1.0M -1.4M 0.08M
Deliveries (SF)
(million square feet)
1.2M 0.4M 0.4M
Under Construction (SF)
(million square feet)
2.7M 1.6M 1.6M
Asking Rents
Per Square Foot Per Year Q3 2019 Q2 2020 Q3 2020
Average NNN $16.65 $17.36 $16.78
Neighborhood Centers $15.87 $15.43 $15.76
Strip Centers $19.35 $19.31 $19.35
The above asking rents are an average of all property types and classes that are currently listed with
an asking rate. This average does not include properties that are fully leased or that do not list an
asking rate. Please see page 2 of this report for an expanded discussion of retail rental rates.
Market Indicators
Relative to prior period
Annual
Change
Quarterly
Change
Quarterly
Forecast*
VACANCY
NET ABSORPTION
DELIVERIES
UNDER CONSTRUCTION
*Projected
2 Houston Research & Forecast Report | Q3 2020 | Retail | Colliers International
Commentary - continued
A landlord wants to feel 100% confident that their tenant will
succeed before signing a lease. There is little room for error
right now after what landlords have been dealing with over the
past eight months. The landlord cannot afford to invest capital
and resources into a new tenant space, only for them to fail in
a few years. Therefore, the new deals that are being made are
happening with strong vetted tenants. Ultimately, this will allow for
an unprecedentedly sustainable retail market with fewer closures,
stable tenants with robust business plans, and eventually fewer
vacancies, which might drive rents up again in the coming years.
Vacancy & Availability
Houston’s average retail vacancy rate rose 20 basis points from
5.9% in Q2 2020 to 6.1% in Q3 2020. At the end of the third quarter,
Houston had 18.2M SF of vacant retail space on the market. Among
the major property types, Theme/Entertainment, Single-Tenant
retail and Malls had the lowest vacancy rates of 1.0%, 2.2% and
2.8%, respectively, followed by Lifestyle Centers at 3.6% and Power
Centers at 5.1%. Neighborhood centers have the highest vacancy
rate of 10.6%, followed by strip centers with a vacancy rate of 9.7%.
Approximately 393,500 SF of new inventory delivered during the
third quarter and currently there is 1.6M SF of retail space under
construction, of which 58% is pre-leased. One of the larger projects
under construction is a Life Time Fitness located at 9000 Six Pines
Drive in the Montgomery County submarket. The development is
expected to deliver in April 2021.
Rental Rates
According to CoStar, our data provider, Houston’s citywide
average quoted retail rental rate for all property types dropped
from $17.36 per SF NNN in Q2 2020 to $16.78 per SF NNN in
Q3 2020. These average rental rates are typically much lower
than actual deal rates since they include all retail property types
and classes, the majority of those properties are not well leased
and are listed with discounted asking rates. According to Colliers’
internal data, Class A in-line retail rental rates can vary widely
from $20.00 to $85.00 per SF, depending on location and
property type.
Absorption & Demand
Houston’s retail market posted 80,417 SF of positive net
absorption in the third quarter. The retail sector posting the
largest amount of positive absorption in Q3 2020 was Power
Centers, with 190,160 SF of positive net absorption. Neighborhood
Centers recorded the largest amount of negative absorption
posting 237,600 SF of negative net absorption. Neighborhood
centers usually have one anchor and the balance of the center is
occupied by smaller retailers offering services from nail salons to
casual dining.
Sales Activity
Source: Real Capital Analytics
Q3 2020
NO. OF PROPERTIES: 16
TOTAL SF: 4.1M
AVERAGE $/SF: $320
AVERAGE CAP RATE: 6.5%
Job Growth & Unemployment
(not seasonally adjusted)
UNEMPLOYMENT 8/19 8/20
HOUSTON 4.1% 8.1%
TEXAS 3.7% 7.0%
U.S. 3.8% 13.9%
JOB GROWTH
Annual
Change
# of Jobs
Lost
HOUSTON -5.8% -182.8K
TEXAS -4.9% -628.8K
U.S. -6.9% -10.4M
Average Price Per SF
$0
$50
$100
$150
$200
$250
$300
$350
U.S. Houston
Average CAP Rate
5.8%
6.0%
6.2%
6.4%
6.6%
6.8%
7.0%
7.2%
7.4%
7.6%
7.8%
U.S. Houston
3 Houston Research & Forecast Report | Q3 2020 | Retail | Colliers International33
Leasing Activity
Houston’s retail leasing activity, which includes renewals, rose 4.3% over the quarter from 1.0M SF in Q2 2020 to 1.1M SF in Q3 2020.
Looking forward, we expect leasing activity to remain flat through year-end. Some of the tenants that signed leases during the third
quarter are listed in the table below.
Q3 2020 Select Retail Lease Transactions
BUILDING NAME/ADDRESS SUBMARKET SF TENANT LEASE DATE
Spring Village Center 1 North 20,000 Rowdy’s1,2
Aug-20
Fondrenwood Shopping Center Southwest 15,000 Black Friday Deals1
Aug-20
Fairway Plaza Southeast 11,998 La Michoacana Meat Market1
Jul-20
Almeda Crossing Southeast 10,481 52 Card Poker1
Aug-20
Waterside Commons Southwest 10,159 Dollar Tree1
Jul-20
Fairway Marketplace Southeast 9,590 Spirit Halloween1
Aug-20
Cullen Boulevard Shopping Center South 9,000 Jolla Bella 31
Sept-20
1
Direct/New		 2
Colliers Transaction
Market Summary
Q3 2020 Retail Market Statistical Summary
PROPERTY TYPE
RENTABLE
AREA
DIRECT
VACANT SF
DIRECT
VACANCY
RATE
SUBLET
VACANT
SF
SUBLET
VACANCY
RATE
TOTAL
VACANT SF
TOTAL
VACANCY
RATE
3Q 2020 NET
ABSORPTION
CLASS A RENTAL
RATES (IN-LINE*)
Strip Centers (unanchored) 38,310,962 3,687,943 9.6% 24,832 0.1% 3,712,775 9.7% 41,060 $25.00-$42.00
Neighborhood Centers (one anchor) 68,747,874 7,162,504 10.4% 112,996 0.2% 7,275,500 10.6% (237,600) $28.00-$46.00
Community Centers (two anchors) 47,846,251 2,703,903 5.7% 140,268 0.3% 2,844,171 5.9% (3,251) $28.00-$45.00
Power Centers (three or more
anchors)
29,991,140 1,494,232 5.0% 46,620 0.2% 1,540,852 5.1% 190,160 $28.00-$45.00
Lifestyle Centers 6,695,527 240,555 3.6% - 0.0% 240,555 3.6% (68,591) $40.00-$85.00
Outlet Centers 1,321,772 82,654 6.3% - 0.0% 82,654 6.3% (27,129) $20.00-$40.00
Theme/Entertainment 717,303 7,238 1.0% - 0.0% 7,238 1.0% - $25.00-$35.00
Single-Tenant 83,699,603 1,740,575 2.1% 118,582 0.1% 1,859,157 2.2% 177,268 N/A
Malls 22,148,960 618,767 2.8% 3,397 0.0% 622,164 2.8% 8,500 N/A
GREATER HOUSTON 299,479,392 17,738,371 5.9% 446,695 0.1% 18,185,066 6.1% 80,417
4 North American Research & Forecast Report | Q4 2014 | Office Market Outlook | Colliers International
Copyright © 2015 Colliers International.
The information contained herein has been obtained from sources deemed reliable. While
every reasonable effort has been made to ensure its accuracy, we cannot guarantee it. No
responsibility is assumed for any inaccuracies. Readers are encouraged to consult their
professional advisors prior to acting on any of the material contained in this report.
Colliers International | Market
000 Address, Suite #
+1 000 000 0000
colliers.com/<<market>>
4 North American Research & Forecast Report | Q4 2014 | Office Market Outlook | Colliers International
Copyright © 2020 Colliers International.
The information contained herein has been obtained from sources deemed reliable. While
every reasonable effort has been made to ensure its accuracy, we cannot guarantee it. No
responsibility is assumed for any inaccuracies. Readers are encouraged to consult their
professional advisors prior to acting on any of the material contained in this report.
Colliers International | Houston
1233 West Loop South, Suite 900
Houston, Texas 77027
+1 713 222 2111
colliers.com/houston
FOR MORE INFORMATION
Lisa Bridges CPRC
Director of Market Research | Houston
+1 713 830 2125
lisa.bridges@colliers.com
Q3 2020 Houston Retail Highlights
6.1% 80,417 SF
VACANCY NET ABSORPTION
CURRENT
TOTAL RETAIL
INVENTORY 299.5M SF LEASING
ACTIVITY
93.9%
OCCUPANCY
UNDER
CONSTRUCTION 1.6M SF
8.1%
QUARTERLY 1.4M SF
Q4 2019 1.6M SF
1.0M SFQ2 2020
Q3 2019
1.4M SFQ1 2020
1.1M SFQ3 2020
Hannah Tosch
Associate | Houston
+1 713 830 2192
hannah.tosch@colliers.com

More Related Content

More from Colliers International | Houston

More from Colliers International | Houston (20)

Q4 2020 Austin Office Report
Q4 2020 Austin Office ReportQ4 2020 Austin Office Report
Q4 2020 Austin Office Report
 
Q4 2020 | Houston Office | Research & Forecast Report
Q4 2020 | Houston Office | Research & Forecast ReportQ4 2020 | Houston Office | Research & Forecast Report
Q4 2020 | Houston Office | Research & Forecast Report
 
Q3 2020 | Austin Industrial | Research & Forecast Report
Q3 2020 | Austin Industrial | Research & Forecast ReportQ3 2020 | Austin Industrial | Research & Forecast Report
Q3 2020 | Austin Industrial | Research & Forecast Report
 
Q3 2020 | The Woodlands Office | Research Snapshot
Q3 2020 | The Woodlands Office | Research SnapshotQ3 2020 | The Woodlands Office | Research Snapshot
Q3 2020 | The Woodlands Office | Research Snapshot
 
Q3 2020 | Fort Bend | Submarket Snapshot
Q3 2020 | Fort Bend | Submarket SnapshotQ3 2020 | Fort Bend | Submarket Snapshot
Q3 2020 | Fort Bend | Submarket Snapshot
 
Q3 2020 | Austin Office | Research & Forecast Report
Q3 2020 | Austin Office | Research & Forecast ReportQ3 2020 | Austin Office | Research & Forecast Report
Q3 2020 | Austin Office | Research & Forecast Report
 
Q3 2020 | Houston Office | Research & Forecast Report
Q3 2020 | Houston Office | Research & Forecast ReportQ3 2020 | Houston Office | Research & Forecast Report
Q3 2020 | Houston Office | Research & Forecast Report
 
Q2 2020 | The Woodlands Office | Research Snapshot
Q2 2020 | The Woodlands Office | Research SnapshotQ2 2020 | The Woodlands Office | Research Snapshot
Q2 2020 | The Woodlands Office | Research Snapshot
 
Q2 2020 | E Fort Bend Commercial Real Estate Trends
Q2 2020 | E Fort Bend Commercial Real Estate TrendsQ2 2020 | E Fort Bend Commercial Real Estate Trends
Q2 2020 | E Fort Bend Commercial Real Estate Trends
 
Mid-Year 2020 | Houston Healthcare | Market Report
Mid-Year 2020 | Houston Healthcare | Market ReportMid-Year 2020 | Houston Healthcare | Market Report
Mid-Year 2020 | Houston Healthcare | Market Report
 
Q2 2020 | Austin Office | Research & Forecast Report
Q2 2020 | Austin Office | Research & Forecast ReportQ2 2020 | Austin Office | Research & Forecast Report
Q2 2020 | Austin Office | Research & Forecast Report
 
Q1 2020 | Austin Industrial | Research & Forecast Report
Q1 2020 | Austin Industrial | Research & Forecast ReportQ1 2020 | Austin Industrial | Research & Forecast Report
Q1 2020 | Austin Industrial | Research & Forecast Report
 
Q1 2020 | The Woodlands Office | Research Snapshot
Q1 2020 | The Woodlands Office | Research SnapshotQ1 2020 | The Woodlands Office | Research Snapshot
Q1 2020 | The Woodlands Office | Research Snapshot
 
Q1 2020 | Fort Bend Submarket Snapshot
Q1 2020 | Fort Bend Submarket SnapshotQ1 2020 | Fort Bend Submarket Snapshot
Q1 2020 | Fort Bend Submarket Snapshot
 
Q1 2020 | Houston Retail | Research & Forecast Report
Q1 2020 | Houston Retail | Research & Forecast ReportQ1 2020 | Houston Retail | Research & Forecast Report
Q1 2020 | Houston Retail | Research & Forecast Report
 
Q1 2020 | Austin Office | Research & Forecast Report
Q1 2020 | Austin Office | Research & Forecast ReportQ1 2020 | Austin Office | Research & Forecast Report
Q1 2020 | Austin Office | Research & Forecast Report
 
Q1 2020 | Houston Industrial Market Report
Q1 2020 | Houston Industrial Market ReportQ1 2020 | Houston Industrial Market Report
Q1 2020 | Houston Industrial Market Report
 
2019 | Year-End Texas Seniors Housing & Care | Research & Forecast Report
2019 | Year-End Texas Seniors Housing & Care | Research & Forecast Report2019 | Year-End Texas Seniors Housing & Care | Research & Forecast Report
2019 | Year-End Texas Seniors Housing & Care | Research & Forecast Report
 
Q4 2019 | E Fort Bend Commercial Real Estate Trends
Q4 2019 | E Fort Bend Commercial Real Estate TrendsQ4 2019 | E Fort Bend Commercial Real Estate Trends
Q4 2019 | E Fort Bend Commercial Real Estate Trends
 
2019 | Year-End Houston Healthcare Market Report
2019 | Year-End Houston Healthcare Market Report2019 | Year-End Houston Healthcare Market Report
2019 | Year-End Houston Healthcare Market Report
 

Recently uploaded

MEQ Mainstreet Equity Corp Q2 2024 Investor Presentation
MEQ Mainstreet Equity Corp Q2 2024 Investor PresentationMEQ Mainstreet Equity Corp Q2 2024 Investor Presentation
MEQ Mainstreet Equity Corp Q2 2024 Investor Presentation
MEQ - Mainstreet Equity Corp.
 
Low rate ↬Call girls in Sabzi Mandi Delhi | 8447779280}Escort Service In All ...
Low rate ↬Call girls in Sabzi Mandi Delhi | 8447779280}Escort Service In All ...Low rate ↬Call girls in Sabzi Mandi Delhi | 8447779280}Escort Service In All ...
Low rate ↬Call girls in Sabzi Mandi Delhi | 8447779280}Escort Service In All ...
asmaqueen5
 
Call Girls In Sarai Rohilla ☎️8447779280{Sarai Rohilla Escort Service In Delh...
Call Girls In Sarai Rohilla ☎️8447779280{Sarai Rohilla Escort Service In Delh...Call Girls In Sarai Rohilla ☎️8447779280{Sarai Rohilla Escort Service In Delh...
Call Girls In Sarai Rohilla ☎️8447779280{Sarai Rohilla Escort Service In Delh...
asmaqueen5
 
Call Girls in Maurice Nagar (Delhi) ꧁8447779280꧂ Female Escorts Service in De...
Call Girls in Maurice Nagar (Delhi) ꧁8447779280꧂ Female Escorts Service in De...Call Girls in Maurice Nagar (Delhi) ꧁8447779280꧂ Female Escorts Service in De...
Call Girls in Maurice Nagar (Delhi) ꧁8447779280꧂ Female Escorts Service in De...
asmaqueen5
 
Low Density Living New Project in BPTP THE AMAARIO Sector 37D Gurgaon Haryana...
Low Density Living New Project in BPTP THE AMAARIO Sector 37D Gurgaon Haryana...Low Density Living New Project in BPTP THE AMAARIO Sector 37D Gurgaon Haryana...
Low Density Living New Project in BPTP THE AMAARIO Sector 37D Gurgaon Haryana...
ApartmentWala1
 
~Call Girls In Roop Nagar {8447779280}(Low Price) Escort Service In Delhi
~Call Girls In Roop Nagar {8447779280}(Low Price) Escort Service In Delhi~Call Girls In Roop Nagar {8447779280}(Low Price) Escort Service In Delhi
~Call Girls In Roop Nagar {8447779280}(Low Price) Escort Service In Delhi
asmaqueen5
 
Low Rate ✨➥9711108085▻✨Call Girls In East Of Kailash (E.K) (Delhi)
Low Rate ✨➥9711108085▻✨Call Girls In East Of Kailash (E.K) (Delhi)Low Rate ✨➥9711108085▻✨Call Girls In East Of Kailash (E.K) (Delhi)
Low Rate ✨➥9711108085▻✨Call Girls In East Of Kailash (E.K) (Delhi)
delhi24hrs1
 
Call girls in Shakti Nagar Delhi~8447779280°/=@/ Short 1500 Night 6000}ESCORT...
Call girls in Shakti Nagar Delhi~8447779280°/=@/ Short 1500 Night 6000}ESCORT...Call girls in Shakti Nagar Delhi~8447779280°/=@/ Short 1500 Night 6000}ESCORT...
Call girls in Shakti Nagar Delhi~8447779280°/=@/ Short 1500 Night 6000}ESCORT...
asmaqueen5
 
Acibadem Konaklari Uskudar - Listin Turkey
Acibadem Konaklari Uskudar - Listin TurkeyAcibadem Konaklari Uskudar - Listin Turkey
Acibadem Konaklari Uskudar - Listin Turkey
Listing Turkey
 
Low Rate ✨➥9582086666▻✨Call Girls In Gurgaon Sector 21 (Gurgaon)
Low Rate ✨➥9582086666▻✨Call Girls In Gurgaon Sector 21 (Gurgaon)Low Rate ✨➥9582086666▻✨Call Girls In Gurgaon Sector 21 (Gurgaon)
Low Rate ✨➥9582086666▻✨Call Girls In Gurgaon Sector 21 (Gurgaon)
delhi24hrs1
 
BPTP THE AMAARIO For The Royals Of Tomorrow in Sector 37D Gurgaon Dwarka Expr...
BPTP THE AMAARIO For The Royals Of Tomorrow in Sector 37D Gurgaon Dwarka Expr...BPTP THE AMAARIO For The Royals Of Tomorrow in Sector 37D Gurgaon Dwarka Expr...
BPTP THE AMAARIO For The Royals Of Tomorrow in Sector 37D Gurgaon Dwarka Expr...
ApartmentWala1
 
Call girls In Rana Pratap Bagh {Delhi ↫8447779280↬Escort Service (Delhi)
Call girls In Rana Pratap Bagh {Delhi ↫8447779280↬Escort Service (Delhi)Call girls In Rana Pratap Bagh {Delhi ↫8447779280↬Escort Service (Delhi)
Call girls In Rana Pratap Bagh {Delhi ↫8447779280↬Escort Service (Delhi)
asmaqueen5
 

Recently uploaded (20)

MEQ Mainstreet Equity Corp Q2 2024 Investor Presentation
MEQ Mainstreet Equity Corp Q2 2024 Investor PresentationMEQ Mainstreet Equity Corp Q2 2024 Investor Presentation
MEQ Mainstreet Equity Corp Q2 2024 Investor Presentation
 
Retail Space for Lease - 1221 W. Main St., Sun Prairie, WI
Retail Space for Lease - 1221 W. Main St., Sun Prairie, WIRetail Space for Lease - 1221 W. Main St., Sun Prairie, WI
Retail Space for Lease - 1221 W. Main St., Sun Prairie, WI
 
Low rate ↬Call girls in Sabzi Mandi Delhi | 8447779280}Escort Service In All ...
Low rate ↬Call girls in Sabzi Mandi Delhi | 8447779280}Escort Service In All ...Low rate ↬Call girls in Sabzi Mandi Delhi | 8447779280}Escort Service In All ...
Low rate ↬Call girls in Sabzi Mandi Delhi | 8447779280}Escort Service In All ...
 
SVN Live 5.6.24 Weekly Property Broadcast
SVN Live 5.6.24 Weekly Property BroadcastSVN Live 5.6.24 Weekly Property Broadcast
SVN Live 5.6.24 Weekly Property Broadcast
 
Call Girls In Sarai Rohilla ☎️8447779280{Sarai Rohilla Escort Service In Delh...
Call Girls In Sarai Rohilla ☎️8447779280{Sarai Rohilla Escort Service In Delh...Call Girls In Sarai Rohilla ☎️8447779280{Sarai Rohilla Escort Service In Delh...
Call Girls In Sarai Rohilla ☎️8447779280{Sarai Rohilla Escort Service In Delh...
 
Real Estate Finance and Investments (2019).pdf
Real Estate Finance and Investments (2019).pdfReal Estate Finance and Investments (2019).pdf
Real Estate Finance and Investments (2019).pdf
 
Bridge & Elliot Ladner Floor Plans May 2024.pdf
Bridge & Elliot Ladner Floor Plans May 2024.pdfBridge & Elliot Ladner Floor Plans May 2024.pdf
Bridge & Elliot Ladner Floor Plans May 2024.pdf
 
Parksville 96 Surrey Floor Plans May 2024
Parksville 96 Surrey Floor Plans May 2024Parksville 96 Surrey Floor Plans May 2024
Parksville 96 Surrey Floor Plans May 2024
 
Call Girls in Maurice Nagar (Delhi) ꧁8447779280꧂ Female Escorts Service in De...
Call Girls in Maurice Nagar (Delhi) ꧁8447779280꧂ Female Escorts Service in De...Call Girls in Maurice Nagar (Delhi) ꧁8447779280꧂ Female Escorts Service in De...
Call Girls in Maurice Nagar (Delhi) ꧁8447779280꧂ Female Escorts Service in De...
 
Kohinoor Courtyard One Wakad Pune | Elegant Living Spaces
Kohinoor Courtyard One Wakad Pune | Elegant Living SpacesKohinoor Courtyard One Wakad Pune | Elegant Living Spaces
Kohinoor Courtyard One Wakad Pune | Elegant Living Spaces
 
Low Density Living New Project in BPTP THE AMAARIO Sector 37D Gurgaon Haryana...
Low Density Living New Project in BPTP THE AMAARIO Sector 37D Gurgaon Haryana...Low Density Living New Project in BPTP THE AMAARIO Sector 37D Gurgaon Haryana...
Low Density Living New Project in BPTP THE AMAARIO Sector 37D Gurgaon Haryana...
 
~Call Girls In Roop Nagar {8447779280}(Low Price) Escort Service In Delhi
~Call Girls In Roop Nagar {8447779280}(Low Price) Escort Service In Delhi~Call Girls In Roop Nagar {8447779280}(Low Price) Escort Service In Delhi
~Call Girls In Roop Nagar {8447779280}(Low Price) Escort Service In Delhi
 
Explore Dual Citizenship in Africa | Citizenship Benefits & Requirements
Explore Dual Citizenship in Africa | Citizenship Benefits & RequirementsExplore Dual Citizenship in Africa | Citizenship Benefits & Requirements
Explore Dual Citizenship in Africa | Citizenship Benefits & Requirements
 
Low Rate ✨➥9711108085▻✨Call Girls In East Of Kailash (E.K) (Delhi)
Low Rate ✨➥9711108085▻✨Call Girls In East Of Kailash (E.K) (Delhi)Low Rate ✨➥9711108085▻✨Call Girls In East Of Kailash (E.K) (Delhi)
Low Rate ✨➥9711108085▻✨Call Girls In East Of Kailash (E.K) (Delhi)
 
Prestige Sancoale Goa Residneces Brochure.pdf
Prestige Sancoale Goa Residneces Brochure.pdfPrestige Sancoale Goa Residneces Brochure.pdf
Prestige Sancoale Goa Residneces Brochure.pdf
 
Call girls in Shakti Nagar Delhi~8447779280°/=@/ Short 1500 Night 6000}ESCORT...
Call girls in Shakti Nagar Delhi~8447779280°/=@/ Short 1500 Night 6000}ESCORT...Call girls in Shakti Nagar Delhi~8447779280°/=@/ Short 1500 Night 6000}ESCORT...
Call girls in Shakti Nagar Delhi~8447779280°/=@/ Short 1500 Night 6000}ESCORT...
 
Acibadem Konaklari Uskudar - Listin Turkey
Acibadem Konaklari Uskudar - Listin TurkeyAcibadem Konaklari Uskudar - Listin Turkey
Acibadem Konaklari Uskudar - Listin Turkey
 
Low Rate ✨➥9582086666▻✨Call Girls In Gurgaon Sector 21 (Gurgaon)
Low Rate ✨➥9582086666▻✨Call Girls In Gurgaon Sector 21 (Gurgaon)Low Rate ✨➥9582086666▻✨Call Girls In Gurgaon Sector 21 (Gurgaon)
Low Rate ✨➥9582086666▻✨Call Girls In Gurgaon Sector 21 (Gurgaon)
 
BPTP THE AMAARIO For The Royals Of Tomorrow in Sector 37D Gurgaon Dwarka Expr...
BPTP THE AMAARIO For The Royals Of Tomorrow in Sector 37D Gurgaon Dwarka Expr...BPTP THE AMAARIO For The Royals Of Tomorrow in Sector 37D Gurgaon Dwarka Expr...
BPTP THE AMAARIO For The Royals Of Tomorrow in Sector 37D Gurgaon Dwarka Expr...
 
Call girls In Rana Pratap Bagh {Delhi ↫8447779280↬Escort Service (Delhi)
Call girls In Rana Pratap Bagh {Delhi ↫8447779280↬Escort Service (Delhi)Call girls In Rana Pratap Bagh {Delhi ↫8447779280↬Escort Service (Delhi)
Call girls In Rana Pratap Bagh {Delhi ↫8447779280↬Escort Service (Delhi)
 

Q3 2020 | Houston Retail | Research & Forecast Report

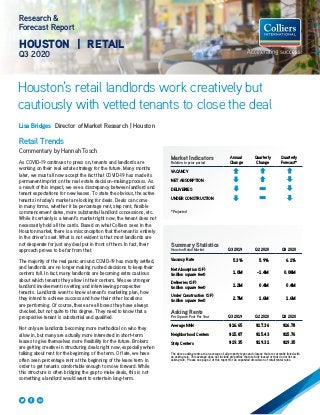
  • 1. Research & Forecast Report HOUSTON | RETAIL Q3 2020 Lisa Bridges Director of Market Research | Houston Retail Trends Commentary by Hannah Tosch As COVID-19 continues to press on, tenants and landlords are working on their real estate strategy for the future. Many months later, we must all now accept the fact that COVID-19 has made its permanent imprint on the real estate decision-making process. As a result of this impact, we see a discrepancy between landlord and tenant expectations for new leases. To state the obvious, the active tenants in today’s market are looking for deals. Deals can come in many forms, whether it be percentage rent, step rent, flexible commencement dates, more substantial landlord concessions, etc. While it certainly is a tenant’s market right now, the tenant does not necessarily hold all the cards. Based on what Colliers sees in the Houston market, there is a misconception that the tenant is entirely in the driver’s seat. What is not evident is that most landlords are not desperate for just any deal put in front of them. In fact, their approach proves to be far from that. The majority of the real panic around COVID-19 has mostly settled, and landlords are no longer making rushed decisions to keep their centers full. In fact, many landlords are becoming extra cautious about which tenants they allow in their centers. We see stronger landlord involvement in vetting and interviewing prospective tenants. Landlords want to know a tenant’s marketing plan, how they intend to achieve success and how their other locations are performing. Of course, these are all boxes they have always checked, but not quite to this degree. They need to know that a prospective tenant is substantial and qualified. Not only are landlords becoming more methodical on who they allow in, but many are actually more interested in short-term leases to give themselves more flexibility for the future. Brokers are getting creative in structuring deals right now, especially when talking about rent for the beginning of the term. Of late, we have often seen percentage rent at the beginning of the lease term in order to get tenants comfortable enough to move forward. While this structure is often bridging the gap to make deals, this is not something a landlord would want to entertain long-term. Houston’s retail landlords work creatively but cautiously with vetted tenants to close the deal Summary Statistics Houston Retail Market Q3 2019 Q2 2020 Q3 2020 Vacancy Rate 5.3% 5.9% 6.1% Net Absorption (SF) (million square feet) 1.0M -1.4M 0.08M Deliveries (SF) (million square feet) 1.2M 0.4M 0.4M Under Construction (SF) (million square feet) 2.7M 1.6M 1.6M Asking Rents Per Square Foot Per Year Q3 2019 Q2 2020 Q3 2020 Average NNN $16.65 $17.36 $16.78 Neighborhood Centers $15.87 $15.43 $15.76 Strip Centers $19.35 $19.31 $19.35 The above asking rents are an average of all property types and classes that are currently listed with an asking rate. This average does not include properties that are fully leased or that do not list an asking rate. Please see page 2 of this report for an expanded discussion of retail rental rates. Market Indicators Relative to prior period Annual Change Quarterly Change Quarterly Forecast* VACANCY NET ABSORPTION DELIVERIES UNDER CONSTRUCTION *Projected
  • 2. 2 Houston Research & Forecast Report | Q3 2020 | Retail | Colliers International Commentary - continued A landlord wants to feel 100% confident that their tenant will succeed before signing a lease. There is little room for error right now after what landlords have been dealing with over the past eight months. The landlord cannot afford to invest capital and resources into a new tenant space, only for them to fail in a few years. Therefore, the new deals that are being made are happening with strong vetted tenants. Ultimately, this will allow for an unprecedentedly sustainable retail market with fewer closures, stable tenants with robust business plans, and eventually fewer vacancies, which might drive rents up again in the coming years. Vacancy & Availability Houston’s average retail vacancy rate rose 20 basis points from 5.9% in Q2 2020 to 6.1% in Q3 2020. At the end of the third quarter, Houston had 18.2M SF of vacant retail space on the market. Among the major property types, Theme/Entertainment, Single-Tenant retail and Malls had the lowest vacancy rates of 1.0%, 2.2% and 2.8%, respectively, followed by Lifestyle Centers at 3.6% and Power Centers at 5.1%. Neighborhood centers have the highest vacancy rate of 10.6%, followed by strip centers with a vacancy rate of 9.7%. Approximately 393,500 SF of new inventory delivered during the third quarter and currently there is 1.6M SF of retail space under construction, of which 58% is pre-leased. One of the larger projects under construction is a Life Time Fitness located at 9000 Six Pines Drive in the Montgomery County submarket. The development is expected to deliver in April 2021. Rental Rates According to CoStar, our data provider, Houston’s citywide average quoted retail rental rate for all property types dropped from $17.36 per SF NNN in Q2 2020 to $16.78 per SF NNN in Q3 2020. These average rental rates are typically much lower than actual deal rates since they include all retail property types and classes, the majority of those properties are not well leased and are listed with discounted asking rates. According to Colliers’ internal data, Class A in-line retail rental rates can vary widely from $20.00 to $85.00 per SF, depending on location and property type. Absorption & Demand Houston’s retail market posted 80,417 SF of positive net absorption in the third quarter. The retail sector posting the largest amount of positive absorption in Q3 2020 was Power Centers, with 190,160 SF of positive net absorption. Neighborhood Centers recorded the largest amount of negative absorption posting 237,600 SF of negative net absorption. Neighborhood centers usually have one anchor and the balance of the center is occupied by smaller retailers offering services from nail salons to casual dining. Sales Activity Source: Real Capital Analytics Q3 2020 NO. OF PROPERTIES: 16 TOTAL SF: 4.1M AVERAGE $/SF: $320 AVERAGE CAP RATE: 6.5% Job Growth & Unemployment (not seasonally adjusted) UNEMPLOYMENT 8/19 8/20 HOUSTON 4.1% 8.1% TEXAS 3.7% 7.0% U.S. 3.8% 13.9% JOB GROWTH Annual Change # of Jobs Lost HOUSTON -5.8% -182.8K TEXAS -4.9% -628.8K U.S. -6.9% -10.4M Average Price Per SF $0 $50 $100 $150 $200 $250 $300 $350 U.S. Houston Average CAP Rate 5.8% 6.0% 6.2% 6.4% 6.6% 6.8% 7.0% 7.2% 7.4% 7.6% 7.8% U.S. Houston
  • 3. 3 Houston Research & Forecast Report | Q3 2020 | Retail | Colliers International33 Leasing Activity Houston’s retail leasing activity, which includes renewals, rose 4.3% over the quarter from 1.0M SF in Q2 2020 to 1.1M SF in Q3 2020. Looking forward, we expect leasing activity to remain flat through year-end. Some of the tenants that signed leases during the third quarter are listed in the table below. Q3 2020 Select Retail Lease Transactions BUILDING NAME/ADDRESS SUBMARKET SF TENANT LEASE DATE Spring Village Center 1 North 20,000 Rowdy’s1,2 Aug-20 Fondrenwood Shopping Center Southwest 15,000 Black Friday Deals1 Aug-20 Fairway Plaza Southeast 11,998 La Michoacana Meat Market1 Jul-20 Almeda Crossing Southeast 10,481 52 Card Poker1 Aug-20 Waterside Commons Southwest 10,159 Dollar Tree1 Jul-20 Fairway Marketplace Southeast 9,590 Spirit Halloween1 Aug-20 Cullen Boulevard Shopping Center South 9,000 Jolla Bella 31 Sept-20 1 Direct/New 2 Colliers Transaction Market Summary Q3 2020 Retail Market Statistical Summary PROPERTY TYPE RENTABLE AREA DIRECT VACANT SF DIRECT VACANCY RATE SUBLET VACANT SF SUBLET VACANCY RATE TOTAL VACANT SF TOTAL VACANCY RATE 3Q 2020 NET ABSORPTION CLASS A RENTAL RATES (IN-LINE*) Strip Centers (unanchored) 38,310,962 3,687,943 9.6% 24,832 0.1% 3,712,775 9.7% 41,060 $25.00-$42.00 Neighborhood Centers (one anchor) 68,747,874 7,162,504 10.4% 112,996 0.2% 7,275,500 10.6% (237,600) $28.00-$46.00 Community Centers (two anchors) 47,846,251 2,703,903 5.7% 140,268 0.3% 2,844,171 5.9% (3,251) $28.00-$45.00 Power Centers (three or more anchors) 29,991,140 1,494,232 5.0% 46,620 0.2% 1,540,852 5.1% 190,160 $28.00-$45.00 Lifestyle Centers 6,695,527 240,555 3.6% - 0.0% 240,555 3.6% (68,591) $40.00-$85.00 Outlet Centers 1,321,772 82,654 6.3% - 0.0% 82,654 6.3% (27,129) $20.00-$40.00 Theme/Entertainment 717,303 7,238 1.0% - 0.0% 7,238 1.0% - $25.00-$35.00 Single-Tenant 83,699,603 1,740,575 2.1% 118,582 0.1% 1,859,157 2.2% 177,268 N/A Malls 22,148,960 618,767 2.8% 3,397 0.0% 622,164 2.8% 8,500 N/A GREATER HOUSTON 299,479,392 17,738,371 5.9% 446,695 0.1% 18,185,066 6.1% 80,417
  • 4. 4 North American Research & Forecast Report | Q4 2014 | Office Market Outlook | Colliers International Copyright © 2015 Colliers International. The information contained herein has been obtained from sources deemed reliable. While every reasonable effort has been made to ensure its accuracy, we cannot guarantee it. No responsibility is assumed for any inaccuracies. Readers are encouraged to consult their professional advisors prior to acting on any of the material contained in this report. Colliers International | Market 000 Address, Suite # 000 Address, Suite # +1 000 000 0000 colliers.com/<<market>> 4 North American Research & Forecast Report | Q4 2014 | Office Market Outlook | Colliers International Copyright © 2020 Colliers International. The information contained herein has been obtained from sources deemed reliable. While every reasonable effort has been made to ensure its accuracy, we cannot guarantee it. No responsibility is assumed for any inaccuracies. Readers are encouraged to consult their professional advisors prior to acting on any of the material contained in this report. Colliers International | Houston 1233 West Loop South, Suite 900 Houston, Texas 77027 +1 713 222 2111 colliers.com/houston FOR MORE INFORMATION Lisa Bridges CPRC Director of Market Research | Houston +1 713 830 2125 lisa.bridges@colliers.com Q3 2020 Houston Retail Highlights 6.1% 80,417 SF VACANCY NET ABSORPTION CURRENT TOTAL RETAIL INVENTORY 299.5M SF LEASING ACTIVITY 93.9% OCCUPANCY UNDER CONSTRUCTION 1.6M SF 8.1% QUARTERLY 1.4M SF Q4 2019 1.6M SF 1.0M SFQ2 2020 Q3 2019 1.4M SFQ1 2020 1.1M SFQ3 2020 Hannah Tosch Associate | Houston +1 713 830 2192 hannah.tosch@colliers.com