The document discusses how to validate a client churn prediction model using survival analysis techniques. It begins with an overview of the Kaplan-Meier estimator and Cox Proportional Hazards Model (CPH) for fitting survival analysis models. It then discusses checking the assumptions of the CPH model using concordance scores, residuals, and other validation metrics like AUC. The document provides guidance on validating the model structure, proportional hazards assumption, influence of outliers, and accuracy for different customer risk groups.


![9PyData London 2019
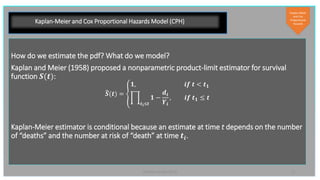
Kaplan-Meier and Cox Proportional Hazards Model (CPH)
Time to event T is a positive random variable. It has a pdf:
𝒇 𝒕 = lim
∆𝒕→𝟎+
𝟏
∆𝒕
𝑷(𝒕 ≤ 𝑻 < 𝒕 + ∆𝒕)
A survival function S(t) is a probability that an individual survives longer than t:
𝑺 𝒕 = 𝑷 𝑻 > 𝒕 = 𝟏 − 𝑷 𝑻 ≤ 𝒕 = 𝟏 −
𝟎
𝒕
𝒇 𝒖 𝒅𝒖
𝑺 𝒕 = 𝟏 − 𝑭(𝒕)
A hazard function is an instantaneous failure rate at time t given alive up to t:
𝒉 𝒕 = lim
∆𝒕→𝟎+
𝟏
∆𝒕
𝑷 𝒕 ≤ 𝑻 < 𝒕 + ∆𝒕 𝑻 ≥ 𝒕 =
𝒇 𝒕
𝑺(𝒕)
=
−𝒅 𝒍𝒏[𝑺 𝒕 ]
𝒅𝒕
A cumulative hazard function at time t:
𝑯(𝒕) =
𝟎
𝒕
𝒉 𝒖 𝒅𝒖 = −𝒍𝒏 [𝑺 𝒕 ]
Kaplan-Meier
and Cox
Proportional
Hazards](https://image.slidesharecdn.com/pydataslides-190720094244/85/How-to-Validate-you-Client-Churn-Model-9-320.jpg)


![24PyData London 2019
Concordance Scores and Residuals – C-Score
However, censored observations are compared even in the presence of ties.
Censored observation may result in the upward bias in C-score.
H. Uno et.al [2] proposed an estimator free of censoring distribution.
Definition:
proportion of pairs that are concordant in duration vs. estimated hazard,
weighted by censoring probability derived with Kaplan-Meier estimator
The observed difference between C-score and C-score IPCW depends on the distribution of
censorship and which records are censored.
*IPCW – inverse probability of censoring weights
Scores and
Residuals](https://image.slidesharecdn.com/pydataslides-190720094244/85/How-to-Validate-you-Client-Churn-Model-24-320.jpg)
![25PyData London 2019
Martingale Residuals
Martingale residuals compare observed to expected at time T
𝒓𝒆𝒔 𝒎𝒂𝒓 = 𝒆𝒗𝒆𝒏𝒕 [𝟏 𝒐𝒓 𝟎]𝒊 − 𝑯𝒊,𝑻
𝒓𝒆𝒔 𝒎𝒂𝒓 in [1,-inf) for uncensored and in [0, -inf) for censored observations.
+ 𝒓𝒆𝒔 𝒎𝒂𝒓 → at T 𝑯𝒊,𝑻 was underestimated
- 𝒓𝒆𝒔 𝒎𝒂𝒓 → at T 𝑯𝒊,𝑻 was overestimated or
censored observation
Scores and
Residuals](https://image.slidesharecdn.com/pydataslides-190720094244/85/How-to-Validate-you-Client-Churn-Model-25-320.jpg)

![27PyData London 2019
Martingale Residuals
Martingale residuals can also be plotted against model covariates to
examine the relationship between model error and covariate values.
To spot non-linearity, add LOWESS lines [8] (scatterplot smoothing lines).
Scores and
Residuals
Sticky score = genre diversity
and monthly stickiness-loyalty](https://image.slidesharecdn.com/pydataslides-190720094244/85/How-to-Validate-you-Client-Churn-Model-27-320.jpg)


![32PyData London 2019
Scores and Residuals
HOW TO FIX IT?
Small concordance scores
introduce new features (are you over or under-estimating the hazards?)
Large martingale residuals with non-random patterns (non-constant lowess lines)
introduce interactive terms or consider squared, cubed, etc. covariates.
Proportionality assumption does not hold
stratify by the covariate that breaks it or move to time-varying model. lifelines library allows to perform non-interactive
stratification, meaning that the baseline hazard function varies by the strata. There is also methods for an interaction-model
stratification where the regression coefficients vary by the strata [6].
Scores and
Residuals](https://image.slidesharecdn.com/pydataslides-190720094244/85/How-to-Validate-you-Client-Churn-Model-32-320.jpg)


![35PyData London 2019
AUC For Survival Analysis
AUC is a measure of model’s sensitivity vs. specificity. Taking a set of covariates as M,
In survival analysis:
𝒔𝒆𝒏𝒔𝒊𝒕𝒊𝒗𝒊𝒕𝒚 = 𝑷(𝑴 > 𝒄|𝑻 ≤ 𝒕)
𝒔𝒑𝒆𝒄𝒊𝒇𝒊𝒄𝒊𝒕𝒚 = 𝑷(𝑴 ≤ 𝒄|𝑻 > 𝒕)
AUC is effectively covariates – to- outcome concordance score, and is calculated for each
tenure.
*scikit-survival implements AUC calculation for survival analysis. But there are many different
definitions in literature (see [3])
AUC
𝑇𝑃
𝑇𝑃 + 𝐹𝑁
𝑇𝑁
𝑇𝑁 + 𝐹𝑃](https://image.slidesharecdn.com/pydataslides-190720094244/85/How-to-Validate-you-Client-Churn-Model-35-320.jpg)


![40PyData London 2019
Scores and AUC Tests
Concordance scores, AUC and Brier Score Loss can be estimated on out-of-sample
as well as out-of-time-sample data [7].
Other Methods
ttest](https://image.slidesharecdn.com/pydataslides-190720094244/85/How-to-Validate-you-Client-Churn-Model-40-320.jpg)

![42PyData London 2019
References
[1] F.Harrell’s Blog on Statistically Efficient Ways to Quantify Added Predictive Value of New Measurements
https://www.fharrell.com/post/addvalue/
[2] H.Uno, et.al. “On the C-Statistics For Evaluating Overall Adequacy of Risk Prediction Procedures With Censored Survival Data.”
Harvard University Biostatistics Working Paper Series (101). 2009.
[3] P.J.Heagerty. Course slides: https://faculty.washington.edu/heagerty/Courses/Montpellier/montpelier-3.pdf
[4] lifelines package (citing): https://zenodo.org/record/3267531
[5] scikit-survival package (citing on bottom of the page): https://github.com/sebp/scikit-survival
[6] M.Abdelaal, S.Zakria. “Modelling Survival Data by Using Cox Regression Model”. American Journal of Theoretical and Applied
Statistics. 2015. 4(6). 504-512.
[7] E.Lima, C.Mues, B.Baesens. “Monitoring and backtesting churn models”, Expert Systems with Applications, 38, 2011 975-982.
[8] F.Harrell, K.Lee, D. Mark. “Multivariable Prognostic Models: Issues in Developing Models, Evaluating Assumptions and Adequacy, and
Measuring and Reducing Errors.” Statistics in Medicine, vol 15, 361-387, 1996.](https://image.slidesharecdn.com/pydataslides-190720094244/85/How-to-Validate-you-Client-Churn-Model-42-320.jpg)


