Designing and Performance Evaluation of 64 QAM OFDM System
SpyropulosPaper
1. Elimination of Ground Stationary Low Elevation Targets in the High
Resolution Automotive Radar Sensor
Charles T. Spyropulos
Integrated Products Business Unit/Automotive Sensors Lowell, Massachusetts
Abstract
Currently M/A-COM’s automotive High Resolution Radar (HRR) sensors do not identify very low non-hazardous
ground-stationary targets. This poses a problem in certain automotive applications since it may result in
unnecessary braking. This paper examines the identification and elimination of very low targets using a
multiple bank correlation algorithm that estimates target height from its multipath return signal. Simulated and
collected data are analyzed and compared and performance is assessed. Finally the ability to eliminate low
height nuisance objects is analyzed and performance metrics are presented.
I. Introduction
The High Resolution Radar (HRR) Automotive Sensor provides both tracked range and bearing information to
external automotive systems. Due to its high sensitivity, the HRR sensor occasionally receives radar returns from
ground stationary low elevation targets (GSLET). These targets may include asphalt cracks, expansion joints, surface
snow cover, ice, and other road surface features. Since several of the automotive applications include crash protection
features, these low targets may cause unnecessary imminent crash alarms or even nuisance braking. Elimination of
these nuisance targets remains an important challenge in the system implementation of the HRR sensors.
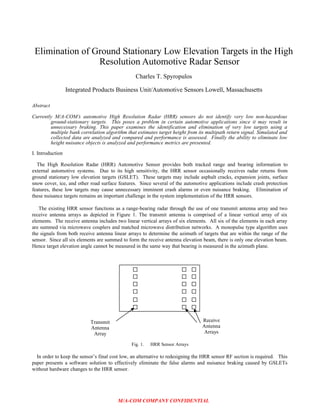
The existing HRR sensor functions as a range-bearing radar through the use of one transmit antenna array and two
receive antenna arrays as depicted in Figure 1. The transmit antenna is comprised of a linear vertical array of six
elements. The receive antenna includes two linear vertical arrays of six elements. All six of the elements in each array
are summed via microwave couplers and matched microwave distribution networks. A monopulse type algorithm uses
the signals from both receive antenna linear arrays to determine the azimuth of targets that are within the range of the
sensor. Since all six elements are summed to form the receive antenna elevation beam, there is only one elevation beam.
Hence target elevation angle cannot be measured in the same way that bearing is measured in the azimuth plane.
Fig. 1. HRR Sensor Arrays
In order to keep the sensor’s final cost low, an alternative to redesigning the HRR sensor RF section is required. This
paper presents a software solution to effectively eliminate the false alarms and nuisance braking caused by GSLETs
without hardware changes to the HRR sensor.
M/A-COM COMPANY CONFIDENTIAL
Transmit
Antenna
Array
Receive
Antenna
Arrays
2. II. LOW ELEVATION OBJECT ELIMINATION ALGORITHM - THEORETICAL BASIS
A. Algorithm Formulation
Since multipath occurs naturally for all targets and changes characteristics with target height, it provides a way to
discriminate GSLETs from other targets. Figure 2 illustrates the spatial relationship between an HRR sensor and an
ideal point target, both at arbitrary height from the ground. In particular, the figure shows that the transmitted signal
reaches the target and then reflects off of it via two primary paths: the direct path and the indirect path (this assumes a
simplistic ray optics geometric multipath model). The direct path’s angle of reflection off of the target, θ, is equal to the
transmitted signal path’s angle of incidence, θ. The indirect path’s angle of reflection off of the target, -θ, is equal to
the transmitted signal path’s angle of incidence, θ, but opposite in polarity and includes a reflection off of the ground.
The direct and the indirect path signals both propagate back to the sensor’s receive antenna and add constructively or
destructively as the range to the target changes. Figure 3 shows a plot of simulated noiseless, normalized target
amplitude for several target heights as a function of target range. The combined received signal amplitude as a function
of target range consists of peaks and nulls that shift in range for different target heights. Low targets have amplitude
patterns with few peaks and nulls that are relatively far apart. Higher targets have amplitude patterns with more peaks
and nulls that get closer together with increasing height.
Fig. 2. Transmitted and Reflected Radar Signal Paths
M/A-COM COMPANY CONFIDENTIAL
Sensor
Target
θ
θ
Transmitted Signal
Reflected signal
(Direct)
Reflected Signal
(Indirect)
h sensor
htarget
3. Fig. 3. Simulated Normalized Received Signal Amplitude for Several Point Target Heights
In order to use the received signal’s multipath characteristics to discern the target’s height, the received signal’s
characteristics must be predicted for each possible target height. Once this is accomplished, a means to match the actual
received signal to the correct signal replica is required. Also, a detection algorithm is required that includes the detection
process, detection thresholds, and detection criteria. The three basic components that comprise the GSLET elimination
algorithm are listed below:
a. Predict the target’s amplitude response as a function of range for all possible target heights.
b. Match the received target signal to one of the signal replicas associated with the correct target height.
c. Apply detection criteria and thresholds to determine if the target is a candidate for elimination.
The first component is implemented by an existing mathematical multipath prediction model. The signal matching
component is implemented by a multiple bank correlator whose banks contain normalized versions, or replicas, of each
possible received target signal for target heights from 0 to 50 cm in 1 cm increments. The last component uses adaptive
thresholding techniques and detection criteria derived from both simulated target amplitude data and live target
amplitude data collected using an actual HRR sensor system on three customer host vehicles. The three components of
the GSLET elimination algorithm listed above are discussed in greater detail in the three sections below.
B. Multipath Prediction Model [1]
An existing multipath prediction model developed at M/A-COM was implemented in MATLAB to generate the
expected signal replicas used in the multiple bank correlator. The model was also used to generate simulated radar
received signals by selecting a signal replica at a specific height and adding noise for a given SNR at the maximum
range of interest. In general, the model uses a geometric ray-optics technique to determine the relative amplitudes of the
return radar signal as a function of target range, target height, target radar cross-section, sensor height, sensor beam-
width, sensor gain, complex ground reflection coefficient, and signal polarization (horizontal). Since the absolute return
signal amplitude does not affect the correlation of the return signal with the replica signals, the transmitted signal power
was normalized to unity. The return signal amplitude is predicted for each candidate height from 0 to 50 cm in 1 cm
increments and for each range of interest. More details regarding the multipath prediction model can be found in the
cited reference.
M/A-COM COMPANY CONFIDENTIAL
5 10 15 20 25 30
0
0.5
1
1.5
2
2.5
3
3.5
4
4.5
x 10
-4
Range (meters)
NormalizedReceivedSignalAmplitude 1 cm
25 cm
45 cm
4. C. Multiple Bank Correlator[2]
As discussed previously, the range dependent radar return signal amplitude response from an ideal point target at a
specific height has a characteristic shape. This suggests that a means to extract information from these signals regarding
target height is possible. There are M possible received radar signals, each corresponding to a specific target height.
These signals can be represented as :
Sm(t) = Re[um(t)ej2πf
c
t], m = 1,2……M (1)
The um(t) are the equivalent non-orthogonal, low pass signals; c is the speed of light and f is the carrier frequency of
the radar signal (24 GHz). The transmission channel adds attenuation α, and a phase shift φ. The received radar signal
model now becomes:
r(t) = αe -jφ
mum(t) + z(t) (2)
The signal, z(t), is additive white Gaussian noise (AWGN). Although φ can be resolved precisely via carrier phase
measurement, it is ambiguous due to the sensor’s limited range accuracy of 4 cm (1σ). A target movement in range
equal to one-half of the wavelength of the transmitted radar signal, 0.625 cm, results in 1.25 cm of round-trip path-length
change. This forces a non-coherent detection scheme that is independent of signal phase measurement and that relies
only on the received signal’s amplitude.
A cross-correlation scheme was employed to compare the received radar amplitude signal r(t), with the predicted
signals um(t). Assuming that all the possible signals are equally likely with equal energy, the following decision
variables are computed:
Um = |ΣΤ
r(t) um
*(t)∆t| (3)
Figure 4 shows a basic multiple bank correlator. The correlator was constructed in MATLAB and consists of a
multiplier, followed by an integrator, and an envelope detector. The outputs of the correlators are fed into a detector that
compares the values of all the decision variables and selects the most likely signal. Each decision variable represents the
correlation of the received signal with the predicted signal for each possible target height. A conventional cross-
correlator delays the input signal, multiplies it with the complex conjugate of the replica signal and integrates the product
of the signals. For this application the received radar amplitude signals are indexed by range and there is no need to
delay one signal with respect to the other before the multiply. Instead, the amplitudes for each signal, that correspond to
each specific range are multiplied and integrated only once without an applied delay.
When the detector chooses a decision variable, the target height associated with that particular decision variable is
declared the target height. According to classical detection theory, the optimum demodulator for signals with random
phase in AWGN is a correlator or matched filter followed by a detector that selects the decision variable with the largest
value. This works well if the predicted signals form an orthogonal or highly uncorrelated signal set. Since this is not the
case here, an alternative detector was employed and is discussed in the next section.
Note that for this particular application the correlation values were normalized [3]. Normalizing and substituting the
discrete variable “n” for “t” and “N” for “T” yields:
Rj = 1/N[ΣΝ
ri(n) uji(n) - 1/N{ΣΝ
r(n)ΣΤ
uji
*(n)}]/σrσu (4)
M/A-COM COMPANY CONFIDENTIAL
5. Set Initial Correlation
Threshold
Find Correlation
Peaks that Exceed
Threshold
Declare Target Height
Reduce Correlation
Threshold
Select the Peak that
Occurs at the Largest
Height
Fig. 4. Multiple Bank Correlator
D. Detector
The first implementation of the detector selected the um(t) with the highest correlation and declared the associated
height as the most likely target height. This detection scheme worked well with simulated received target signals but
did not work well against live target data. Therefore the detection algorithm was modified and was implemented as
shown in Figure 5.
Fig. 5. Detection Algorithm
M/A-COM COMPANY CONFIDENTIAL
| ( ) |
| ( ) |
u1*(t)
uM*(t)
u2*(t)
ΣT ( ) ∆t
ΣT ( ) ∆t
ΣT ( ) ∆t
r(t)
| ( ) |
Detector
Decision
Integrator Envelope detector
| ( ) |
| ( ) |
u1*(t)
uM*(t)
u2*(t)
ΣT ( ) ∆t
ΣT ( ) ∆t
ΣT ( ) ∆t
r(t)
| ( ) |
Detector
Decision
Integrator Envelope detector
6. As shown in Figure 5, an initial correlation threshold is set. The threshold’s value was chosen based on simulation
results and correlation results of several live targets. The decision variables consist of the cross-correlations of the
received signal with the predicted signal replicas for each possible target height. The detector searches the decision
variables for correlation peaks above the threshold until the peak at the highest height is identified. The correlation peak
occurring at the largest height is selected and the target’s height is declared. If all of the decision variables are searched
and there are no correlation peaks above the threshold, then the threshold is decreased and the search is repeated. This is
done iteratively until at least one correlation peak is found above the threshold.
III. simulation
A. Ideal Point Target Height Estimation
A simulation was implemented in MATLAB to assess the performance of the GSLET elimination algorithm in a
controlled manner. The simulation includes implementations of the multipath prediction model, the multiple bank
correlator, and the detector discussed above. The important simulation input parameters and settings are listed in Table
1. The multipath prediction model was used to generate predicted received signals for each possible target height from 0
to 45 cm (nominal sensor height), in 1 cm increments. Once the replicas were generated, one of them was chosen as the
true target signal based on the desired target height. The true target height was varied from 5 to 45 cm in increments of 5
cm. Noise was added to the simulated true received signal based on the SNR of the received signal at maximum range.
For this simulation the SNR at the maximum range of 30 meters was set to 15 dB, the typical SNR of received HRR
signals at the maximum range. The radar cross section of the target was normalized to 0 dBm2.
Table 1. Simulation Input Parameters and Settings
Parameter Value Units
Carrier Frequency 24.125 GHz
Sensor Azimuth Beam width 80 degrees
Sensor Elevation Beam width 18.4 degrees
Sensor Height 45 cm
Sensor Tilt 0 degrees
Target Height 0 to 45 cm
Target RCS 0 dBm2
Max Range 30 m
Min Range 5 m
SNR @ Max Range 15 dB
Host Vehicle Velocity 5 to 20 mph
Number of Simulation Runs 1000 -
Sensor Cycle Time 40 msec
The simulation was run 1000 times for each target height and histograms of the estimated target height were compiled.
Figures 6 through 17 show the results for target heights of 1 cm, 25 cm, and 45 cm. The first and second figures for
each target height show the amplitude response and the correlation results, respectively, for the last run in the simulation.
The third and fourth figures for each target height show the estimated height histogram, or height probability density
function (PDF) and the height cumulative probability distribution function (CDF). The amplitude and correlation plots
show that there are excellent discrimination properties between targets of different heights. The CDF and PDF plots
show 100% height estimation accuracy for simulated ideal point targets at the three heights for a 15 dB SNR received
signal level at maximum range. Similar data for the complete target height range yields the same results.
M/A-COM COMPANY CONFIDENTIAL
7. 5 10 15 20 25 30
-1
-0.5
0
0.5
1
1.5
2
2.5
3
3.5
x 10
-4
Simulated Target Amplitude
N =1000,SNR =15 dB,Simulated Target height =5 cm
Range (m)
Amplitude(V)
Fig. 6. Received Signal Amplitude Response for 5 cm Target Height, Simulated
Fig. 7. Correlation for 5 cm Target Height, Simulated
M/A-COM COMPANY CONFIDENTIAL
0 5 10 15 20 25 30 35 40 45 50
0
10
20
30
40
50
60
70
80
90
100
Per-Cent Correlation
N =1000,SNR =15 dB,Simulated Target height =5 cm
Height (cm)
Correlation(%)
8. Fig. 8. PDF for 5 cm Target Height, Simulated
Fig. 9. CDF for 5 cm Target Height, Simulated
M/A-COM COMPANY CONFIDENTIAL
0 10 20 30 40 50 60 70 80 90 100
0
100
200
300
400
500
600
700
800
900
1000
Estimated Height Probability Density Function
N =1000,SNR =15 dB,Simulated Target height =5 cm
Height (cm)
ProbabilityofTargetHeight=X
0 5 10 15 20 25 30 35 40 45 50
0
0.1
0.2
0.3
0.4
0.5
0.6
0.7
0.8
0.9
1
Estimated Height Cumulative Probability Distribution Function
N =1000,SNR =15 dB,Simulated Target height =5 cm
Height (cm)
ProbabilityofTargetHeight<X
9. Fig. 10. Received Signal Amplitude Response for 25 cm Target Height, Simulated
Fig. 11. Correlation for 25 cm Target Height, Simulated
M/A-COM COMPANY CONFIDENTIAL
5 10 15 20 25 30
-4
-2
0
2
4
6
8
x 10
-4
Simulated Target Amplitude
N =1000,SNR =15 dB,Simulated Target height =25 cm
Range (m)
Amplitude(V)
0 5 10 15 20 25 30 35 40 45 50
0
10
20
30
40
50
60
70
80
90
100
Per-Cent Correlation
N =1000,SNR =15 dB,Simulated Target height =25 cm
Height (cm)
Correlation(%)
10. Fig. 12. PDF for 25 cm Target Height, Simulated
Fig. 13. CDF for 25 cm Target Height, Simulated
M/A-COM COMPANY CONFIDENTIAL
0 10 20 30 40 50 60 70 80 90 100
0
100
200
300
400
500
600
700
800
900
1000
Estimated Height Probability Density Function
N =1000,SNR =15 dB,Simulated Target height =25 cm
Height (cm)
ProbabilityofTargetHeight=X
0 5 10 15 20 25 30 35 40 45 50
0
0.1
0.2
0.3
0.4
0.5
0.6
0.7
0.8
0.9
1
Estimated Height Cumulative Probability Distribution Function
N =1000,SNR =15 dB,Simulated Target height =25 cm
Height (cm)
ProbabilityofTargetHeight<X
11. Fig. 14. Received Signal Amplitude Response for 45 cm Target Height, Simulated
Fig. 15. Correlation for 45 cm Target Height, Simulated
M/A-COM COMPANY CONFIDENTIAL
5 10 15 20 25 30
-2
-1
0
1
2
3
4
5
6
x 10
-4
Simulated Target Amplitude
N =1000,SNR =15 dB,Simulated Target height =45 cm
Range (m)
Amplitude(V)
0 5 10 15 20 25 30 35 40 45 50
0
10
20
30
40
50
60
70
80
90
100
Per-Cent Correlation
N =1000,SNR =15 dB,Simulated Target height =45 cm
Height (cm)
Correlation(%)
12. Fig. 16. PDF for 45 cm Target Height, Simulated
Fig. 17. CDF for 45 cm Target Height, Simulated
M/A-COM COMPANY CONFIDENTIAL
0 10 20 30 40 50 60 70 80 90 100
0
100
200
300
400
500
600
700
800
900
1000
Estimated Height Probability Density Function
N =1000,SNR =15 dB,Simulated Target height =45 cm
Height (cm)
ProbabilityofTargetHeight=X
0 5 10 15 20 25 30 35 40 45 50
0
0.1
0.2
0.3
0.4
0.5
0.6
0.7
0.8
0.9
1
Estimated Height Cumulative Probability Distribution Function
N =1000,SNR =15 dB,Simulated Target height =45 cm
Height (cm)
ProbabilityofTargetHeight<X
13. A. Simulation Validation
In order to validate the simulation results, data for a live target was collected with an HRR sensor installed on the front
bumper of a customer supplied host vehicle on an outdoor M/A-COM test range. A 10 dBm2 corner reflector was placed
at the maximum range of 30 meters and the host vehicle was driven in a straight line to the target and the amplitude data
was collected [4], parsed [5], and processed through the MATLAB correlator and detector. The reflector was placed at
various heights from 0 cm to 45 cm. The height of the sensor was measured to be 45 cm. The host vehicle speed was
varied from 5 to 15 mph.
In addition to the multipath prediction model, correlator, and detector, two modules were added to the MATLAB
program. In order to collect the accurate amplitude data (not the normal mode of sensor operation), the sensor had to be
put into non-tracking mode. In this non-operational mode, accurate amplitude data could be collected along with the
associated untracked range data. An existing MA-COM offline sensor range tracker [6] was run on the range data to
select the appropriate ranges from the noisy raw ranges in each sensor cycle. A track association module was added to
associate the correct accurate amplitudes in each 40 ms sensor cycle to the appropriate tracked ranges. The initial
correlation detection threshold was set at a correlation value of 0.61 and did not change throughout the data processing.
Table 2 summarizes the results for the corner reflector data and shows that only one out of the eighteen trials (reflector
height = 15 cm, host vehicle velocity = 15 mph) has a large estimated height error of 29 cm. The rest of the height
estimations are within 7 cm of the true target height. Figures 18 through 23 include plots of the received amplitude
response and correlator output data respectively for target heights of 5, 25, and 45 cm. The correlator output plots
compare favorably to the simulated plots and show peaks close to the true target height.
Table 2. Height Estimation Results for a 10 dBm2 Corner Reflector
M/A-COM COMPANY CONFIDENTIAL
Target
Height
(cm)
Host
Velocity
(mph)
Estimated
Target
Height
(cm)
Height
Error
(cm)
Correlation
Threshold
(%)
Number
of Points
(N)
5 5 6 1 0.61 258
5 10 6 1 0.61 110
5 15 6 1 0.61 82
10 5 3 -7 0.61 291
10 10 3 -7 0.61 143
10 15 14 4 0.61 89
15 5 16 1 0.61 256
15 10 16 1 0.61 160
15 15 44 29 0.61 88
20 5 22 2 0.61 232
20 10 22 2 0.61 110
20 15 18 -2 0.61 75
25 5 25 0 0.61 172
30 5 29 -1 0.61 157
35 5 33 -2 0.61 197
40 5 43 3 0.61 262
45 5 45 0 0.61 240
50 5 44 -6 0.61 201
14. Fig. 18. Received Signal Amplitude Response for 5 cm Target Height, +10dB2 Corner Reflector
0 5 10 15 20 25 30 35 40 45 50
0
10
20
30
40
50
60
70
80
90
100
Height (cm)
Correlation(%)
Per-Cent Correlation (True height =5 cm, Est. height =6 cm)
L h 05cm v 5mph.svw
Fig. 19. Correlation for 5 cm Target Height, +10dB2 Corner Reflector
M/A-COM COMPANY CONFIDENTIAL
5 10 15 20 25 30
0
500
1000
1500
2000
2500
3000
3500
Range (m)
Amplitude
Target Amplitude (True height =5 cm, Est. height =6 cm)
L h 05cm v 5mph.svw
15. 5 10 15 20 25 30
0
500
1000
1500
2000
2500
3000
3500
Range (m)
Amplitude
Target Amplitude (True height =25 cm, Est. height =25 cm)
H h 25cm v 5mph.svw
Fig. 20. Received Signal Amplitude Response for 25 cm Target Height, +10dB2 Corner Reflector
0 5 10 15 20 25 30 35 40 45 50
0
10
20
30
40
50
60
70
80
90
100
Height (cm)
Correlation(%)
Per-Cent Correlation (True height =25 cm, Est. height =25 cm)
H h 25cm v 5mph.svw
Fig. 21. Correlation for 25 cm Target Height, +10dB2 Corner Reflector
M/A-COM COMPANY CONFIDENTIAL
16. 5 10 15 20 25 30
0
500
1000
1500
2000
2500
3000
Range (m)
Amplitude
Target Amplitude (True height =45 cm, Est. height =45 cm)
H h 45cm v 5mph.svw
Fig. 22. Received Signal Amplitude Response for 45 cm Target Height, +10dB2 Corner Reflector
0 5 10 15 20 25 30 35 40 45 50
0
10
20
30
40
50
60
70
80
90
100
Height (cm)
Correlation(%)
Per-Cent Correlation (True height =45 cm, Est. height =45 cm)
H h 45cm v 5mph.svw
Fig. 23. Correlation for 45 cm Target Height, +10dB2 Corner Reflector
M/A-COM COMPANY CONFIDENTIAL
17. IV. Low Target elimination performance
A. Target Classification
To form a basis for target elimination in an automotive crash avoidance or imminent crash alert system, candidate
targets must be classified as either targets to avoid or as non-hazardous targets that can be driven over without serious
damage to the vehicle. This implies that a target height threshold is required that will define two decision regions: Low
Targets and High Targets. If a target’s estimated height is equal to or greater than the target height threshold, then it is
declared a High Target. If its height is below the target height threshold, then it is declared a Low Target. The threshold
must be selected to maximize the probability of detection of Low Targets, since elimination of these targets is critical to
avoid nuisance braking and/or false imminent crash alerts. On the other hand, braking and/or imminent crash alerts for
High Targets should be minimally affected.
Since the system applications under consideration do not take control completely out of the hands of the driver, and
since the maximum operational host velocity is rather low (20 mph), the target height threshold was selected to
maximize Low Target elimination performance. To avoid contact between the host vehicle’s bumper and targets directly
in the line of travel, the bumper height could be used as the target height threshold. The bumper height on three different
vehicles was measured and found to be between 45 and 57 cm. These vehicles (Mercedes E500, Cadillac CTS, Cadillac
Escalade), equipped with an HRR sensor system, were used to collect data on several targets listed below in Table 3.
Table 3. Height Estimation Results for a 10 dBm2 Corner Reflector
Host Platform Target Description
True
Target
Height
(cm)
Est.
Target
Height
(cm)
Height
Error
(cm)
True
H/L
Est.
H/L
Final
Correlation
Threshold
(%)
Number
of Points
E500 Snow covered curb 15 4 -11 L L 61 85
(hsensor = 45 cm) Snow pile 30 36 +6 H H 26 11
John Deer tractor bucket 45 41 -4 H H 61 341
Subaru Forester, rear 45 45 0 H H 61 322
Lexus ES300, side 45 45 0 H H 61 238
Snow and sand patch 5 7 +2 L L 45 454
Snow patch 5 12 -7 L L 58 155
Curb, square face 15 12 -3 L L 14 250
Curb, slanted face 15 7 -8 L L 14 538
Escalade PVC pipe, across lane 8 4 -4 L L 61 131
(hsensor = 57 cm) PVC pipe, across lane 8 7 -1 L L 61 108
Waste basket 40 56 -16 H H 61 184
Waste basket 40 54 -14 H H 61 165
Construction barrel 57 28 -29 H H 61 351
Construction barrel 57 17 -33 H H 61 316
Car, rear 57 56 -1 H H 61 250
Car, rear 57 55 -2 H H 61 249
Car, side 57 20 -35 H H 61 313
Car, side 57 54 -3 H H 61 272
CTS +10dB2 corner reflector 5 7 2 L L 61 102
(hsensor = 47 cm) +10dB2 corner reflector 25 23 -2 H H 61 67
+10dB2 corner reflector 47 43 -4 H H 61 108
Based on the bumper heights and the collected data, the target height threshold was selected to avoid damage to all
three vehicles, to maximize performance of the low target elimination algorithm, and to provide a considerable safety
margin. The target height threshold was set to 17 cm, well below all of the bumper heights for the vehicles under test.
The true target heights were measured unless the target height exceeded the height of the sensor, in which case the target
M/A-COM COMPANY CONFIDENTIAL
18. height was set to the height of the sensor. The known target classification (H/L) is listed in column 6 of Table 3, along
with the estimated target classification in column 7.
The results summarized in Table 3 reveal that, although some of the height estimate errors are high, the object
classification performance is 100% effective. The large height errors are due, in part, to the fact that the height
estimation algorithm picks the highest height whose associated correlation peak is above the specified correlation
threshold. High errors also occur for targets with a very low number of collected data points and/or for targets with
heights close to or
above the sensor’s height. The first two causes for large height estimation errors are self explanatory. The last one can
be explained by Figure 24 that depicts the simulated correlator signal replicas correlated with one another. The figure
assumes 50 signal replicas that represent the expected normalized, noiseless target return signals for ideal point targets
Fig. 24. Correlation Coefficient for Idealized Noiseless Signal Replicas
ranging from 1 cm to 50 cm in height, each of which is defined for a target range of 30 meters to 5 meters. The upper
right corner of Figure 24 shows that high correlation occurs between targets at 50 cm and targets as low as 20 cm. This
suggests that the target height threshold should be selected below 20 cm and provides some rationale for choosing 17 cm
as the height threshold for low and high target classification. Figure 24 also yields an unexpected result; some low
targets (particularly those with heights equal to 1, 3, 4, and 7 cm) correlate well with high targets. This may suggest the
future elimination of these low target signal replicas from those used in the correlator.
B. Overall Performance Summary and Conclusions
The corner reflector data presented yields 95% correct low target identification. The data for miscellaneous targets of
opportunity yields 100% correct low target identification. Performance degrades with increasing vehicle speed or a very
low number of data points. Not only will the total number of data points decrease with increasing speed, but it will also
M/A-COM COMPANY CONFIDENTIAL
Signal Replica Number
SignalReplicaNumber
5 10 15 20 25 30 35 40 45 50
5
10
15
20
25
30
35
40
45
50
0.4
0.5
0.6
0.7
0.8
0.9
1
19. decrease with decreased SNR, received signal drop-outs and decreased target RCS. Performance also decreases as the
target height approaches or exceeds the height of the sensor.
Some of the large height estimation errors could possibly be reduced by eliminating signal replicas in the multiple
bank correlator that cross-correlate highly to replicas in the opposite decision region. For example, all replicas that
represent an estimated target height of 10 cm and below could be eliminated to avoid the high correlations that occur
between low targets with heights equal to 1, 3, 4, and 7 and high targets.
Performance may also be improved via a more robust detection algorithm and fine tuning of the target height and
correlation thresholds. For example, instead of using the greatest target height that yields a correlation value over the
correlation threshold to estimate height, all of the points that exceed the correlation threshold could be used to make a
target height estimate or a target classification decision. Further, instead of using only one correlation value for each
peak that exceeds the correlation threshold, three or more points could be used to give some idea of the relative height or
width of each correlation peak. The average value of the correlation function over all possible target heights, when
compared with the correlation peak values, could yield additional information on the correlation peak widths and relative
heights that could further reduce height estimation errors.
Another area for improvement is the range association algorithm that matches the untracked raw ranges and associated
accurate amplitude data to the tracked range data. Although not discussed in detail here, improvements in the range
association algorithm would definitely improve the height estimation algorithm’s performance. The greatest
improvement will be realized in crowded multi-target environments with received signal dropouts occurring for each
target. Then, the range fragments for each target would need to be “stitched” together to maximize the number of range-
amplitude pairs available to the height estimation algorithm.
Acknowledgement
The author wishes to acknowledge the assistance of Clyde M. Callewaert, Allan Douglas, Brad Kruse, Bruce Labitt,
and Michael J. Paradie.
References
[1] Clyde M. Callewaert, "A Geometric Optics Multipath Propagation Model for RADAR Applications”, M/A-COM Engineering
Conference, 2006.
[2] John G. Proakis, Digital Communications, McGraw-Hill College, Chapter 4, August 2000.
[3] Athanasios Papoulis, Probability Random Variables, and Stochastic Processes, McGraw-Hill College, 1991.
[4] Daniel Havlik, DanView Data Collection Tool for the HRR Sensor, M/A-COM, 2005.
[5] Allan Douglas, Data Parsing Perl Script Tool for the HRR Sensor, M/A-COM, 2005.
[6] Dirk Klotzbuecher, MATLAB HRR Sensor Range Tracker, M/A-COM, 2005.
M/A-COM COMPANY CONFIDENTIAL
Select the Peak that
Occurs at the Largest
Height