
Recommended
Recommended
More Related Content
Similar to Chapter 8 Healthcare Financing Introduction .docx
Similar to Chapter 8 Healthcare Financing Introduction .docx (20)
More from christinemaritza
More from christinemaritza (20)
Recently uploaded
Recently uploaded (20)
Chapter 8 Healthcare Financing Introduction .docx
- 1. Chapter 8 Healthcare Financing Introduction Unlike countries that have universal healthcare systems, payment of healthcare services in the US is derived from out-of-pocket payments from patients who pay entirely or partially for services rendered; health insurance plans, such as indemnity plans or managed care organizations; public/ government funding such as Medicare, Medicaid, and other government programs; and health savings accounts © 2010 Jones and Bartlett Publishers, LLC Did you know that? Nearly 60% of Medicare enrollees are female which corresponds to the longer life expectancy of a U.S. female. Medicare and Medicaid are the two largest government sponsored health insurance programs in the U.S. Approximately 84% of the U.S. population is covered by some form of health insurance.
- 2. © 2010 Jones and Bartlett Publishers, LLC Introduction The Center for Medicare and Medicaid Services projects that health services will consume nearly 20% of the GDP by 2016. According to CMS 2007 statistics, U.S. health care expenditures increased 6.1 percent compared to 6.7 percent in 2006. Total health expenditures reached $2.2 trillion which translates to 16.2% of the gross domestic product. Since 1970, health care spending has grown 2.5% faster than the rest of the U.S. economy. © 2010 Jones and Bartlett Publishers, LLC Average Annual Growth Rates for Nominal NHE and GDP for Selected Time Periods Source: Centers for Medicare and Medicaid Services, Office of the Actuary, National Health Statistics Group, at http://www.cms.hhs.gov/NationalHealthExpendData/ (see Historical; NHE summary including share of GDP, CY 1960- 2008; file nhegdp08.zip). © 2010 Jones and Bartlett Publishers, LLC National Health Expenditures per Capita and Their Share of Gross Domestic Product, 1960-2008 Source: Centers for Medicare and Medicaid Services, Office of the Actuary, National Health Statistics Group, at http://www.cms.hhs.gov/NationalHealthExpendData/ (see Historical; NHE summary including share of GDP, CY 1960-
- 3. 2008; file nhegdp08.zip). 5.2% 7.2% 9.1% 12.3% 13.5% 13.5% 13.6% 14.3% 15.1% 15.6% 15.6% 15.7% 15.8% 15.9% 16.2% © 2010 Jones and Bartlett Publishers, LLC Causes of rising costs The increase in health care spending can be attributed to three causes: 1) When prices increase in an economy overall, the cost of medical care will increase and even when prices are adjusted for inflation, medical prices have increased; 2) as life expectancy increases in the U.S., more individuals will require more medical care which means there will be more health care expenses; and 3) as health care technology and research provides for more sophisticated and more expensive procedures, there will be an increase in health care expenses. © 2010 Jones and Bartlett Publishers, LLC Who pays? Payment of health care services is derived from 1) out of pocket payments from patients who pay entirely or partially for services rendered, 2) health insurance such as indemnity plans or managed care organizations, 3) public/government funding such as Medicare, Medicaid and other government programs and 4) health spending accounts (HSAs).
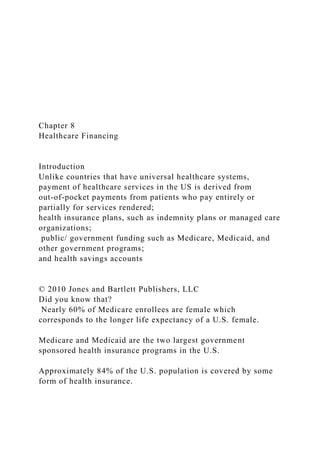
- 4. © 2010 Jones and Bartlett Publishers, LLC Health Insurance Much of the burden of health care expenditures has been borne by private sources—employers and their health insurance programs have borne much of the cost. In 2007, approximately 60% of Americans (180 million) has private health insurance coverage. © 2010 Jones and Bartlett Publishers, LLC Not just you and your doctor There are three parties involved in providing health care: the provider, the patient and the fiscal intermediary such as a health insurance company or the government. © 2010 Jones and Bartlett Publishers, LLC HEALTH CARE SPENDING BY SERVICE TYPE In 2007, hospital spending was nearly $700 billion, physician and clinical services was $480 billion and other professional services such as chiropractors, optometrists and podiatrists was $62 billion. Dental services were $95 billion and community center and school spending was $66 billion. Home health care services were $59 billion which was an increase of 11% from 2006. Nursing home spending was $131 billion, prescriptions drugs was $227 billion and medical equipment w as $61 billion. Hospital spending accounted for the largest percentage of national health care expenditures with physician and other
- 5. services, prescription drugs and nursing and home health the next three largest. © 2010 Jones and Bartlett Publishers, LLC COSTS: Distribution of National Health Expenditures, by Type of Service, 2008 Note: Other Personal Health Care includes, for example, dental and other professional health services, durable medical equipment, etc. Other Health Spending includes, for example, administration and net cost of private health insurance, public health activity, research, and structures and equipment, etc. Source: Kaiser Family Foundation calculations using NHE data from Centers for Medicare and Medicaid Services, Office of the Actuary, National Health Statistics Group, at http://www.cms.hhs.gov/NationalHealthExpendData/ (see Historical; National Health Expenditures by type of service and source of funds, CY 1960-2008; file nhe2008.zip). © 2010 Jones and Bartlett Publishers, LLC HEALTH CARE SPENDING BY MAJOR SOURCES OF FUNDS In 2007, Medicare spending was $431 billion which is an increase of 7.2% from 2006. Medicaid spending was $329 billion which was a slight decrease from 2006. Private health insurance premiums grew 6% while benefit payments decreased because of a decline in spending on prescription drugs. Out of pocket payments grew 5% in 2007 which was a result of prescription drugs costs, nursing home services and medical
- 6. equipment. Out of pocket spending accounted for 12% of national health spending in 2007 which has declined over the past 10 years © 2010 Jones and Bartlett Publishers, LLC HEALTH CARE SPENDING BY AGE AND GENDER These numbers correlate with the fact that the longer we age, the more chronic conditions occur which result in higher spending and that female life expectancy is higher than male life expectancy, © 2010 Jones and Bartlett Publishers, LLC Distribution of Average Spending Per Person by Age, 2006Average Spending Per PersonAge (in years)<5$1,5085-171,26718-241,44125-442,30545- 644,863>648,776SexMale$3,002Female3,886 Notes: Includes individuals without any spending in 2006. Source: Kaiser Family Foundation calculations using data from U.S. Department of Health and Human Services, Agency for Healthcare Research and Quality, Medical Expenditure Panel Survey (MEPS), 2006. Characteristics of the Uninsured, 2008 Family Income Family Work Status Total = 45.7 million uninsured
- 7. 1 or More Full-Time Workers 66% No Workers 19% Part-Time Workers 14% Age 55-64 9% 30-54 43% 19-29 30% 0-18 18% The federal poverty level was $22,025 for a family of four in 2008. Data may not total 100% due to rounding. SOURCE: KCMU/Urban Institute analysis of 2009 ASEC Supplement to the CPS. Nonelderly’s Health Insurance Coverage by Family Poverty Level, 2008 50.2 M 46.0 M 41.5 M
- 8. 125.1 M Number Under 100% 100% - 199% 200% - 299% 300% + NOTES: Data may not total 100% due to rounding. The Federal Poverty Level for a family of four in 2008 was $22,025 (according to the U.S. Census Bureau’s poverty threshold). Family size and total family income are grouped by insurance eligibility. SOURCE: Kaiser Commission on Medicaid and the Uninsured/Urban Institute analysis of 2009 ASEC Supplement to the CPS. 2015 Federal Poverty Guidelines Uninsured Nonelderly vs. All Nonelderly, by Family Work Status, 2008 Two full-time workers One full-time worker Only part time No workers 45.7 Million 262.8 Million NOTES: Data may not total 100% due to rounding. SOURCE: Kaiser Commission on Medicaid and the Uninsured/Urban Institute analysis of 2009 ASEC Supplement to the CPS.
- 9. Average Annual Health Insurance Premiums and Worker Contributions for Family Coverage, 2005-2010 Note: The average worker contribution and the average employer contribution may not add to the average total premium due to rounding. Source: Kaiser/HRET Survey of Employer-Sponsored Health Benefits, 2005-2010. $10,880 $13,770 $1,284 Worker Contribution Increase 47% 20% 27% Average Health Insurance Premiums and Worker Contributions for Family Coverage, 1999-2009 Note: The average worker contribution and the average employer contribution may not add to the average total premium due to rounding. Source: Kaiser/HRET Survey of Employer-Sponsored Health
- 10. Benefits, 1999-2009. $5,791 128% Worker Contribution Increase 131% Premium Increase $13,375 Average Monthly Worker Premium Contributions Paid by Covered Workers for Single and Family Coverage, 1999-2010 *Estimate is statistically different from estimate for the previous year shown (p<.05). Source: Kaiser/HRET Survey of Employer-Sponsored Health Benefits, 1999-2010. Average Annual Worker and Employer Contributions to Premiums and Total Premiums for Family Coverage, 1999-2010 * Estimate is statistically different from estimate for the previous year shown (p<.05). Source: Kaiser/HRET Survey of Employer-Sponsored Health Benefits, 1999-2010. $5,791 $6,438* $7,061* $8,003* $9,068* $9,950* $10,880*
- 11. $11,480* $12,106* $12,680* $13,375* $13,770* © 2010 Jones and Bartlett Publishers, LLC HEALTH INSURANCE AS A PAYER FOR HEALTH CARE SERVICES Like life insurance or homeowner’s insurance, health insurance was developed to provide protection should a covered individual experience an event that required health care. © 2010 Jones and Bartlett Publishers, LLC Health Insurance as a Payer In the 1960s, President Johnson signed Medicare and Medicaid into law which protects the elderly, disabled and indigent. President Nixon signed into law the Health Maintenance Act of 1973 which focused on effective cost measures for health delivery which was the basis for the current Health Maintenance Organizations (HMOs). Also, in the 1980s, diagnostic related groups or (DRGs) and prospective payment guidelines were established to provide guidelines for treatment. © 2010 Jones and Bartlett Publishers, LLC Health Insurance as a Payer
- 12. health coverage program was proposed during Clinton’s administration in the 1990s, it was never passed. In 2005, Massachusetts proposed mandatory health coverage for all citizens so it may be that universal health coverage may begin at the state level. © 2010 Jones and Bartlett Publishers, LLC Health Insurance as a Payer The Consolidated Omnibus Budget Reconciliation Act (COBRA) was passed to provide health insurance protection if an individual changes jobs. In 1993, the Family Medical Leave Act (FMLA) was passed to protect an employee if there is a family illness. They can receive up to 12 weeks of unpaid leave and their health insurance during this period. Also, in 1996, the Health Insurance Portability and Accountability Act (HIPAA) were passed that provided stricter confidentiality regarding the health information of individuals. © 2010 Jones and Bartlett Publishers, LLC Types of Health Insurance Health insurance, particularly employer provided health insurance, is the primary source for payment of health care services in the U.S. Administrative costs are estimated at $120 billion annually. There are approximately 850 health insurance companies that contract with millions of employers to provide coverage. Healthcare Spending By Type In 2010, hospital spending accounted for nearly 36% of personal
- 13. healthcare expenditures, prescription drugs for 12%, physician care for 24%, and nursing care and continuing care communities for 7%. In 2010, private health insurance paid 46.4% of total personal health care, the federal government 34%, state and local governments 11%, and out-of-pocket payments 15%. Healthcare Spending By Type In 2011, private health insurance premiums on a per enrollee basis grew only 3.2%, which was a decrease from 4.6% in 2010. Out-of-pocket payments grew 2.8% in 2011 to $307.7 billion, which was a result of higher cost sharing for healthcare services (CMS, 2013c). In 2011, Medicare spending was $554 billion, 21% of national health spending, and grew 6.2%, an increase from 4.3% in 2010. Healthcare Spending By Type The spending increase is attributed to skilled nursing facility and physician service reimbursements. Medicaid spending was $407.7 billion (2.5%), a decrease from a 5.9% growth rate in 2010. This was due to a slower enrollment rate in Medicaid in 2011. Hospital According to CMS, hospital spending increased 4.3% to $851 billion compared to a 4.9% growth in 2010. There was slower growth in 2011 due to price growth slowdown and less use of hospital services. Medicaid spending for hospital use decreased while Medicare and private health insurance hospital spending and physician spending increased.
- 14. Clinical and Other Professional Services Private health insurance and Medicare spending on clinical services increased in 2011 because there was an increase in clinical service usage by consumers with a 4.3% growth rate from 2010, which had experienced a 3.1% growth rate. Spending on specialty care such as chiropractic services, podiatry, and optometry increased nearly 5% compared to a growth rate of 4.6% in 2010. Clinical and Other Professional Services Dental services increased 3% in 2011, which was a slight increase of 0.3% from 2010. Out-of-pocket spending for dental services, which accounts for 40% of dental spending, increased 4.1% in 2011, compared to a growth rate of 0.7% in 2010. Home Healthcare and Nursing Care/Continuing Care Home health-care agency spending slowed from a 5.3% growth rate in 2010 to a 4.5% growth rate ($74.3 billion) in 2011. In 2011, Medicare and Medicaid spending for home health care, which account for over 80% of home healthcare spending, increased slightly from 2010. Nursing care and continuing care spending increased 4.4% in 2011 compared to 3.2% in 2010. These statistics can be attributed to Medicare spending, which increased in 2011 to 16.5% compared to 7.2% growth in 2010. Prescription Drugs Prescription drug spending grew nearly 3% in 2011, a stark increase from a growth rate of 0.4% in 2010. The difference in the growth rates were due to prescription drug price increases for brand name drugs, although consumers are continuing to purchase more generic drugs.
- 15. Healthcare Spending by State In 2009, the highest per capita of personal healthcare spending was the District of Columbia at $10,349, compared to a low of $5,031 in Utah. The states with the highest Medicare spending per enrollee were New Jersey and Florida. Conclusion As healthcare expenditures continue to increase, the major focus of the healthcare industry is cost control in both the public and private sector. Retrospective reimbursement methods for healthcare services, which means that a provider submitted a bill to a health insurance company that automatically reimbursed the provider, had no incentive to control costs in health care. Conclusion The establishment of a prospective reimbursement system for Medicare—developed based on care criteria for certain conditions regardless of provider costs—was an incentive system for providers to manage how they were providing services Medicare Part A: Hospitalization insurance Part B: Medicare Part B is a supplemental health plan to cover physician services. It is financed 24% from enrollee premiums and 76% from federal treasury funds. Part C: Medicare Advantage: It covers all services in Parts A and B. It is voluntary and available when an individual enrolls in Parts A and B. This program was designed to move Medicare
- 16. patients into more cost-effective health insurance programs such as HMOs or PPOs. Medicare Part D: Prescription Drug Plan: Affordable drugs Medigap or Medicare Supplemental Plan: Medsup plans cover copays, deductibles, and coinsurance, which can be very expensive. Medicare has created 10 medsup plans that vary by state. Medicaid Title XIX of the Social Security Act Provides health insurance to the medically indigent. It is a welfare program that is administered at the state government level. The program serves 45 million low-income Americans. Medicaid spending varies based on the status of the U.S. economy. It is not a federally mandated program, however, all states have Medicaid except Arizona. Medicaid The ACA created Community First Choice as an optional Medicaid benefit, which focuses on community health services to Medicaid enrollees with disabilities. This will enable consumers to receive care at home or at community health centers rather than going to a hospital or their facility. PACE Also authorized by the Balanced Budget Act of 1997, Program of All-Inclusive Care for the Elderly (PACE) is a
- 17. comprehensive healthcare delivery system funded by Medicare and Medicaid. The PACE model focuses on providing community-based care and services to people who otherwise need nursing home levels of care. Their philosophy is that seniors with chronic care needs are better served in the community when possible. Children’s Health Insurance Program (CHIP) Authorized by the Balanced Budget Act of 1997, and codified as Title XXI of the Social Security Act, the State Children's Health Insurance Program (SCHIP), now Children's Health Insurance Program (CHIP), was initiated in response to the number of children who are uninsured in the United States. Government - Hospital Reimbursement In 1982, Congress passed the Tax Equity and Fiscal Responsibility Act (TEFRA) and the Social Security Amendments of 1983 to manage Medicare cost controls. There was a mandate to hospitals for a prospective payment system (PPS) to establish reimbursement rates for certain conditions. Each DRG group represents similar diagnoses of diseases that are expected to have similar use of hospital services. Government - Hospital Reimbursement The amount of reimbursement is set per discharge of a patient. CMS reimburses hospitals per admission and per diagnosis, which is based on a DRG—a prospective payment system for hospitals established through the Social Security Amendments of 1983.
- 18. Government Resource-Based Relative Value Scale Reimbursement Medicare developed a new initiative of RBRVS to reimburse physicians according to a relative value assigned to a service. This reimbursement is divided into three components: physician work, practice expenses and malpractice insurance. Medicare pays a flat fee for physician visit and is based on the Healthcare Common Procedure Coding System which is used to code professional services. The RBRVS, implemented in 1992, has become a standard Medicare Part B reimbursement method Government Reimbursement Resource Utilization Group (RUG) This type of prospective payment systems for skilled nursing facilities, used by Medicare, provides for a per diem based on the clinical severity of patients. A classification system called resource utilization group (RUG), which is a type of DRG, was designed to differentiate patients based on how much they use the resources of the facility. As the patient’s condition changes, the rate of reimbursement changes. Government Reimbursement Home Health Resource Group (HHRG) Implemented in October 2000, the home health resource group (HHRG), which is a prospective payment used by Medicare, pays a fixed predetermined rate for each 60 day episode of care, regardless of the services. All services are bundled under a home health agency. The HHRG uses 80 distinct groups to classify patients’ condition
- 19. CMS Innovation: 4 Models 1: The Bundled Payments Initiative: Link payments that multiple service beneficiaries receive during an episode of care. 2 and 3: Retrospective bundled payment arrangement where actual expenditures are reconciled against a target price for an episode of care. 4: Model 4 involves a prospective bundled payment arrangement, where a lump sum payment is made to a provider for the entire episode of care. Table 8-1 7.8% 5.5% 4.8% 7.2% 12.7% 10.8% 6.6% 7.1% 9.5% 10.6% 0% 2% 4% 6% 8% 10% 12% 14%
- 20. 1970s1980s1990s2000-20081970-2008 GDPNHE $148 $356 $1,100 $2,814 $4,295 $4,522 $4,789 $5,150 $5,564 $5,973 $6,327 $6,701 $7,071 $7,423 $7,681 $0 $1,000 $2,000 $3,000 $4,000 $5,000 $6,000 $7,000 $8,000 $9,000 19601970198019901998199920002001200220032004200520062 0072008 NHE as a Share of GDP Physician/ Clinical Services 21.2% Hospital Care 30.7%
- 21. Other Personal Health Care 12.9% Nursing Home Care, 5.9% Prescription Drugs 10.0% Home Health Care, 2.8% Other Health Spending 16.5% 400% FPL and Above 10% 200-399% FPL 23% 100-199% FPL 29% <100% FPL 38% 20% 89% 45% 29% 12% 5% 42% 71% 6% 18% 29% 35% PrivateMedicaid/PublicUninsured 12%
- 22. 27% 55% 52% 19% 14% 8% 12% UninsuredAll Nonelderly $8,167 $9,773 $2,713 $3,997 20052010 Worker Contribution Employer Contribution Chart12005200520102010 Employer Contribution Worker Contribution 8167 2713 9772.6814 3997.1688 Sheet1Employer ContributionWorker Contribution20058167.0000271320109772.68143997.1688 $4,247 $9,860 $1,543 $3,515 19992009 Employer Contribution Worker Contribution Chart119991999200020002001200120022002200320032004200 4200520052006200620072007200820082009200920102010 Single Coverage Family Coverage $39*
- 25. 2137 5866 1787 5269 1619 4819 1543 4247 Sheet120102009200820072006200520042003200220012000199 9Worker Contribution$3,997$3,515$3,354$3,281$2,973$2,713$2,661$2,4 12$2,137$1,787$1,619$1,543Employer Contribution$9,773$9,860$9,325$8,824$8,508$8,167$7,289$6,6 57$5,866$5,269$4,819$4,247 YOU DO NOT HAVE TO ANSWER EACH QUESTION ON THIS SHEET. THE QUESTIONS ARE THERE TO HELP ORGANIZE THE THOUGHTS AND GIVE YOU A GENERAL IDEA OF WHAT INFORMATION TO INCLUDE IN THE PAPER. Document Analysis and/or Website Analysis Worksheet 1. Type of document? (i.e.,: brochure, newsletter, website, etc.) 2. What is this document or website used for? 3. Are there any unique or interesting characteristics about this document or website? 4. For what audience was the document written or website created? 5. What are the key messages this document or website conveys? 6. Specifically HOW are the messages conveyed?
- 26. 7. List 2-3 things this document or website tells you about life or culture in that region (or in the U.S.) during the time it was/is written 8. In what ways is this document or website effective/ineffective in conveying its messages? 9. Based on the information you can gather from the document or website, what do you believe are the underlying values (or assumptions, or beliefs) of the place where these documents originated? 10. Was the document or website easy to use? Easy to read? Well organized? Up-to-date? Interesting to look at? Informative? What might this say about the place where the document or website originated? 11. Provide other general comments about the document or website that might be useful to know or consider Informal Overview of Assessment Practices at a Chosen College or University Selected College – Alabama State University in Montgomery, AL Each student will choose a college or university and will be expected to make inquiries via the web about the various assessment practices or instruments this college or university uses. This will require you to browse the institution’s Office of Institutional Research, Office of Institutional Effectiveness, Office of Assessment, etc. You will need to do some research to figure out where the college houses its assessment information. On the scheduled day on the syllabus, you will submit the assignment through the assignment link in the designated learning module AND post on
- 27. the Discussion Boardinside of Blackboard a 2 typed-page discussion of your findings including: (1) a reflection on how easy or difficult it was to find the information, (2) a discussion of how much importance you think the college or university places on assessment based on your findings, and (3) a brief discussion of their assessment practices. Please make sure your assignment is formatted in APA, 6th edition and includes an APA title page. Also, while this is an informal assignment, students are expected to complete this assignment in a fashion that is reflective of graduate-level work to include correct grammar, etc. Rising Costs Healthcare USA HE362W Contemporary Health Issues After reading Chapter 8 and watching “The Other Drug War” you have enough information to analyze what factors are contributing to rising healthcare costs? Also see specific US Healthcare Costs and Prescription Drug Costs, both summaries on Kaiser Family Foundation website. You may use other sources of information, remember to properly cite each. Use citations in the text of the paper and Works Cited at the end of the paper, APA style. Criteria Points Score Introduction/ opening statement: · Define factors contributing to rising costs in the USA
- 28. 2 Discussion/ description of issue · How are healthcare costs measured, and how are these numbers increasing? · What are the main areas of healthcare expenditures? · Pharmaceutical companies- how do they justify their high prices? How is this contributing to rising costs? · Cite evidence (facts and examples) to support your view 4 Concluding statement · Make inferences-how is this relevant to health and healthcare · Summarize your professional response and thoughts 2 Grammar/ Syntax/ Spelling · Well written and well organized · Work cited in text and referenced 2 Total 10