1. Nutritional Interventions in Refugee Populations
Zoë Anderson, Christelle Elia, Racha Fayad, Brian MacKenna, Sabina Nistor
• From 2010-2015 the global refugee population grew by 4.7 million people
(45%) out of which > 4 million were from Syria 1
• Sub-Saharan Africa hosts the largest number of refugees Worldwide
• The number of people able to return to their country of origin is decreasing
• Sustainable Development Goals (#2: no hunger, and #3: good health) 2
• Barriers to adequate nutrition among refugees include; climate (i.e. drought,
floods), fluctuating supply of resources (i.e. foreign aid, food production),
poor sanitation, armed conflict, local cultural practice
• Global Acute Malnutrition (GAM) of ≥15% is classified as critical (WHO3)
References
1. UNHCR. (2015) Mid-Year Trend 2015.
2. United Nations. (2016) Sustainable Development Goals.
3. World Health Organisation.(2000) Manual on the management of nutrition in major emergencies.
4. Sphere Project. (2011) Sphere Handbook: Humanitarian Charter and Minimum Standards in Disaster Response.
Background Conceptual framework of the
causes of undernutrition4
Conclusion
2001 2002 2003 2004 2005 2006 2007 2008 2009 2010 2011 2012 2013 2014 2015
0
5
10
15
20
25
30
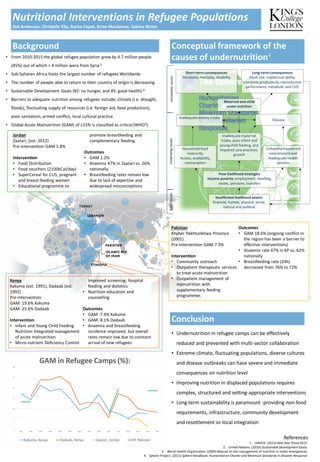
GAM in Refugee Camps (%):
Kakuma, Kenya Dadaab, Kenya Zaatari, Jordan KP, Pakistan
• Undernutrition in refugee camps can be effectively
reduced and prevented with multi-sector collaboration
• Extreme climate, fluctuating populations, diverse cultures
and disease outbreaks can have severe and immediate
consequences on nutrition level
• Improving nutrition in displaced populations requires
complex, structured and setting-appropriate interventions
• Long term sustainability is paramount -providing non-food
requirements, infrastructure, community development
and resettlement or local integration
Kenya
Kakuma (est. 1991), Dadaab (est.
1992)
Pre-Intervention
GAM: 19.6% Kakuma
GAM: 25.6% Dadaab
Intervention
• Infant and Young Child Feeding
Nutrition Integrated management
of acute malnutrition
• Micro-nutrient Deficiency Control
Improved screening: hospital
feeding and dietetics
• Nutrition education and
counselling
Outcomes
• GAM :7.4% Kakuma
• GAM: 8.1% Dadaab
• Anaemia and breastfeeding
incidence improved, but overall
rates remain low due to constant
arrival of new refugees
Pakistan
Khyber Pakhtunkhwa Province
(2001)
Pre-intervention GAM 7.3%
Intervention
• Community outreach
• Outpatient therapeutic services
to treat acute malnutrition
• Outpatient management of
malnutrition with
supplementary feeding
programmes
Outcomes
• GAM 18.6% (ongoing conflict in
the region has been a barrier to
effective interventions)
• Anaemia rate 47% in KP vs. 62%
nationally
• Breastfeeding rate (24h)
decreased from 76% to 72%
Jordan
Zaatari, (est. 2012)
Pre-intervention GAM 5.8%
Intervention
• Food Distribution
• Food vouchers (2100kCal/day)
• SuperCereal for CU5, pregnant
and breast-feeding women
• Educational programme to
promote breastfeeding and
complementary feeding
Outcomes
• GAM 1.2%
• Anaemia 47% in Zaatari vs. 26%
nationally
• Breastfeeding rates remain low
due to lack of expertise and
widespread misconceptions
Insufficient livelihood assets:
financial, human, physical, social,
natural and political
Maternal and child
under nutrition
Unhealthy household
environmentand
inadequate health
services
Inadequate maternal
intake, poor infant and
youngchild feeding, and
impaired care practices,
growth
Household food
insecurity
Access, availability,
consumption
Poor livelihood strategies
Income poverty: employment, dwelling,
assets, pensions, transfers
Inadequate dietary intake
Long-term consequences
Adult size, intellectual ability,
economic productivity,reproductive
performance,metabolic and CVD
Short-term consequences
Morbidity, mortality, disability
Disease
ImmediatecausesUnderlyingcausesBasiccauses