SlideShare a Scribd company logo
1 of 8
The Five Number Summary When we look at large amounts of data, it can sometimes be more convenient to describe the data, rather than list it each time. A five number summary is one such description. We are already familiar with three of the five numbers in a five number summary. They are the minimum, median, and maximum. The other two numbers are known as the first and third  quartiles . 10,  10,  11,  15,  17,  25,  27,  27,  30,  35,  38,  39,  41,  41,  41,  44,  50 Minimum: 1st Quartile (Q 1 ): Median (Q 2 ): 3rd Quartile (Q 3 ): Maximum: The 1 st  quartile is the “median” of the numbers that are less than the median. The 3 rd  quartile is the “median” of the numbers that are greater than the median.
Box Plots A five number summary can be used to create a  visual  representation of data. Can you find the members of the five number summary in this box plot? On your own, write a five number summary of the heights (in inches) of the 2007-2008 Men’s Basketball team at Haverford College, and draw a box plot to represent it. We will review in three minutes. Here are the heights: 70  70  71  71  72  72  72  72  73  73  76  77  77  79  79 0 10 20 30 40 50 60
Haverford College Men’s Basketball Heights Min: 70” Q1: 71” Med: 72” Q3: 77” Max: 79” You can see that the “box” part of the plot seems to be strongly emphasized. The size of this area is very important, and we call it the  interquartile range  or  IQR . IQR = Q 3  – Q 1 The interquartile range, along with the  range  (max – min) is known as a  measure of spread . 68 70 72 74 76 78 80 82 84
68 70 72 74 76 78 80 82 84 66 Calculate the range and the IQR for the heights of the three teams above. Discuss with the person sitting next to you what the different numbers mean, and what, if any, conclusions you can draw from them.
Percentiles Often, you will hear about  percentiles  with regards to certain test scores. For example, my nephew Jacob: Is in the 75 th  percentile with regards to weight for his age (8 weeks). What does this mean?
Here are the heights (in inches) once again of last year’s Haverford College Men’s Basketball team: 70  70  71  71  72  72  72  72  73  73  76  77  77  79  79 In what percentile is a player who is 6’4”? How would you determine the height that is at the 90 th  percentile for the team?
Outliers We have discussed  outliers  informally in class, but we haven’t had a formal definition. One of the reasons for this is that there are  many  different definitions for outliers. We will now discuss just one of those definitions. Often, a statistic is considered an outlier if it lies more than a certain distance from the quartiles (either less than Q1 or greater than Q3). A commonly used criteria for that distance is 1.5 times the IQR. For the Fords (yup, that’s the nickname), were there any outliers? Min: 70” Q1: 71” Med: 72” Q3: 77” Max: 79”
Let’s go back to our comparison of Babe Ruth and Roger Maris. Do any of the statistics seem to be outliers? Use the 1.5 x IQR criterion to find out. ,[object Object],[object Object],[object Object],[object Object],[object Object],0 1 2 3 4 5 6 ,[object Object],[object Object],[object Object],[object Object],[object Object],Maris Ruth

More Related Content

Viewers also liked

Inter quartile range
Inter quartile rangeInter quartile range
Inter quartile rangeKen Plummer
 
5 Number Summary - Stats 146
5 Number Summary - Stats 1465 Number Summary - Stats 146
5 Number Summary - Stats 146gspm0m
 
Finding Interquartile Range from Dot Plot 2
Finding Interquartile Range from Dot Plot 2Finding Interquartile Range from Dot Plot 2
Finding Interquartile Range from Dot Plot 2Moonie Kim
 
Further4 box plots, 5 number summary and outliers
Further4  box plots, 5 number summary and outliersFurther4  box plots, 5 number summary and outliers
Further4 box plots, 5 number summary and outlierskmcmullen
 
Further3 summarising univariate data
Further3  summarising univariate dataFurther3  summarising univariate data
Further3 summarising univariate datakmcmullen
 
Finding the Mean Introduction
Finding the Mean IntroductionFinding the Mean Introduction
Finding the Mean IntroductionMoonie Kim
 
Stem and-leaf plots
Stem and-leaf plotsStem and-leaf plots
Stem and-leaf plotsValPatton
 
Stem and leaf plot
Stem and leaf plotStem and leaf plot
Stem and leaf plotbbeiers
 
Finding Interquartile Range Introduction
Finding Interquartile Range IntroductionFinding Interquartile Range Introduction
Finding Interquartile Range IntroductionMoonie Kim
 
Computation of area
Computation of areaComputation of area
Computation of areaKavin Raval
 
Properties of Standard Deviation
Properties of Standard DeviationProperties of Standard Deviation
Properties of Standard DeviationRizwan Sharif
 
Scatter plots
Scatter plotsScatter plots
Scatter plotsswartzje
 
Standard Deviation
Standard DeviationStandard Deviation
Standard Deviationpwheeles
 
Variance and standard deviation
Variance and standard deviationVariance and standard deviation
Variance and standard deviationAmrit Swaroop
 
Spearman Rank Correlation Presentation
Spearman Rank Correlation PresentationSpearman Rank Correlation Presentation
Spearman Rank Correlation Presentationcae_021
 
Standard deviation
Standard deviationStandard deviation
Standard deviationKen Plummer
 

Viewers also liked (20)

Inter quartile range
Inter quartile rangeInter quartile range
Inter quartile range
 
5 Number Summary - Stats 146
5 Number Summary - Stats 1465 Number Summary - Stats 146
5 Number Summary - Stats 146
 
Finding Interquartile Range from Dot Plot 2
Finding Interquartile Range from Dot Plot 2Finding Interquartile Range from Dot Plot 2
Finding Interquartile Range from Dot Plot 2
 
HISTOGRAMS
HISTOGRAMSHISTOGRAMS
HISTOGRAMS
 
Further4 box plots, 5 number summary and outliers
Further4  box plots, 5 number summary and outliersFurther4  box plots, 5 number summary and outliers
Further4 box plots, 5 number summary and outliers
 
Further3 summarising univariate data
Further3  summarising univariate dataFurther3  summarising univariate data
Further3 summarising univariate data
 
Finding the Mean Introduction
Finding the Mean IntroductionFinding the Mean Introduction
Finding the Mean Introduction
 
Stem and-leaf plots
Stem and-leaf plotsStem and-leaf plots
Stem and-leaf plots
 
Stem and leaf plot
Stem and leaf plotStem and leaf plot
Stem and leaf plot
 
Cost curve
Cost curveCost curve
Cost curve
 
Finding Interquartile Range Introduction
Finding Interquartile Range IntroductionFinding Interquartile Range Introduction
Finding Interquartile Range Introduction
 
Computation of area
Computation of areaComputation of area
Computation of area
 
Properties of Standard Deviation
Properties of Standard DeviationProperties of Standard Deviation
Properties of Standard Deviation
 
Scatter plots
Scatter plotsScatter plots
Scatter plots
 
Standard Deviation
Standard DeviationStandard Deviation
Standard Deviation
 
Variance and standard deviation
Variance and standard deviationVariance and standard deviation
Variance and standard deviation
 
Standard deviation
Standard deviationStandard deviation
Standard deviation
 
Spearman Rank Correlation Presentation
Spearman Rank Correlation PresentationSpearman Rank Correlation Presentation
Spearman Rank Correlation Presentation
 
Variance And Standard Deviation
Variance And Standard DeviationVariance And Standard Deviation
Variance And Standard Deviation
 
Standard deviation
Standard deviationStandard deviation
Standard deviation
 

Similar to Lesson 1-4 -- Five Number Summary

Basics of Stats (2).pptx
Basics of Stats (2).pptxBasics of Stats (2).pptx
Basics of Stats (2).pptxmadihamaqbool6
 
Measures of Position - Elementary Statistics
Measures of Position - Elementary StatisticsMeasures of Position - Elementary Statistics
Measures of Position - Elementary StatisticsFlipped Channel
 
Week3 Quiz Live Lecture 2010
Week3 Quiz Live Lecture 2010Week3 Quiz Live Lecture 2010
Week3 Quiz Live Lecture 2010Brent Heard
 
Week3 Quiz Live Lecture
Week3 Quiz Live LectureWeek3 Quiz Live Lecture
Week3 Quiz Live LectureBrent Heard
 
Analysing our results
Analysing our resultsAnalysing our results
Analysing our resultsgwsis
 
Algebra unit 9.3
Algebra unit 9.3Algebra unit 9.3
Algebra unit 9.3Mark Ryder
 
m2_2_variation_z_scores.pptx
m2_2_variation_z_scores.pptxm2_2_variation_z_scores.pptx
m2_2_variation_z_scores.pptxMesfinMelese4
 
Week 3 quiz_review_mini_tab_2011
Week 3 quiz_review_mini_tab_2011Week 3 quiz_review_mini_tab_2011
Week 3 quiz_review_mini_tab_2011Brent Heard
 
Fundamental of Biostatics DR.SOMANATH.ppt
Fundamental of Biostatics DR.SOMANATH.pptFundamental of Biostatics DR.SOMANATH.ppt
Fundamental of Biostatics DR.SOMANATH.pptDentalYoutube
 
Statistics (Measures of Dispersion)
Statistics (Measures of Dispersion)Statistics (Measures of Dispersion)
Statistics (Measures of Dispersion)Ron_Eick
 
(8) Lesson 9.3
(8) Lesson 9.3(8) Lesson 9.3
(8) Lesson 9.3wzuri
 
35880 Topic Discussion7Number of Pages 1 (Double Spaced).docx
35880 Topic Discussion7Number of Pages 1 (Double Spaced).docx35880 Topic Discussion7Number of Pages 1 (Double Spaced).docx
35880 Topic Discussion7Number of Pages 1 (Double Spaced).docxdomenicacullison
 
Boxand whiskerplotpowerpoint
Boxand whiskerplotpowerpointBoxand whiskerplotpowerpoint
Boxand whiskerplotpowerpointValPatton
 
These is info only ill be attaching the questions work CJ 301 – .docx
These is info only ill be attaching the questions work CJ 301 – .docxThese is info only ill be attaching the questions work CJ 301 – .docx
These is info only ill be attaching the questions work CJ 301 – .docxmeagantobias
 
Statistics trinity college
Statistics trinity collegeStatistics trinity college
Statistics trinity collegeStacy Carter
 
Statistics trinity college
Statistics trinity collegeStatistics trinity college
Statistics trinity collegeStacy Carter
 

Similar to Lesson 1-4 -- Five Number Summary (20)

Basics of Stats (2).pptx
Basics of Stats (2).pptxBasics of Stats (2).pptx
Basics of Stats (2).pptx
 
Measures of Position - Elementary Statistics
Measures of Position - Elementary StatisticsMeasures of Position - Elementary Statistics
Measures of Position - Elementary Statistics
 
Standardized tests
Standardized testsStandardized tests
Standardized tests
 
Week3 Quiz Live Lecture 2010
Week3 Quiz Live Lecture 2010Week3 Quiz Live Lecture 2010
Week3 Quiz Live Lecture 2010
 
Mean, median, mode and range
Mean, median, mode and rangeMean, median, mode and range
Mean, median, mode and range
 
Week3 Quiz Live Lecture
Week3 Quiz Live LectureWeek3 Quiz Live Lecture
Week3 Quiz Live Lecture
 
Measures of variation discuss 2.1
Measures of variation discuss  2.1Measures of variation discuss  2.1
Measures of variation discuss 2.1
 
Analysing our results
Analysing our resultsAnalysing our results
Analysing our results
 
Algebra unit 9.3
Algebra unit 9.3Algebra unit 9.3
Algebra unit 9.3
 
m2_2_variation_z_scores.pptx
m2_2_variation_z_scores.pptxm2_2_variation_z_scores.pptx
m2_2_variation_z_scores.pptx
 
Week 3 quiz_review_mini_tab_2011
Week 3 quiz_review_mini_tab_2011Week 3 quiz_review_mini_tab_2011
Week 3 quiz_review_mini_tab_2011
 
Fundamental of Biostatics DR.SOMANATH.ppt
Fundamental of Biostatics DR.SOMANATH.pptFundamental of Biostatics DR.SOMANATH.ppt
Fundamental of Biostatics DR.SOMANATH.ppt
 
Statistics (Measures of Dispersion)
Statistics (Measures of Dispersion)Statistics (Measures of Dispersion)
Statistics (Measures of Dispersion)
 
(8) Lesson 9.3
(8) Lesson 9.3(8) Lesson 9.3
(8) Lesson 9.3
 
35880 Topic Discussion7Number of Pages 1 (Double Spaced).docx
35880 Topic Discussion7Number of Pages 1 (Double Spaced).docx35880 Topic Discussion7Number of Pages 1 (Double Spaced).docx
35880 Topic Discussion7Number of Pages 1 (Double Spaced).docx
 
Boxand whiskerplotpowerpoint
Boxand whiskerplotpowerpointBoxand whiskerplotpowerpoint
Boxand whiskerplotpowerpoint
 
These is info only ill be attaching the questions work CJ 301 – .docx
These is info only ill be attaching the questions work CJ 301 – .docxThese is info only ill be attaching the questions work CJ 301 – .docx
These is info only ill be attaching the questions work CJ 301 – .docx
 
Statistics for ess
Statistics for essStatistics for ess
Statistics for ess
 
Statistics trinity college
Statistics trinity collegeStatistics trinity college
Statistics trinity college
 
Statistics trinity college
Statistics trinity collegeStatistics trinity college
Statistics trinity college
 

More from chrismac47

Section 2 3 (1)
Section 2 3 (1)Section 2 3 (1)
Section 2 3 (1)chrismac47
 
Section 2.5 (2)
Section 2.5 (2)Section 2.5 (2)
Section 2.5 (2)chrismac47
 
Lesson 1 7 (3)
Lesson 1 7 (3)Lesson 1 7 (3)
Lesson 1 7 (3)chrismac47
 
Section 1-4 -- Trapezoid Rule
Section 1-4 -- Trapezoid RuleSection 1-4 -- Trapezoid Rule
Section 1-4 -- Trapezoid Rulechrismac47
 
Section 1-3 -- Definite Integrals
Section 1-3 -- Definite IntegralsSection 1-3 -- Definite Integrals
Section 1-3 -- Definite Integralschrismac47
 
5.12.08 Advanced Factoring1
5.12.08   Advanced Factoring15.12.08   Advanced Factoring1
5.12.08 Advanced Factoring1chrismac47
 
5.6.08 Fundamental Theorem Of Algebra1
5.6.08   Fundamental Theorem Of Algebra15.6.08   Fundamental Theorem Of Algebra1
5.6.08 Fundamental Theorem Of Algebra1chrismac47
 
4.14.08 Finding Polynomial Models1 2
4.14.08   Finding Polynomial Models1 24.14.08   Finding Polynomial Models1 2
4.14.08 Finding Polynomial Models1 2chrismac47
 
4.9.08 Polynomial Models3
4.9.08   Polynomial Models34.9.08   Polynomial Models3
4.9.08 Polynomial Models3chrismac47
 
4.10.08 Graphs Of Polynomials
4.10.08   Graphs Of Polynomials4.10.08   Graphs Of Polynomials
4.10.08 Graphs Of Polynomialschrismac47
 
4.3.08 Binomial Prob 1
4.3.08   Binomial Prob 14.3.08   Binomial Prob 1
4.3.08 Binomial Prob 1chrismac47
 
4.1.08 Pascals Triangle2
4.1.08   Pascals Triangle24.1.08   Pascals Triangle2
4.1.08 Pascals Triangle2chrismac47
 

More from chrismac47 (20)

Lesson 2-5
Lesson 2-5Lesson 2-5
Lesson 2-5
 
Lesson 2 1
Lesson 2 1Lesson 2 1
Lesson 2 1
 
Lesson 2 2
Lesson 2 2Lesson 2 2
Lesson 2 2
 
Section 2 3 (1)
Section 2 3 (1)Section 2 3 (1)
Section 2 3 (1)
 
Section 2.5 (2)
Section 2.5 (2)Section 2.5 (2)
Section 2.5 (2)
 
Section 2.4
Section 2.4Section 2.4
Section 2.4
 
Lesson 1 7 (3)
Lesson 1 7 (3)Lesson 1 7 (3)
Lesson 1 7 (3)
 
Section 1-5
Section 1-5Section 1-5
Section 1-5
 
Section 1-4 -- Trapezoid Rule
Section 1-4 -- Trapezoid RuleSection 1-4 -- Trapezoid Rule
Section 1-4 -- Trapezoid Rule
 
Section 1-3 -- Definite Integrals
Section 1-3 -- Definite IntegralsSection 1-3 -- Definite Integrals
Section 1-3 -- Definite Integrals
 
Lesson 1-3
Lesson 1-3Lesson 1-3
Lesson 1-3
 
Section 1-2
Section 1-2Section 1-2
Section 1-2
 
Lesson 1 2
Lesson 1 2Lesson 1 2
Lesson 1 2
 
5.12.08 Advanced Factoring1
5.12.08   Advanced Factoring15.12.08   Advanced Factoring1
5.12.08 Advanced Factoring1
 
5.6.08 Fundamental Theorem Of Algebra1
5.6.08   Fundamental Theorem Of Algebra15.6.08   Fundamental Theorem Of Algebra1
5.6.08 Fundamental Theorem Of Algebra1
 
4.14.08 Finding Polynomial Models1 2
4.14.08   Finding Polynomial Models1 24.14.08   Finding Polynomial Models1 2
4.14.08 Finding Polynomial Models1 2
 
4.9.08 Polynomial Models3
4.9.08   Polynomial Models34.9.08   Polynomial Models3
4.9.08 Polynomial Models3
 
4.10.08 Graphs Of Polynomials
4.10.08   Graphs Of Polynomials4.10.08   Graphs Of Polynomials
4.10.08 Graphs Of Polynomials
 
4.3.08 Binomial Prob 1
4.3.08   Binomial Prob 14.3.08   Binomial Prob 1
4.3.08 Binomial Prob 1
 
4.1.08 Pascals Triangle2
4.1.08   Pascals Triangle24.1.08   Pascals Triangle2
4.1.08 Pascals Triangle2
 

Recently uploaded

AMERICAN LANGUAGE HUB_Level2_Student'sBook_Answerkey.pdf
AMERICAN LANGUAGE HUB_Level2_Student'sBook_Answerkey.pdfAMERICAN LANGUAGE HUB_Level2_Student'sBook_Answerkey.pdf
AMERICAN LANGUAGE HUB_Level2_Student'sBook_Answerkey.pdfphamnguyenenglishnb
 
ENGLISH 7_Q4_LESSON 2_ Employing a Variety of Strategies for Effective Interp...
ENGLISH 7_Q4_LESSON 2_ Employing a Variety of Strategies for Effective Interp...ENGLISH 7_Q4_LESSON 2_ Employing a Variety of Strategies for Effective Interp...
ENGLISH 7_Q4_LESSON 2_ Employing a Variety of Strategies for Effective Interp...JhezDiaz1
 
Gas measurement O2,Co2,& ph) 04/2024.pptx
Gas measurement O2,Co2,& ph) 04/2024.pptxGas measurement O2,Co2,& ph) 04/2024.pptx
Gas measurement O2,Co2,& ph) 04/2024.pptxDr.Ibrahim Hassaan
 
Field Attribute Index Feature in Odoo 17
Field Attribute Index Feature in Odoo 17Field Attribute Index Feature in Odoo 17
Field Attribute Index Feature in Odoo 17Celine George
 
Judging the Relevance and worth of ideas part 2.pptx
Judging the Relevance  and worth of ideas part 2.pptxJudging the Relevance  and worth of ideas part 2.pptx
Judging the Relevance and worth of ideas part 2.pptxSherlyMaeNeri
 
Computed Fields and api Depends in the Odoo 17
Computed Fields and api Depends in the Odoo 17Computed Fields and api Depends in the Odoo 17
Computed Fields and api Depends in the Odoo 17Celine George
 
ENGLISH6-Q4-W3.pptxqurter our high choom
ENGLISH6-Q4-W3.pptxqurter our high choomENGLISH6-Q4-W3.pptxqurter our high choom
ENGLISH6-Q4-W3.pptxqurter our high choomnelietumpap1
 
Crayon Activity Handout For the Crayon A
Crayon Activity Handout For the Crayon ACrayon Activity Handout For the Crayon A
Crayon Activity Handout For the Crayon AUnboundStockton
 
Difference Between Search & Browse Methods in Odoo 17
Difference Between Search & Browse Methods in Odoo 17Difference Between Search & Browse Methods in Odoo 17
Difference Between Search & Browse Methods in Odoo 17Celine George
 
MULTIDISCIPLINRY NATURE OF THE ENVIRONMENTAL STUDIES.pptx
MULTIDISCIPLINRY NATURE OF THE ENVIRONMENTAL STUDIES.pptxMULTIDISCIPLINRY NATURE OF THE ENVIRONMENTAL STUDIES.pptx
MULTIDISCIPLINRY NATURE OF THE ENVIRONMENTAL STUDIES.pptxAnupkumar Sharma
 
ROOT CAUSE ANALYSIS PowerPoint Presentation
ROOT CAUSE ANALYSIS PowerPoint PresentationROOT CAUSE ANALYSIS PowerPoint Presentation
ROOT CAUSE ANALYSIS PowerPoint PresentationAadityaSharma884161
 
Introduction to ArtificiaI Intelligence in Higher Education
Introduction to ArtificiaI Intelligence in Higher EducationIntroduction to ArtificiaI Intelligence in Higher Education
Introduction to ArtificiaI Intelligence in Higher Educationpboyjonauth
 
Hierarchy of management that covers different levels of management
Hierarchy of management that covers different levels of managementHierarchy of management that covers different levels of management
Hierarchy of management that covers different levels of managementmkooblal
 
ACC 2024 Chronicles. Cardiology. Exam.pdf
ACC 2024 Chronicles. Cardiology. Exam.pdfACC 2024 Chronicles. Cardiology. Exam.pdf
ACC 2024 Chronicles. Cardiology. Exam.pdfSpandanaRallapalli
 
Proudly South Africa powerpoint Thorisha.pptx
Proudly South Africa powerpoint Thorisha.pptxProudly South Africa powerpoint Thorisha.pptx
Proudly South Africa powerpoint Thorisha.pptxthorishapillay1
 
Roles & Responsibilities in Pharmacovigilance
Roles & Responsibilities in PharmacovigilanceRoles & Responsibilities in Pharmacovigilance
Roles & Responsibilities in PharmacovigilanceSamikshaHamane
 

Recently uploaded (20)

AMERICAN LANGUAGE HUB_Level2_Student'sBook_Answerkey.pdf
AMERICAN LANGUAGE HUB_Level2_Student'sBook_Answerkey.pdfAMERICAN LANGUAGE HUB_Level2_Student'sBook_Answerkey.pdf
AMERICAN LANGUAGE HUB_Level2_Student'sBook_Answerkey.pdf
 
ENGLISH 7_Q4_LESSON 2_ Employing a Variety of Strategies for Effective Interp...
ENGLISH 7_Q4_LESSON 2_ Employing a Variety of Strategies for Effective Interp...ENGLISH 7_Q4_LESSON 2_ Employing a Variety of Strategies for Effective Interp...
ENGLISH 7_Q4_LESSON 2_ Employing a Variety of Strategies for Effective Interp...
 
Gas measurement O2,Co2,& ph) 04/2024.pptx
Gas measurement O2,Co2,& ph) 04/2024.pptxGas measurement O2,Co2,& ph) 04/2024.pptx
Gas measurement O2,Co2,& ph) 04/2024.pptx
 
Field Attribute Index Feature in Odoo 17
Field Attribute Index Feature in Odoo 17Field Attribute Index Feature in Odoo 17
Field Attribute Index Feature in Odoo 17
 
9953330565 Low Rate Call Girls In Rohini Delhi NCR
9953330565 Low Rate Call Girls In Rohini  Delhi NCR9953330565 Low Rate Call Girls In Rohini  Delhi NCR
9953330565 Low Rate Call Girls In Rohini Delhi NCR
 
Judging the Relevance and worth of ideas part 2.pptx
Judging the Relevance  and worth of ideas part 2.pptxJudging the Relevance  and worth of ideas part 2.pptx
Judging the Relevance and worth of ideas part 2.pptx
 
Model Call Girl in Tilak Nagar Delhi reach out to us at 🔝9953056974🔝
Model Call Girl in Tilak Nagar Delhi reach out to us at 🔝9953056974🔝Model Call Girl in Tilak Nagar Delhi reach out to us at 🔝9953056974🔝
Model Call Girl in Tilak Nagar Delhi reach out to us at 🔝9953056974🔝
 
Computed Fields and api Depends in the Odoo 17
Computed Fields and api Depends in the Odoo 17Computed Fields and api Depends in the Odoo 17
Computed Fields and api Depends in the Odoo 17
 
Rapple "Scholarly Communications and the Sustainable Development Goals"
Rapple "Scholarly Communications and the Sustainable Development Goals"Rapple "Scholarly Communications and the Sustainable Development Goals"
Rapple "Scholarly Communications and the Sustainable Development Goals"
 
ENGLISH6-Q4-W3.pptxqurter our high choom
ENGLISH6-Q4-W3.pptxqurter our high choomENGLISH6-Q4-W3.pptxqurter our high choom
ENGLISH6-Q4-W3.pptxqurter our high choom
 
TataKelola dan KamSiber Kecerdasan Buatan v022.pdf
TataKelola dan KamSiber Kecerdasan Buatan v022.pdfTataKelola dan KamSiber Kecerdasan Buatan v022.pdf
TataKelola dan KamSiber Kecerdasan Buatan v022.pdf
 
Crayon Activity Handout For the Crayon A
Crayon Activity Handout For the Crayon ACrayon Activity Handout For the Crayon A
Crayon Activity Handout For the Crayon A
 
Difference Between Search & Browse Methods in Odoo 17
Difference Between Search & Browse Methods in Odoo 17Difference Between Search & Browse Methods in Odoo 17
Difference Between Search & Browse Methods in Odoo 17
 
MULTIDISCIPLINRY NATURE OF THE ENVIRONMENTAL STUDIES.pptx
MULTIDISCIPLINRY NATURE OF THE ENVIRONMENTAL STUDIES.pptxMULTIDISCIPLINRY NATURE OF THE ENVIRONMENTAL STUDIES.pptx
MULTIDISCIPLINRY NATURE OF THE ENVIRONMENTAL STUDIES.pptx
 
ROOT CAUSE ANALYSIS PowerPoint Presentation
ROOT CAUSE ANALYSIS PowerPoint PresentationROOT CAUSE ANALYSIS PowerPoint Presentation
ROOT CAUSE ANALYSIS PowerPoint Presentation
 
Introduction to ArtificiaI Intelligence in Higher Education
Introduction to ArtificiaI Intelligence in Higher EducationIntroduction to ArtificiaI Intelligence in Higher Education
Introduction to ArtificiaI Intelligence in Higher Education
 
Hierarchy of management that covers different levels of management
Hierarchy of management that covers different levels of managementHierarchy of management that covers different levels of management
Hierarchy of management that covers different levels of management
 
ACC 2024 Chronicles. Cardiology. Exam.pdf
ACC 2024 Chronicles. Cardiology. Exam.pdfACC 2024 Chronicles. Cardiology. Exam.pdf
ACC 2024 Chronicles. Cardiology. Exam.pdf
 
Proudly South Africa powerpoint Thorisha.pptx
Proudly South Africa powerpoint Thorisha.pptxProudly South Africa powerpoint Thorisha.pptx
Proudly South Africa powerpoint Thorisha.pptx
 
Roles & Responsibilities in Pharmacovigilance
Roles & Responsibilities in PharmacovigilanceRoles & Responsibilities in Pharmacovigilance
Roles & Responsibilities in Pharmacovigilance
 

Lesson 1-4 -- Five Number Summary

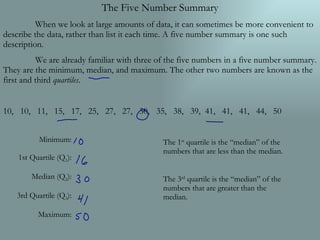
  • 1. The Five Number Summary When we look at large amounts of data, it can sometimes be more convenient to describe the data, rather than list it each time. A five number summary is one such description. We are already familiar with three of the five numbers in a five number summary. They are the minimum, median, and maximum. The other two numbers are known as the first and third quartiles . 10, 10, 11, 15, 17, 25, 27, 27, 30, 35, 38, 39, 41, 41, 41, 44, 50 Minimum: 1st Quartile (Q 1 ): Median (Q 2 ): 3rd Quartile (Q 3 ): Maximum: The 1 st quartile is the “median” of the numbers that are less than the median. The 3 rd quartile is the “median” of the numbers that are greater than the median.
  • 2. Box Plots A five number summary can be used to create a visual representation of data. Can you find the members of the five number summary in this box plot? On your own, write a five number summary of the heights (in inches) of the 2007-2008 Men’s Basketball team at Haverford College, and draw a box plot to represent it. We will review in three minutes. Here are the heights: 70 70 71 71 72 72 72 72 73 73 76 77 77 79 79 0 10 20 30 40 50 60
  • 3. Haverford College Men’s Basketball Heights Min: 70” Q1: 71” Med: 72” Q3: 77” Max: 79” You can see that the “box” part of the plot seems to be strongly emphasized. The size of this area is very important, and we call it the interquartile range or IQR . IQR = Q 3 – Q 1 The interquartile range, along with the range (max – min) is known as a measure of spread . 68 70 72 74 76 78 80 82 84
  • 4. 68 70 72 74 76 78 80 82 84 66 Calculate the range and the IQR for the heights of the three teams above. Discuss with the person sitting next to you what the different numbers mean, and what, if any, conclusions you can draw from them.
  • 5. Percentiles Often, you will hear about percentiles with regards to certain test scores. For example, my nephew Jacob: Is in the 75 th percentile with regards to weight for his age (8 weeks). What does this mean?
  • 6. Here are the heights (in inches) once again of last year’s Haverford College Men’s Basketball team: 70 70 71 71 72 72 72 72 73 73 76 77 77 79 79 In what percentile is a player who is 6’4”? How would you determine the height that is at the 90 th percentile for the team?
  • 7. Outliers We have discussed outliers informally in class, but we haven’t had a formal definition. One of the reasons for this is that there are many different definitions for outliers. We will now discuss just one of those definitions. Often, a statistic is considered an outlier if it lies more than a certain distance from the quartiles (either less than Q1 or greater than Q3). A commonly used criteria for that distance is 1.5 times the IQR. For the Fords (yup, that’s the nickname), were there any outliers? Min: 70” Q1: 71” Med: 72” Q3: 77” Max: 79”
  • 8.