1. Method
Participants
Sixty four male and eighty one female university students participated in this study.
There were 14% of female and 16% of male below 18 years old, 69% of female and
61% of male from 18-21 years old, 7% of female and 16% of male from 22-25 years
old, 10% of female and 8% of male at 26 years old and above included in these
survey.
Materials/Apparatus
Questionnaires and online surveys were distributed for participants to fill up their
general demographic information including their type of sleeping, how often do
people have nightmares, how many hours do people sleeps a day, if the people take
daily naps and also consisted of the gender and the ages of the participants.
Questionnaires and online surveys were used because it would produce quantifiable
and reliable data. The questionnaire and online survey had standardized answers for
the participants to choose so that it makes us easy to compile answers.
Procedure
First, a hypothesis was created to conduct the research. Research method,
questionnaires and online surveys were used for data collection. Then 100 copies of
questionnaires and around 60 copies of online survey started distributed to
participants. Participants would be informed that the research was to investigate
which gender has more problem s when/before sleeping. Participants were asked to
fill up the questionnaire that consisted general demographic information of the
participants. When the survey ended, data collection and analysis would be started.
Then the final result would be evaluated and finalized. Finally, a research report
would be produced.
1
2. Results
Among the 145 of university students participating in the questionnaire with
valid data on sleep assessment, there were 56% of the female participant and 44% of
male participant. There were 14% of female and 16% of male below 18 years old,
69% of female and 31% of male from 18-21 years old, 7% of female and 16% of male
from 22-25 years old, 10% of female and 8% of male at 26 years old and above
included in these survey.
Numbers of Participant
80%
70%
60%
50%
<18 Years Old
40%
18-22 Years Old
30%
22-25 years old
20%
>26 Years old
10%
0%
Male
Female
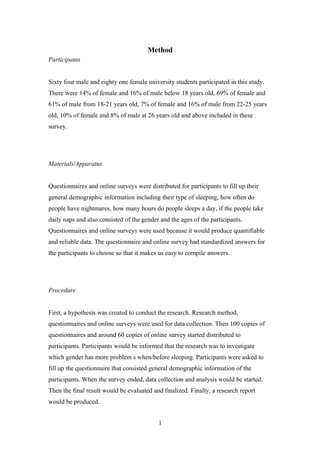
Fig 1. Shows a histogram the overall numbers of participation of the survey
through questionnaire handling and online survey.
Through Fig. 1 , it shows that the mode of the male participant category is
between the range of 18-22 years old, while the mode for female participant between
the range of 22-25 years old.
2
3. As for the frequency of nightmare, data were analyzed by using a line graph to
show the comparison between male and female.
FREQUENCY OF NIGHTMARES FROM PARTICIPANTS
60%
50%
40%
30%
Female
Male
s
n
p
i
m
F
&
l
M
f
o
g
a
t
c
r
e
P
20%
10%
0%
Everyday
Once a Week
Once a Month
Never
Frequency
Fig 2. The line graph represents the frequency of nightmares the participants of
the two sex, male & female, experienced in their sleep.
The frequency ranges are Everyday, Once a week, Once a month & Never.
There are more male who experience nightmares in their sleep everyday & once a
week compared to female. Nonetheless, there are more male who never experience
nightmares in their sleep, which has a higher difference compared to the first two
categories. The results for female participants are accumulated in the Once a Month
category which is a mode (highest point) of the graph/result.
3
4. Moreover, two types of sleeping were determined through the participants.
46% of female participant considered themselves as light sleep while 54% considered
themselves as heavy sleep. Meanwhile, 33% of male participant considered
themselves as light sleep and 67% were heavy sleep.
Fig 3. Shows 2 pie charts represents the type of sleeping of both female and male.
As for their clothing while the participants are sleeping, majority of both male
and female wear their clothes while sleeping. 72% of female wears clothes while
sleeping while 28% does not. As for the male category, 41% wears their clothes while
59% of them does not.
4
5. Fig 4. Comparison of the napping habits of male and female .
The pie charts represent the percentage of participants who answered the
question regarding daily naps. The pie charts are categorized by the answers of the
question, yes or no, separated into female and male while the people who answered
yes are represented into a larger pie chart, showing the percentage of male & female
who takes daily naps. The pie chart shows 41% of male participants take daily naps,
which is slightly more than the 37% of women. The difference of the male & female
participants who takes daily naps are small as seen in the figure, with the difference,
when combined, is only 6%.
5
6. HOURS OF SLEEP BY PARTICIPANTS
90%
80%
70%
60%
50%
Female
40%
Male
30%
m
F
/
l
M
f
o
g
a
t
n
c
r
e
P
s
p
i
20%
10%
0%
>8 hours
4-8 hours
<4 hours
Range of Time
Fig 5. Hours of sleep by participants .
Percentage of participants (%) who sleeps in the range of less than 4 hours, 48 hours & more than 8 hours for the female & male target represented in a bar graph.
There are more male who sleep at the lowest category of less than 4 hours, however,
there are also more male who sleep for more than 8 hours than female. Most of the
results for female fell into the 4-8 hours of sleep category, which is still lower than
what the human body requires.
6
7. Do you think sleep well daily?
x
e
S
Female
Yes
No
Male
0%
10%
20%
30%
40%
50%
60%
70%
80%
90%
100%
Percentage of Female/Male Participants
Fig 6. The chart shows the comparison of female and male participants that
sleeps well daily.
This chart summarizes whether if they think they are sleeping well or not. The
chart is represented in a histogram & categorizes between male & female while the xaxis represents the percentage of participants. The histogram is separated between the
answer of the question, yes or no. As seen in the figure, the line shows the difference
of the participants’ answers to the question by gradient of the line. There are more
male participants who think they are sleeping well daily compared to female
participants, however the difference is small at only 3%.
Discussions
The hypothesis is that female have more problems when or before sleeping.
7
8. Based on the research that the researchers conducted, researchers have accepted the
hypothesis, however, the difference in the results from the surveys between male &
female is small. We have accepted the hypothesis since most, although not all, of the
results from the survey questions show female to have more problems when/before
sleeping than male.
One of the questions from the survey asks the participants whether they sleep
with lights on or off. The researchers' prediction is that more female would sleep with
the lights on then male, as it would be one of the evidences that prove the researchers'
hypothesis. This is because light, from light bulbs or electronic devices causes
difficulty in sleeping because of a function in our body. The body, due to natural
traits, reacts to darkness as a time for shelter and sleep. When light is present at night,
it would not only allow to body to react wrongly, but would also suppress the
production of melatonin hormones which controls sleep and wake cycles [1], causing
disruption before sleeping & might also cause the person to easily wake up, lacking
enough sleep for the body. In the survey, 25% of female sleep with lights while there
are 17% of male who do so, this proves our prediction as true.
Two other questions from the survey relates to the temperature participants
sleep on. Referenced from online Web magazine WebMD.com [2], people who sleep
on cooler temperatures either by coolers, thermostats, or lack of clothing would affect
the comfort of their sleep. This is due to the body having difficulty on achieving a set
temperature on sleeping when it’s too cold. The two questions regarding this theory
ask whether the participants sleep with or without air-conditioner & sleep with or
without clothes. 56% of male participants sleep with air-conditioner while only 35%
of female participants sleep with air-conditioner whereas 64% of male participants
sleep with clothes while 89% of female participants sleep with clothes. This implies
that male have more problems in sleeping than female when it comes to the
temperature.
Another question from the survey asks how frequent nightmares occur towards
the female and male participants. While nightmares are already shown as a problem
when sleeping, the causes of nightmares are also problems that people face such as
8
9. sleep disorder or stress. Even though there are more male who experience nightmares
everyday and once a week compared to female, the difference is very small at 2% &
5% respectively, also taking into account that more male answered that they never
experienced nightmares. Moreover, the results for female are accumulated to the
‘Once a month’ answer (as seen in Fig 2).
The question regarding the type of sleep asks whether the participants are light
sleepers or heavy sleepers. Heavy sleepers would fall into deep sleep more easily and
would hardly react to interruptions. According to the website, Greensleep.com [3], deep
sleep is important for the human body as it has a purifying, restoring and energizing
function. Light sleepers would react to interruptions more easily such as alarm clocks
and have a higher possibility in waking up in the middle of the night than heavy
sleepers; hence, they would have a hard time reaching the deep sleep stage. Lack of
deep sleep causes tiredness, depression & weakens the immune system. Even the
causes of light sleeping are problems people face such as obstructive sleep apnea;
therefore, light sleepers experience more problems in sleeping. In the survey the
researchers had conducted, there were more female who are light sleepers while there
were more male who are heavy sleepers. This would mean female experience more
problems caused by light sleeping than male.
The researchers also asked in the survey how long, in hours, participants
would take when sleeping. Except for children (who are not conducted in the
research), teens and adults require an average of 8 hours of sleep. Obviously, when
people lack sleep, it means they have problems when sleeping (eg. depression or
anxiety) & after sleeping (eg. Excessive daytime sleepiness). In Fig 5, according to
the survey conducted, it shows that more male, at 14%, sleep less than 4 hours than
female, at 2%. However, there is also more male who sleep more than 8 hours than
female. Correspondingly, more female sleep 4-8 hours only than male, which, even
though more male sleep less than 4 hours, is still less than the required 8 hours.
When people are deprived of sleep, when not reaching the required minimum
of 8 hours, they tend to have naps daily due to their sleep rhythm problem. A question
from the survey asks whether the participants nap daily or not. It is a follow-up
question on how long the participants sleep. Fig 4 illustrates the results taken from the
9
10. question and while there is little difference at 4%, more male take naps daily than
female.
The last question was a small summary on how well the participants think they
sleep. Fig 6 in the appendices illustrates the results of the question in a horizontal
histogram and compare the result between male and female. The figure shows a small
difference but it still remains that more female participants thought that they did not
sleep well than male.
There are a few limitations in our study however, one of such, which can be
found in every research conducted by surveys, would be how bias the participants can
be. Also, the questionnaire focuses too much on the comparison between male and
female gender without taking into account their age or work rate, different
participants from different ages might have more or less work done before sleep, for
example, the students from the School of Architecture, Building & Design have more
work than the School of Tourism, hence, they have more stress & would have
difficulty in sleeping, where they might even not have time for enough sleep. The
survey is even passed online to people who might not be from within Malaysia, for
example, students from America are less busy than students from Malaysia. Another
problem when conducting the survey is the inability to control the number of male
and female to an equal, there are more female participants than male & the results are
compared by percentage, which would be inaccurate. Regarding our questionnaire,
the answers for most of the questions are ‘yes or no’; there are no answers by range of
1-5 or multiple-choice answers. Some participants also skip questions, which causes
inaccuracy when converting the total into percentage. Other types of inaccuracy
within the survey can be how unspecific the answers are, for example, people who
sleep with lights on might use blue lights, which causes more harm to the body than
red light, and the light they use might even be small.
References
Sio, U., Monaghan, P., & Ormerod, T. (2013). Sleep on it, but only if it is difficult:
Effects of sleep on problem solving. Memory & Cognition, 41(2), 159-166.
10
11. doi:10.3758/s13421-012-0256-7
Jain, V., Tomar, R., Jha, J., Pareek, A., Ratan, Y., & Paliwal, N. (2013). Sleep quality
and sleep associated problems in female pharmacy students. Chronicles Of
Young Scientists, 4(2), 138-143. doi:10.4103/2229-5186.115553
Short, M. A., Gradisar, M., Gill, J., & Camfferman, D. (2013). Identifying Adolescent
Sleep Problems. Plos ONE, 8(9), 1-6. doi:10.1371/journal.pone.0075301
SimplyPsychology.(2011)Psychology Research Report guideline. Retrieved from
http://www.simplypsychology.org/research-report.html
Oxford dictionaries website.(2014) Definition of sleep in English. Retrieved from
http://www.oxforddictionaries.com/definition/english/sleep
Sociology.(2014)Survey of questionnaire. Retrieved from
http://sociology.about.com/od/research/a/surveys.htm
Cbs Boston.(2011) study finds more women have trouble sleeping than men.
Retrieved from http://boston.cbslocal.com/2011/12/15/study-finds-morewomen-have-trouble- sleeping-than-men/
[1] Kresser, C. (2013). How artificial light is wrecking your sleep, and what to do
about it. [online] Retrieved from: http://chriskresser.com/how-artificial-lightis-wrecking-your-sleep-and-what-to-do-about-it [Accessed: 19 Jan 2014].
[2] Katheleen, D. (2010). Can’t sleep? Adjust the temperature. Webmd magazine.
[3] Greensleep.com. (n.d.). Welcome to green sleep. [Online] Retrieved from:
http://www.greensleep.com/Europe/Great-Brittain/EN/seg-belang-diepeslaap.asp [Accessed: 19 Jan 2014].
Appendix: Questionnaire
11
12. SOCIAL PSYCHOLOGY
GENERAL INSTRUCTIONS
The purpose of this survey is to study the problem of sleeping between female
and male. This questionnaire is voluntary and the data that collected are
strictly confidential. All participant will not be identified. Your voluntary
agree to participate in this research project by filling the following questions
You have the right to reject your participation. You may withdraw from this
research anytime you wish.
Read the items thoroughly. This questionnaire consist of 2 pages. Please tick
your response in the box as your response.
QUESTIONS
1. How old are you?
Below 18 years old
18-21 years old
22-25 years old
26 and above
2. What is your sex?
Male
Female
3. Which school do you come from?
School of Architecture, Building and Design
School of Computing and IT
12
13. School of Engineering
The Design School
Others :_____________________________________
4. Do you often sleep with light on?
Yes
No
5. Do you sleep with air conditional on?
Yes
No
Depend on situation
6. Do you have nightmares?
Everyday
Once a week
Once a month
Never
7. What is your type of sleeping?
Light sleep - one easily wakened
Heavy sleep - a person who sleeps deeply and is difficult to wake up
8. Do you wear clothes while sleeping?
13
14. Yes
No
Depend on situation
9. Do you nap daily?
Yes
No
10. How many hours that you sleep in a day?
More than 8 hours
4 - 8 hours
Less than 4 hours
11. Do you think you sleep well daily?
Yes
No
END OF THE QUESTIONNAIRE
THANKS FOR YOUR PARTICIPATION
Appendix B : Raw Data
14
15. Fig 1. Shows a histogram the overall numbers of participation of the survey
through questionnaire handling and online survey.
FREQUENCY OF NIGHTMARES FROM
PARTICIPANTS
15
17. Fig 3. Shows 2 pie charts represents the type of sleeping of both female and male.
Fig 4. Comparison of the napping habits of male and female .
17
18. HOURS OF SLEEP BY PARTICIPANTS
90%
80%
70%
60%
50%
40%
Female
Male
30%
s
p
i
m
F
/
l
o
g
a
t
n
c
r
e
P
M
f
20%
10%
0%
>8 hours
4-8 hours
Range of Time
Fig 5. Hours of sleep by participants .
18
<4 hours
19. Do you think sleep well daily?
x
e
S
Female
Yes
No
Male
0%
10%
20%
30%
40%
50%
60%
70%
80%
90%
100%
Percentage of Female/Male Participants
Fig 6. The chart shows the comparison of female and male participants that
sleeps well daily.
19
20. Appendix C: Calculation of Data
Results of questionnaire Calculation in Percentage (%) (online survey)
FEMALE
MALE
Q1 how old are you? 1=below 18 , 2=18-21 , 3=22-25 , 4=26 above
Q1 how old are you? 1=below 18 , 2=18-21 , 3=22-25 , 4=26 above
Q1
answer
1
2
3
4
total
N
3
34
5
2
44
percent
7%
77%
11%
5%
100%
Q1
Q2 do you often sleep with light on? 1=yes , 2=no
Q2
answer
1
2
total
n
9
35
44
ans
1
2
3
total
n
13
10
21
44
percent
20%
80%
100%
Q2
ans
1
2
3
4
total
n
3
13
23
5
44
percent
30%
23%
47%
100%
Q3
ans
1
2
total
n
23
21
44
percent
7%
30%
52%
11%
100%
Q4
ans
1
2
3
total
n
39
0
5
44
percent
52%
48%
100%
Q5
ans
1
2
total
n
16
28
44
percent
89%
0%
11%
100%
Q6
ans
1
2
3
total
n
12
32
0
44
percent
36%
64%
100%
Q7
ans
1
2
total
n
26
18
44
n
14
2
8
24
percent
58%
8%
33%
100%
ans
1
2
3
4
total
n
2
10
7
5
24
percent
8%
42%
29%
21%
100%
ans
1
2
total
n
11
13
24
percent
46%
54%
100%
ans
1
2
3
total
n
16
1
7
24
percent
67%
4%
29%
100%
ans
1
2
total
n
9
15
24
percent
38%
63%
100%
Q8 how many hours that’s you sleep in a day? 1=more than 8 , 4-8 , less than 4
percent
27%
73%
0%
100%
Q8
Q9 do u think u sleep well daily? 1=yes , 2=no
Q9
ans
1
2
3
total
Q7 do u nap daily? 1=yes , 2=no
Q8 how many hours that’s you sleep in a day? 1=more than 8 , 4-8 , less than 4
Q8
percent
8%
92%
100%
Q6 do u wear cloth while sleeping? 1=yes , 2=no , 3=depend on situation
Q7 do u nap daily? 1=yes , 2=no
Q7
n
2
22
24
Q5 what is ur types of sleep? 1=light sleep , 2=heavy sleep
Q6 do u wear cloth while sleeping? 1=yes , 2=no , 3=depend on situation
Q6
answer
1
2
total
Q4 do u have nightmares? 1=everyday , 2=once a week , 3=once a month, 4= never
Q5 what is ur types of sleep? 1=light sleep , 2=heavy sleep
Q5
percent
17%
62%
17%
4%
100%
Q3 do you sleep with air-con on? 1=yes ,2=no , 3=depend on situation
Q4 do u have nightmares? 1=everyday , 2=once a week , 3=once a month, 4= never
Q4
N
4
15
4
1
24
Q2 do you often sleep with light on? 1=yes , 2=no
Q3 do you sleep with air-con on? 1=yes ,2=no , 3=depend on situation
Q3
answer
1
2
3
4
total
ans
1
2
3
total
n
7
15
2
24
percent
29%
63%
8%
100%
Q9 do u think u sleep well daily? 1=yes , 2=no
percent
59%
41%
100%
Q9
20
ans
1
2
total
n
14
10
24
percent
58%
42%
100%
21. Results of questionnaire calculation in percentage (%) (survey form)
Female
Male
Q1 how old are you? 1=below 18 , 2=18-21 , 3=22-25 , 4=26 above
Q1
ans
1
2
3
4
total
n
8
22
1
6
37
percent
22%
59%
3%
16%
100%
Q1
Q2 do you often sleep with light on? 1=yes , 2=no
Q2
ans
1
2
total
n
11
26
37
ans
1
2
3
total
n
15
8
14
37
percent
30%
70%
100%
Q2
ans
1
2
3
4
total
n
0
8
22
7
37
percent
41%
22%
38%
100%
Q3
percent
0
22%
59%
19%
100%
ans
1
2
total
n
23
14
37
ans
1
2
3
total
n
33
1
3
37
percent
62%
38%
100%
Q5
ans
1
2
total
n
14
23
37
percent
89%
3%
8%
100%
Q6
ans
1
2
3
total
n
4
31
2
37
percent
38%
62%
100%
Q7
ans
1
2
total
n
16
21
37
n
22
9
9
40
percent
55%
23%
23%
100%
ans
1
2
3
4
total
n
2
10
16
12
40
percent
5%
25%
40%
30%
100%
ans
1
2
total
n
22
18
40
percent
55%
45%
100%
ans
1
2
3
total
n
25
8
7
40
percent
63%
20%
18%
100%
ans
1
2
total
n
17
23
40
percent
43%
58%
100%
Q8 how many hours that’s you sleep in a day? 1=more than 8 , 4-8 , less than 4
percent
11%
84%
5%
100%
Q8
Q9 do you think you sleep well daily? 1=yes, 2=no
Q9
ans
1
2
3
total
Q7 do you nap daily? 1=yes , 2=no
Q8 how many hours that’s you sleep in a day? 1=more than 8 , 2=4-8 , 3=less than 4
Q8
percent
23%
78%
100%
Q6 do you wear cloth while sleeping? 1=yes , 2=no , 3=depend on situation
Q7 do you nap daily? 1=yes , 2=no
Q7
n
9
31
40
Q5 what is your types of sleep? 1=light sleep , 2=heavy sleep
Q6 do you wear cloth while you are sleeping? 1=yes, 2=no , 3=depend on situation
Q6
answer
1
2
total
Q4 do you have nightmares? 1=everyday , 2=once a week , 3=once a month, 4= never
Q4
Q5 what is your types of sleep? 1=light sleep , 2=heavy sleep
Q5
percent
15%
60%
15%
10%
100%
Q3 do you sleep with air-con on? 1=yes ,2=no , 3=depend on situation
Q4 do you have nightmares? 1=everyday , 2=once a week , 3=once a month , 4=never
Q4
N
6
24
6
4
40
Q2 do you often sleep with light on? 1=yes , 2=no
Q3 do you sleep with air-con on? 1=yes , 2=no , 3=depend on situation
Q3
answer
1
2
3
4
total
ans
1
2
3
total
n
13
20
7
40
percent
33%
50%
18%
100%
Q9 do you think you sleep well daily? 1=yes , 2=no
percent
43%
57%
100%
Q9
21
ans
1
2
total
n
21
19
40
percent
53%
48%
100%
22. Results of Overall Calculation of Percentage (%) (Online Survey + Normal
Survey)
Female
Male
Q1 how old are you? 1=below 18 , 2=18-21 , 3=22-25 , 4=26 above
Q1 how old are you? 1=below 18 , 2=18-21 , 3=22-25 , 4=26 above
Q1
ans
1
2
3
4
total
n
11
56
6
8
81
percent
14%
69%
7%
10%
100%
Q2 do you often sleep with light on? 1=yes , 2=no
Q2
ans
1
2
total
n
20
61
81
percent
25%
75%
100%
Q3 do you sleep with air-con on? 1=yes , 2=no , 3=depend on situation
Q3
ans
1
2
3
total
n
28
18
35
81
percent
35%
22%
43%
100%
Q1
answer
1
2
3
4
total
N
10
39
10
5
64
percent
16%
61%
16%
8%
100%
Q2 do you often sleep with light on? 1=yes , 2=no
Q2
answer
1
2
total
n
11
53
64
percent
17%
83%
100%
Q3 do you sleep with air-con on? 1=yes ,2=no , 3=depend on situation
Q3
ans
1
2
3
total
n
36
11
17
64
percent
56%
17%
27%
100%
Q4 do you have nightmares? 1=everyday , 2=once a week , 3=once a month Q4 do you have nightmares? 1=everyday , 2=once a week , 3=once a month, 4= never
, 4=never
Q4
ans
1
2
3
4
total
n
3
21
45
12
81
percent
4%
26%
56%
15%
100%
Q5 what is your types of sleep? 1=light sleep , 2=heavy sleep
Q5
ans
1
2
total
n
46
35
81
percent
57%
43%
100%
Q4
ans
1
2
3
4
total
n
4
20
23
17
64
percent
6%
31%
36%
27%
100%
Q5 what is your types of sleep? 1=light sleep , 2=heavy sleep
Q5
ans
1
2
total
n
33
31
64
percent
52%
48%
100%
Q6 do you wear cloth while you are sleeping? 1=yes, 2=no , 3=depend on situationyou wear cloth while sleeping? 1=yes , 2=no , 3=depend on situation
Q6 do
Q6
ans
1
2
3
total
n
72
1
8
81
percent
89%
1%
10%
100%
Q7 do you nap daily? 1=yes , 2=no
Q7
ans
1
2
total
n
30
51
81
percent
37%
63%
100%
Q6
ans
1
2
3
total
n
41
9
14
64
percent
64%
14%
22%
100%
Q7 do you nap daily? 1=yes , 2=no
Q7
ans
1
2
total
n
26
38
64
percent
41%
59%
100%
Q8 how many hours that’s you sleep in a day? 1=more than 8 , 2=4-8 , 3=less than 4many hours that’s you sleep in a day? 1=more than 8 , 4-8 , less than 4
Q8 how
Q8
ans
1
2
3
total
n
16
63
2
81
percent
20%
78%
2%
100%
Q9 do you think you sleep well daily? 1=yes, 2=no
Q9
ans
1
2
total
n
42
39
81
percent
52%
48%
100%
Q8
ans
1
2
3
total
n
20
35
9
64
percent
31%
55%
14%
100%
Q9 do you think you sleep well daily? 1=yes , 2=no
Q9
22
ans
1
2
total
n
35
29
64
percent
55%
45%
100%