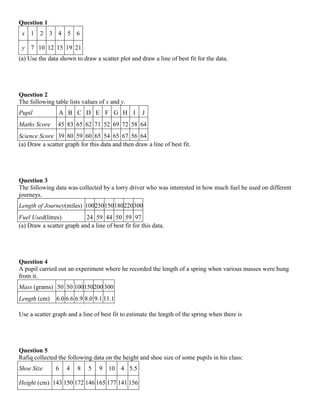
1. Question 1
x 1 2 3 4 5 6
y 7 10 12 15 19 21
(a) Use the data shown to draw a scatter plot and draw a line of best fit for the data.
Question 2
The following table lists values of x and y.
Pupil
A B C D E F G H I
J
Maths Score
45 83 65 62 71 52 69 72 58 64
Science Score 39 80 59 60 65 54 65 67 56 64
(a) Draw a scatter graph for this data and then draw a line of best fit.
Question 3
The following data was collected by a lorry driver who was interested in how much fuel he used on different
journeys.
Length of Journey(miles) 100 250 150 180 220 300
Fuel Used(litres)
24 59 44 50 59 97
(a) Draw a scatter graph and a line of best fit for this data.
Question 4
A pupil carried out an experiment where he recorded the length of a spring when various masses were hung
from it.
Mass (grams) 50 50 100 150 200 300
Length (cm)
6.0 6.6 6.9 8.0 9.1 11.1
Use a scatter graph and a line of best fit to estimate the length of the spring when there is
Question 5
Rafiq collected the following data on the height and shoe size of some pupils in his class:
Shoe Size
6
4
8
5
9 10 4 5.5
Height (cm) 143 150 172 146 165 177 141 156