SlideShare a Scribd company logo
1 of 110
Download to read offline
Engineering the Policy-making Life Cycle
Deliverable 2.1:
Decision Support System Requirements
Document type: Deliverable
Dissemination Level: Public
Editor: Michela Milano
Document Version: 1.0
Contributing Partners: All
Contributing WPs: WP2
Estimated P/M (if applicable): n.a.
Date of Completion: 31st of July 2012
Date of Delivery to EC 31st of July 2012
Number of pages: 110
ABSTRACT
The aim of this document is to define the requirements of a Decision Support System (DSS) able to support
decision makers in the regional planning activity. We first identify common features of different regional
plans and define common, general requirements. From the latter, we identify general inputs and outputs
that will characterize the core of the DSS for regional planning.
Secondly as this project is focussed on the Regional Energy plan, we will use this as an example of these
general requirements applied to a specific plan. These requirements stem from a detailed analysis of a set of
plans of the Emilia Romagna Region: the Regional Energy Plan, the Transportation Plan, and the Regional
Operational Program. Despite very different in nature and in the contained details, these three plans have
a common structure and a set of common features. Thus, it is possible to design a general system that can
be instantiated on specific plans on a later moment.
In this setting, the policy making process should be at the same time (a) consistent with constraints; (b)
optimal with respect to given objectives; and (c) assessed to avoid negative impacts on the environment,
economy and society. In this document we identify the main ingredients that a Decision Support System
has to take into account when aiding the policy maker in his decision process.
The project is co-funded by the European Community under the Information and Communication Technologies
(ICT) theme of the Seventh Framework Programme (FP7/2007-2013). Grant Agreement n◦288147.
Authors of this document:
ALL PARTNERS
http://www.epolicy-project.eu/
Copyright c by the ePolicy Consortium
The ePolicy Consortium consists of the following partners: University of Bologna; University College Cork, National University
Ireland, Cork; University of Surrey; INESC Porto, Instituto de Engenharia de Sistemas e Computadores do Porto, Fraunhofer –
Gesellschaft zur Foerderung der Angewandten Forschung E.V.; Regione Emila-Romagna; ASTER – Società Consortile per Azioni;
Università degli Studi di Ferrara.
Possible inaccuracies of information are under the responsibility of the project team. The text reflects solely the views of its authors.
The European Commission is not liable for any use that may be made of the information contained therein.
Contents
1 Introduction 5
2 Regional Planning and Impact Assessment 6
2.1 The Regional Plan . . . . . . . . . . . . . . . . . . . . . . . . . . . . . . . . . 6
2.2 The Strategic Environmental Assessment . . . . . . . . . . . . . . . . . . . 9
2.3 The Regional Energy Plan . . . . . . . . . . . . . . . . . . . . . . . . . . . . 10
2.4 The Transportation Plan . . . . . . . . . . . . . . . . . . . . . . . . . . . . . 12
2.5 The Regional Operational Programme . . . . . . . . . . . . . . . . . . . . . 15
3 Decision Support System Requirements 17
3.1 Expected Outputs . . . . . . . . . . . . . . . . . . . . . . . . . . . . . . . . . 18
3.2 Requirements for the Global Optimization component . . . . . . . . . . . . 19
3.2.1 Inputs related to the activities . . . . . . . . . . . . . . . . . . . . . . 19
3.2.2 Inputs related to the impacts . . . . . . . . . . . . . . . . . . . . . . 19
3.2.3 Inputs linked to the regional objectives . . . . . . . . . . . . . . . . 20
3.2.4 Inputs related to socio-geographical aspects and best practices . . . 20
3.3 Requirements for the ePolicy Social Simulation component . . . . . . . . . 21
3.3.1 Connection to Global Level Optimization . . . . . . . . . . . . . . . 21
3.3.2 Connection to Visual Analytics . . . . . . . . . . . . . . . . . . . . . 22
3.3.3 Connection to Game Theory Interaction . . . . . . . . . . . . . . . . 23
3.3.4 Data-Formats of In- and Output . . . . . . . . . . . . . . . . . . . . 23
3.4 Requirements for the Opinion Mining component . . . . . . . . . . . . . . 25
3.4.1 The Inference Module . . . . . . . . . . . . . . . . . . . . . . . . . . 26
3.4.2 The Learning Module . . . . . . . . . . . . . . . . . . . . . . . . . . 26
3.5 Requirements for the Visualization component . . . . . . . . . . . . . . . . 27
3.5.1 Connection to Optimization component . . . . . . . . . . . . . . . . 27
3.5.2 Connection to Agent-based Simulation component . . . . . . . . . 28
3.5.3 Connection to Opinion Mining component . . . . . . . . . . . . . . 28
4 Requirement instantiation for the Regional Energy Plan 28
4.1 Outputs . . . . . . . . . . . . . . . . . . . . . . . . . . . . . . . . . . . . . . . 28
4.2 Inputs for a DSS . . . . . . . . . . . . . . . . . . . . . . . . . . . . . . . . . . 29
4.2.1 Inputs related to the activities . . . . . . . . . . . . . . . . . . . . . . 30
4.2.2 Inputs related to the impacts . . . . . . . . . . . . . . . . . . . . . . 30
4.2.3 Inputs linked to the regional objectives . . . . . . . . . . . . . . . . 31
4.2.4 Inputs related to socio-geographical aspects and best practices . . . 31
5 Use case scenario #1: the RER energy plan 2011-2013 32
6 Use case scenario #2: an “extended” energy plan 33
A The Primary-Secondary Activities Matrix 37
3
B The coaxial matrices 50
4
1 Introduction
Regional planning is the science of the efficient placement of land use activities and in-
frastructures for the sustainable growth of a region. Regional plans are classified into
types, such as Agriculture, Forest, Fishing, Energy, Industry, Transport, Waste, Water,
Telecommunication, Tourism, Urban and Environmental plans, to name a few.
Each plan defines a set of activities that should be carried out to obtain specific objectives.
They greatly differ from each other about the objectives and the type of activities, and
often they define plans at a different granularity of details. Despite such differences,
regional plans share some common characteristics that foster for a uniform treatment in
terms of requirements of a Decision Support System (DSS).
Roughly speaking, Regional Plans are organized as follows:
• Existing situation and previous plan analysis
The first step of a regional plan deeply analyses the existing situation and results of
previous plans on the same topic. Environmental, social, and economic aspects are
considered, and the results of implementation instruments adopted in the past are
identified and evaluated.
• Objectives and Strategies
On the basis of the existing situation, the main objectives and strategies to be reached
are identified. Objectives can be derived from EU and national guidelines, exist-
ing rules and norms, opinions from citizens and stakeholder participation, regional
goals and specific needs. Ex ante evaluation plays a role in this phase.
• Priorities and intervention lines
To achieve the objectives, the regional plan identifies intervention lines and priori-
ties. E.g., the region might decide to invest on industrial research and technology
transfer, on renewable energy sources, on land use qualification, etc. Usually, the
plans refer to the concept of axis, to indicate different application fields. For each axis
specific objectives and activities are identified and planned, and budget is allocated.
This is the decisional part of the plan and contains a resource allocation component
that is aimed at achieving the objectives by satisfying specific constraints.
• Implementation and Monitoring:
To foster the objectives identified at the previous step, the Region should define
implementation instruments. We can group instruments into four big classes:
– regulatory, such as self-regulation by voluntary bodies, or standards imposed
by formal standards bodies and legislation;
– economic, such as taxes, fees and user-charges, certificate trading, procurement
policies, subsidies;
– cooperation, such as voluntary agreements, producer and consumer associa-
tions;
– information, such as labelling schemes, reporting requirements, advice ser-
vices and technology transfer.
When devising a regional plan, the policy maker has to take into account impacts on
the environment, on the economy and on the society. Currently the procedure aimed to
5
assess the impacts of a Regional Plan is called Strategic Environmental Assessment [4], and
it relates activities defined in the plan to environmental and economic impacts.
For example, in the Emilia Romagna Region such assessment procedure is manually im-
plemented by environmental experts to check the effects of a given plan or programme.
Currently, the impacts evaluation is not applied during the plan/program construction.
Rather, it is performed on a given, already instantiated plan. Such approach has a major
drawback: taking into account impacts a posteriori enables only corrective interventions
that aims to reduce negative effects of one or more wrong planning decisions. Clearly,
prevention of negative effects is more desirable than corrective actions applied to already
executing plans.
The ePolicy project aims to identify general aspects of the Regional Planning activity,
namely constraints, impacts, objectives and guidelines that will constitute the Deliverable
2.2. Here we report the initial stage of this global study to identify the main requirements
of a decision support system supporting policy makers in their decision making activity.
Therefore, this deliverable contains a first preliminary description of the regional plan-
ning activity, together with some examples taken from the Regional Energy plans, the
Transportation plans and the Operational program (being the last a sort of a meta-plan
that regulates resource allocation for other plans). Then, we consider the requirements
of the decision support system, that is the decision making component of the ePolicy
project. To aid the decision support system, other components are needed, namely: the
opinion mining component, that provides ex-ante evaluation of the policy domain from
e-participation; the simulation component, that provides the social response to different
policy instruments; and the visualization techniques, that provide an intuitive interface
for non IT-experts. The requirements for all these components are considered and de-
scribed.
2 Regional Planning and Impact Assessment
2.1 The Regional Plan
The Regional Plan is the main result of the policy making activities European regions are
involved in. Each region has a budget distributed by the Operational Programme (OP):
an OP sets out each region priorities for delivering the funds. On the basis of these funds,
each region has to define its priorities: e.g., a priority in the energy field is to increase the
use of renewable energy sources. Once priorities have been identified, a region should
decide which activities to insert in the plan. Activities may be roughly divided into six
types:
(1) infrastructures and plants;
(2) buildings and land use transformations;
(3) resources extraction;
(4) modifications of hydraulic regimes;
(5) industrial transformations;
(6) environmental management.
6
Also, a magnitude for each activity is decided, describing how much of a given activity
is performed.
In the case of the Energy Plan, possible activities are energy plants, and their expected
outcomes are quantity of energy produced. In case of the Traffic Plan, possible activities
are road constructions, while some of their outcomes are congestion reduction in specific
areas, or pollutant emission reduction.
Regional plans are in general organized with four big chapters:
• Part 1: Existing situation and previous plans
The current regional situation is analysed and previous plans are considered.
For example the regional energy plan REP [3] considers the current energy pro-
duction and the current energy consumption in various sectors, namely mobility,
households, enterprises, and services. This is called Regional Energy Balance and
constitutes the preliminary chapter of the REP. Then, environmental impacts of the
current situation are considered in terms of air/water pollutants, impacts on the
landscape and other environmental indicators. Social and economic impacts are
also considered, for example when a plan affects the creation of employment, pop-
ulation wealth, or the technology transfer from research to business.
Beside the current situation, also previous plans are considered. Basically, an analy-
sis is performed to establish if previous decisions/plans have achieved the desired
effects. Such analysis represents a sort of ex-post evaluation and provides useful
feedbacks for the current planning activity.
• Part 2: Objectives and Strategies
On the basis of the existing situation, the main objectives to be achieved are identi-
fied. In order to get consistent plans, regional objectives must be identified within a
national and European perspective, and they should be compliant with norms and
objectives identified at higher decision levels. In this step, the ex-ante evaluation
from citizens and stakeholders participation plays an important role. Traditionally,
the outcomes of physical meetings of policy makers with stakeholders are collected
and taken into account. From both the global and the individual perspectives the
main objectives of the plan arise in this stage. Moreover, it is already possible to
devise a high level strategic plan, although not fully specified and yet in its initial
status.
• Part 3: Priorities and intervention lines
On the basis of the current situation and to achieve the objectives and the strategic
directions previously identified, the regional planners identify intervention lines
and priorities. For instance the region might decide to invest on industrial research
and technology transfer, on renewable energy sources, on land use qualification,
etc. For each axes specific objectives, activities and allocated budget are identified
and planned. This is the decisional part of the plan: usually it contains a resource
allocation component that aims to achieve the objectives by satisfying specific con-
straints. For example, the regional energy plan REP contains 8 axes of interven-
tion, namely: (1) Development of a regional energy-related research and education
7
infrastructure; (2) Development of the green economy and productive system ri-
qualification; (3) Development and energy quality improvement of agricultural sec-
tor; (4) Building and urban energy quality improvement qualification; (5) Sustain-
able mobility; (6) Rules and norms; (7) Local programs, information and commu-
nication; (8)Technical assistance and partnership. Recursively, for each axis specific
objectives are identified, activities are planned and budget is allocated.
• Part 4: Implementation and Monitoring
To foster the activities identified at the previous step, the Region should define im-
plementation instruments. We can group instruments into four big classes: regula-
tory, economic, cooperation, and information.
In this deliverable we are interested in identifying requirements for the decision support
system. Therefore, we consider as DSS inputs the results of Parts 1 and 2, while Part 3
and (a subset of) Part 4 are taken to be the core output of the decision strategy we will im-
plement. Indeed, the DSS should provide the third part of the regional plan by deciding
activities and budget allocation. It should also define implementation strategies that are
usually tackled in Part 4.
In each plan we consider activities. Each activity ai (i = 1..Na) (where Na is the total
number of considered activities) has an outcome Out = (out1, . . . , outNa ) and a C =
(c1, . . . , cNa ) vectors where each element is associated to a specific activity and represents
the outcome and cost per unit of activity, respectively.
Activities are divided into primary and secondary activities. Primary activities are those
inserted in the plan since they produce an outcome and partially reach one (or more)
objective. For example, in the Regional Energy Plan, the primary activities are energy
plans producing as outcome a certain amount of energy. In the Transportation plan, the
primary activity is the improvement of public transports that produces as outcome a re-
duction on the use of private vehicles (and consequently a reduction in greenhouse gas
emissions). Secondary activities are those that are needed to support primary activities
but do not produce a measurable outcome that affects the objectives of the regional plan.
Secondary activities are considered since they impacts the environment (and also on so-
cial and econocmi aspects), and they have a cost.
The cost can be either a cost for the public body (say the Region), or a cost for private
bodies (enterprises and citizens). For example, if the regional plan envisages some activ-
ities to improve the Ravenna port1
, funds should be most probably found in the regional
budget. On the contrary, if the action is to improve the production of electric energy by
using photovoltaic, then private citizens and enterprises might be the main players for
implementing this objective. In the latter case a region can only look for implementation
strategies that drive citizens and enterprise to invest into renewable energy sources, and
Photovoltaics in particular.
There are constraints linking primary and secondary activities: for instance if a regional
plan decides to build three biomass power plants (primary activities for an energy plan),
1
Ravenna is a city in the Emilia Romagna Region, placed few kilometres from the Adriatic sea
8
each of these plants should be equipped with proper infrastructures (streets, sewage or
possibly a small village nearby, power lines), also called secondary activities for an energy
plan. Associated to activities we have a matrix of dependencies between activities. In
particular we have a Na × Na square matrix D where each element dij represents the
magnitude of activity j per unit of activity i.
Example 1 Let us consider the Emilia-Romagna Regional Energy Plan approved in 2007. Such
plan was the outcome of the policy making process. Among many objectives and requirements,
policy makers were requested to provide a plan such that: (1) it ensures the production of a given
amount of energy (400 additional MW from renewable energy sources); (2) it reduces the current
greenhouse gas emission percentage by 6.5% with respect to 2003 values; (3) budget constraint
limits the amount of money allocated to the energy plan by the Regional Operational Programme
to e 30.5M (for 2007).
2.2 The Strategic Environmental Assessment
The policy maker has to take into account impacts on the environment, on the economy,
and on the society, on the basis of a Strategic Environmental Assessment (SEA). The SEA
relates activities defined in a plan to environmental and economic impacts, providing an
evaluation of how (and how much) a plan affects such aspects.
Different solutions and tools have been used to perform the SEA. Among many, we con-
sider here a state-of-the-art methodology adopted within the region Emilia-Romagna.
This methodology is based on coaxial matrices [1], and it has been developed from the
“network method” [5].
In this methodology, each activity affects the environment in terms of positive and neg-
ative pressures: an example of positive pressure is the increased availability of energy,
while a negative pressure is the production of pollutants. Pressures are themselves linked
to environmental receptors such as the quality of the air, or the quality of the surface wa-
ter. On both pressures and receptors, there are constraints: e.g., a constraint limits the
maximum amount of greenhouse gas emissions of the overall plan.
A matrix M defines the dependencies between the above mentioned activities contained
in a plan and positive and negative pressures on the environment. Each element mij of
the matrix M defines a qualitative dependency between the activity i and the negative or
positive impact j. The dependency can be high, medium, low or null. Examples of nega-
tive impacts are energy/water/land consumption, variation of water flows, water and air
pollution, etc. Examples of positive impacts are reduction of water/air pollution, reduc-
tion of greenhouse gas emission, reduction of noise, natural resources savings, creation
of new ecosystems, etc.
A second matrix N defines how the impacts/pressures influence environmental receptors.
Each element nij of the matrix N defines a qualitative dependency between the negative
or positive impact i and an environmental receptor j. Again the dependency can be high,
medium, low or null. Examples of environmental receptors are the quality of surface water
and groundwater, quality of landscapes, energy availability, wildlife wellness.
9
The matrices M and N currently used in Emilia Romagna are reported in Appendix I.
These matrices have been defined by ARPA Emilia Romagna, a member of the Advisory
and Dissemination Board of the ePolicy project and have been studied and refined by
UNIBO and UNIFE with ARPA experts. This has been a long process as the number of
activities and receptor is high.
Example 2 The matrices currently used by ARPA for the SEA for the region Emilia-Romagna
contain 93 activities, 29 negative impacts, 19 positive impacts and 23 receptors and assess 11
types of plans. Such matrices are used to evaluate how primary activities affect receptors, taking
into account also secondary activities needed by primary ones (as specified by a 93×93 matrix D).
The evaluation of how secondary activities affect receptors does take into account also the fact that
some secondary activities are needed during the implementation of the primary ones, while others
are needed during the functioning of primary activities.
Regional Planning and Environmental Assessment are tightly related activities. Despite
this strict relation, current practices often consider them as two separate steps, performed
sequentially. More precisely, there are a number of issues:
1. to the best of our knowledge, the regional planning activities are usually carried
out by human experts. The activity of building a single plan to achieve regional
objectives, taking into consideration national and EU guidelines, is performed by
humans, and no computer based techniques are exploited.
2. Once a plan has been devised (and only after that), a Strategical Environmental As-
sessment is performed by the agency for environmental protection. The assessment
evaluates if the devised plan is environmentally friendly or not, and it does not pro-
vide feedback on the plan. I.e., the SEA is not intended for changing the plan, but
rather to only provide some “quality score” about it. In rare cases, the SEA can
propose corrective countermeasures, whose only result is to mitigate the negative
impact of wrong planning decisions.
3. Although European and national regulations state that a significant environmen-
tal assessment should compare two or more options (different plans), this is rarely
done, in Italy as well as in Europe [1].
ePolicy firmly advocates the needs for exploiting the Strategic Environmental Assessment
during the planning activity. The aim is to devise plans that already minimise (maximise)
negative (positive, respectively) impacts over the receptors.
2.3 The Regional Energy Plan
In 2011 the Emilia Romagna Region (RER) has assembled a Regional Energy Plan (REP).
The plan has been devised considering a short term horizon (expectations for year 2013),
as well as a long term horizon (forecast for year 2020). The plan has been defined accord-
ing to a 4-step process:
• Evaluation of current situation and trends, and projection of future energy demands
for the area.
• Formulation of objectives and policies to guide the region toward the goal of an
energy-efficient future.
10
• Evaluation of options for meeting identified demands; followed by the selection of
a flexible “portfolio” of preferred resources for meeting the energy needs.
• Design of a short-range plan of specific actions, meant to be the first steps toward
the 2020 objective.
A vast citizen engagement activity has been conducted by RER and, to some extent, citizen
and stakeholder opinions have been acknowledged by the policy makers. The analysis of
the current situation has been done on data coming from the last monitoring, performed
in 2010. Policy makers have identified eight intervention axis:
(a) Development of a regional energy-related research and education infrastructure:
this objective is aimed at nurturing the research activity and technology transfer
in energy-related fields, to the end of promoting “green economy”. Enabling tech-
nologies, products innovation, enabling procedures for energy efficiency and saving
should be taken into account. Roughly speaking, the idea is to create a high tech-
nology network merging research oriented enterprises.
(b) Development of the green economy and productive system re-qualification: an
industrial strategy based on sustainability concepts should aim to promote the Emilia
Romagna land use. The specific goals in this context are (1) the increase of energetic-
environmental sustainability indicators through an increased productive cycle effi-
ciency, the use of renewable sources and the management of resources and pro-
duction waste residuals; and (2) the encouragement of best practices of enterprises,
and the exploitation of the environment and landscape, with particular attention to
tourism-appealing areas.
(c) Development and energetic qualification of the agricultural sector: the agricul-
ture sector has a great impact on the energy production for what concerns both
biomasses and photovoltaic. The plan should increase the use of agriculture and
zootechny waste, and it should promote the use of photovoltaic on agricultural
lands via informative campaigns and via the simplification of the bureaucratic pro-
cedures.
(d) Buildings and urban energetic qualification: the objective is to drastically reduce
the energetic needs of new and renewed buildings, and to promote the energy effi-
ciency interventions in all buildings.
(e) Sustainable mobility: mobility plays an important role in the energy sector. The
REP acknowledges the core objectives of the Regional Transportation plan (see Sec-
tion 2.4).
(f) Rules and norms: the energy sector is rapidly changing; moreover, the field is reg-
ulated by rules and norms coming from different government levels (EU, National,
and Regional levels). As a consequence, the whole field regulation is not clear about
some aspects (if not inconsistent). In turn, this make it difficult for energy sector
players to take decisions and to operate. One aim of the Regional Energy Plan is
to promote collaboration between normative bodies and energy sector operators to
identify the critical issues. As a concrete activity, the plan envisage the creation of a
repository containing all the norms and rules; such repository would be accessible
by all the involved parties.
11
Power 2010 Power 2013 Energy 2013 Inv. 2013 Power 2020 Energy 2020 Inv. 2020
Electrical power plants (MW) (MW) (kTOE) (Me)
Hydroelectric 300 310 69.3 84 330 73.8 204
Photovoltaic 230 850 87.7 2170 2500 258.0 7945
Thermodyn. solar pow. 0 10 1 45 30 3.1 135
Wind generators 20 80 10.3 120 300 38.7 568
Biomasses 430 600 361.2 595 1900 1143.8 5145
Total 980 1850 529.5 3014 5060 1517,4 13989
Table 1: Energy plan developed by the region’s experts for 2011-2013 with a long term
objective at 2020
(g) Local programs, information and communication: the aim of this axis is to support
activities that enable the diffusion of a novel culture about rational and sustainable
use of energy, and for renewable energy source awareness. Informative campaigns
are needed to increase the awareness of the importance of best practices in the use
of energy.
(h) Technical assistance and partnership: the plan promotes an infrastructure for mon-
itoring, assessing and managing regional energy policies.
An example of output for what concerns renewable energy sources is the following.
Example 3 (RER Energy Plan 2011-2013) An excerpt of the Energy Plan of Region Emilia
Romagna is shown in Table 1. For each of the energy sources, the plan provides:
• the currently installed power, in MW, as of 2010;
• the forecast/required installed power for 2013, in MW;
• the total energy produced in a year, in kTOE (TOE stands for Tonnes of Oil Equivalent), for
2013;
• the total, cumulative cost, in Me, required to be invested (by the private sector, industry,
government, etc.) to reach the desired production in 2013;
• the forecast/required installed power for 2020, in MW;
• the total energy produced in a year, in kTOE (TOE stands for Tonnes of Oil Equivalent), for
2020;
• the total cost, in eM, required to be invested (by the private sector, industry, government,
etc.) to reach the desired production in 2020;
2.4 The Transportation Plan
The Transportation Plan is a long term plan headed towards the year 2020. Like other
plans, it has been prepared by assessing the current situation, by identifying the main
goals, and by deciding a bunch of options for meeting the future, forecast demands.
The current situation has been analysed as of 2008, headed to year 2020 with an interme-
diate scenario at 2015. The main goals have been identified as being:
• to guarantee high accessibility levels, to both people and goods; subsequently, to
increase local industries competitiveness and to attract external investments;
• to assure high security standards;
12
• to guarantee an efficient and effective use of public funds for services and infras-
tructures;
• to increase life quality within cities and other urban territories;
• to achieve a sustainable development of transportation, by reducing energy con-
sumption, pollutant emission and local impacts;
• to guarantee public transport access to economically disadvantaged population;
• to promote citizens participation in the decision making process (for what regards
transportation).
All the actions have been planned around two main principles: (i) “sustainability of the
whole transportation system”, towards the environment, the accessibility to the region
territory, the life and health quality, the economic profile, and the citizens participation;
and (ii) “management of the mobility demand”, intended as the main tool to address the
2020’s goals and requirements.
Differently from the Regional Energy Plan, the Transportation Plan has been organized
around the intervention axis: for each of them, specific goals and actions have been iden-
tified. Summing up, the intervention axes are:
(a) Transportation planning, mobility and the Territorial Planning: the transporta-
tion plan must be developed in a tight agreement with the Territorial Development
Plan, that identifies a number of social and economic priorities within the region.
To this end, “vast regional areas” have been identified, taking into consideration
such parameters as intra- and extra-municipality transports, major railway stations,
etc.
(b) Roadway Infrastructure: after a detailed specification of the existing roadways and
the already planned/in construction roadways, the Transportation Plan identifies
a number of detailed goals for increasing the overall quality of specific roads. To
such ends, guideline have been identified, such as guaranteeing the functionality of
the roads, improving the security of the roads, augmenting the urban compatibility,
and minimizing the environmental impact. Each action regarding a major road will
take into account also the relation with the adjacent area, the relation w.r.t. the avail-
able public transports and the traffic throughput/congestions, etc. The planned ac-
tions will be of four different types: to increase the security of high traffic roads; to
increase the traffic outflow form high traffic roads; small modifications due to geo-
logical/hydrological issues; increasing of the accessibility to specific urban sites.
(c) Roadway Security: the plan acknowledges the European objective of “zero kills
within 2050”, and fixes and intermediate step at 2020, where the number of traffic
victims must be half of the current figures. This general goal is then translated into
more specific goals, such as the reduction of the use of personal vehicles, the reduc-
tion of incorrect behaviours by means of education and controls, the improvement
of infrastructures, and incentives to passive/active security means in vehicles. To
reach the goals, different type of actions are proposed:
– educational activities for the technicians involved at any public administration
level, for the adoption of proper design and development tools;
– implementation of a regional security registry;
13
– interventions to reduce interference between roads and urban areas, and in
general to increase the security of roads within urban areas;
– identification of priority criteria to simplify funding and minimum require-
ments for each planned intervention;
– preparation of a two-year report about the security and the roads qualification;
– development of the “intelligent road”, in conjunction with the European GPS
system Galileo;
– activation of the regional centre for Monitoring;
– strict monitoring of the implementation of the established interventions;
– increase the synergy between different local public administrations.
(d) Railway Transport: the regional plan focuses on the following goals: to increase the
services, and their quality, especially w.r.t. specific time intervals within the day; to
increase the integration among different transport systems, extending such integra-
tion also to the billing system; to increase and renew the existing network as well
as the railway stations; to increase the information made available to the public. To
achieve the previous goal, the Transportation Plan envisages the following actions:
– to free the market for the transport services concession, by clearly separating
the management of the railway network from the services operated through
such network;
– to increase the accessibility to the railways stations;
– to transform the railway stations into “inter-modality transport nodes”;
– to increase the number and the quality of the services; to renew trains and other
technical material.
(e) Local Public Transport and Inter-modal Transport: the plan envisages to achieve a
tighter integration between the many different transportation means. In particular,
it aims to:
– promote the public transport as the main transport method;
– to educate citizens to the ideas of “good mobility”;
– to provide them with a unified billing system;
– to promote the electrical infrastructure, to support innovative transport means
such as electrical vehicles;
– to develop information services for the mobility.
For each goal, a number of different actions are identified: roughly speaking all
the cited goals were already subject of the previous transportation plan. Thus, the
current plan envisages actions to strengthen the current objectives.
(f) Goods/materials Transportation and Logistic Aspects: the plan recognizes the
great importance for the goods transport. However, since the transportation of
goods is related to all the aspects of the transport sector, the plan analyses its re-
lation w.r.t. to such aspects: for each of them, specific objectives are identified and
actions are planned.
(g) The Ravenna port: an entire section is dedicated to the situation of the Ravenna2
port. The plan affirms the importance of the port within the mobility of goods:
2
Ravenna is a medium size city sited on the east coast for the Emilia Romagna region
14
the objectives can be summarized into increasing the quality and the number of
services offered by the port. The planned actions are all focused to increase the port
infrastructure.
(h) Waterway Transport system: the regional waterway system is of a limited dimen-
sion; nevertheless, the plan envisages a number of concrete actions to increase the
quality of the waterways, such as the maintenance and the enlarging of the canals,
and a tighter integration with other transport modalities.
(i) Regional ports: the region recognizes the importance of a (relatively small) number
of ports, together with several touristic ports. The plan assumes as main objective
the increase of their activity, and the envisaged actions are all focussed to increase
the quality of the offered services.
(j) Air transport system: the plan takes as main objective the integration of all the
regional air transport, and at the same time the increase of the total number of
transports (passengers and goods). To this end, the planned actions are about the
increase of the airport related services, such as the implementation of dedicated
metro services, etc.
(k) Intelligent Transport Systems: the plan identifies the use of innovative ICT tools
as a key to address many traffic management problems. To this end, the region has
started to develop an ICT infrastructure, and the plan envisages specific actions to
enforce such regional framework.
(l) Overall interference of the plan w.r.t. the environment: the Transportation Plan
assesses all the previous intervention axis, w.r.t. to environmental aspects. In par-
ticular, the four dimensions of (1) fertile soil consumption, (2) natural area preser-
vation, (3) hydro-geological risk, and (4) energy-related aspects are taken into con-
sideration. For each one of these dimensions, proper actions are taken into consid-
eration, to mitigate the effect of other planned actions.
Finally, the Regional Transportation Plan is concluded with a section dedicated to the
monitoring of the plan execution, and with some general figures relating to available
funds.
2.5 The Regional Operational Programme
On 7th of August, 2007, the European Commission approved the Regional Operational
Programme (POR) for Italy’s Emilia-Romagna Region for the years 2007-2013. This Pro-
gramme comes under the Regional Competitiveness and Employment objective, and it
has a total budget of some 347 eM. The assistance provided by the European Union
through the Regional Development Fund (ERDF) amounts to nearly 128 eM, which rep-
resents around 0.4% of EC contributions to Italy under the cohesion policy for the period
2007-2013.
The strategy of the Operational Programme is based mainly on: (i) the regional issues,
identified after an analysis of the region’s potential; and (ii) the EC and national strategic
frameworks, which set out the principles for the allocation of EC funding.
15
In particular, to be “competitive” within a global system, production processes and sys-
tems must be reorganised. Accordingly, sustainable development and the strengthening
of research and innovation capabilities at both territorial and sectoral levels are at the
heart of the region’s strategy. Region Emilia-Romagna is also focusing on promoting eco-
logical platforms in industrial zones and on doubling its renewable energy production.
The programme thus contributes towards achieving the objectives of the Lisbon Strategy
in the field of economic competitiveness and employment. It also aims to: (1) give a sig-
nificant boost to research and technology transfer capabilities; (2) increase the support
for innovation; and (3) increase the efforts for a sustainable and environmentally friendly
development. Consequently, the main areas covered by the programme are research, in-
novation, energy and the environment, including better exploitation of the environmental
and cultural heritage.
The implementation of the programme aims to achieve the following results: increased
spending on technological research and development; reduce regional greenhouse gas
emissions; increase the current share of renewable energies in energy production; and
increase the number of created jobs (with a target of 14,000 units by 2015).
The operational programme is divided into five priorities:
• Priority 1, Industrial research and technology transfer: this priority is funded
with approximately 33% of the total investment, and it promotes industrial research
and technology transfer so as to boost competitiveness within the economic system.
Consequently, the programme’s aim is to strengthen the regional high-technology
network and its connection with the production system.
• Priority 2, Entrepreneurial development and innovation: funded with approxi-
mately 20% of the total investment, this priority supports innovation in the pro-
duction system. The integration of knowledge in production processes is therefore
the key element in ensuring the international competitiveness of the region and its
industry.
• Priority 3, Improved energy and environmental efficiency, and sustainable devel-
opment: it focuses on sustainable development, and in particular towards the in-
novation in the environment and energy fields. Also, it promotes energy efficiency.
This priority has been funded with approximately 23% of the total investment.
• Priority 4, Enhancing and better exploiting the environmental and cultural her-
itage: funded with approximately 20% of the total investment, it focuses on enhanc-
ing and better exploiting the region’s cultural and natural resources so as to make
them more attractive.
• Priority 5, Technical assistance: it is envisaged for management, monitoring, eval-
uation, organisation, information and communication activities. It is funded with
approximately 4% of the total investment.
The final fund allocation of the POR is depicted in Figure 1.
16
33%	
  
20%	
  
23%	
  
20%	
  
4%	
  
Industrial	
  research	
  and	
  
technology	
  transfer	
  
Entrepreneurial	
  development	
  
and	
  innova7on	
  
Improved	
  energy	
  and	
  
environmental	
  efficiency	
  and	
  
sustainable	
  development	
  
Enhancing	
  and	
  be:er	
  exploi7ng	
  
the	
  environmental	
  and	
  cultural	
  
heritage	
  
Technical	
  assistance	
  
Figure 1: Emilia Romagna Regional Operational Programme 2007-2013
3 Decision Support System Requirements
Within the ePolicy project, a Decision Support System (DSS) will be developed to support
the policy maker in the task of defining a plan. The ePolicy DSS will comprise social agent-
based modelling, opinion mining, game theory and mechanism design techniques, and
optimization techniques.
The Emilia-Romagna Region, as a partner of the ePolicy project, has provided a profound
and detailed insight on the process that leads the policy makers to develop a regional
plan. Through their expertises, we have identified a number of requisites that the DSS
should meet. Such requisites are not focused on technical details, but rather defined in
terms of which inputs policy makers can provide, and which outputs they would expect
from the DSS. Notice that part of the identified requirements (Sections 3.1, 3.2) stems
from the direct experience and current practices. ePolicy however envisages a novel ap-
proach where more aspects are taken into considerations. Hence, the remaining part of
the requirements (Sections 3.3, 3.4) is related to the novel components taken into account
within the project. These requirements will be then instantiated on the Regional Energy
Plan that we use as a use case for the ePolicy Project.
An overview of inputs and outputs for a DSS is shown in Figure 2. When a policy maker
starts the planning activity, he/she must take into account many constraints, objectives,
needs and requirements that will lead him/her to identify a possible plan. Some con-
straints can be easily expressed in numerical terms, while others are expressed in natural
language terms. In the latter case, we present a possible reification of natural language
constraints into some numerical form.
17
Primary	
  Ac*vi*es	
  
Costs	
  
Ac*vity	
  Outcomes	
  
Ac#vi#es	
  that	
  
compose	
  the	
  plan	
  and	
  
produce	
  some	
  output	
  
Cost	
  of	
  each	
  unit	
  of	
  
ac#vity	
  
Primary	
  ac#vi#es	
  have	
  an	
  
outcome	
  matching	
  part	
  of	
  the	
  
objec#ve	
  for	
  which	
  it	
  has	
  been	
  
inserted	
  in	
  the	
  plan	
  
Square	
  matrix:	
  ac#vity	
  x	
  
ac#vity.	
  How	
  many	
  
secondary	
  ac#vity	
  to	
  
produce	
  for	
  each	
  unit	
  of	
  PA	


Primary-­‐Secondary	
  Act.	
  
Enviromental	
  impacts	
  
2	
  matrices:	
  ac#vi#es/
pressures/	
  receptors	


Economic	
  impacts	
  
Matrix	
  ac#vi#es/
economic	
  indicators	


Social	
  impacts	
  
Matrix	
  ac#vi#es/
social	
  indicators	


ENVIRONMENTAL	
  
AGENCY	
  
EUROSTAT	
   Opinion	
  
mining	


ePolicy	
  
	
  decision	
  support	
  system	


Regional	
  Plan	
  
Impact	
  of	
  Policy	
  
	
  instruments	
  
SIMULATOR	
  
Planned	
  ac*vi*es/policy	
  Instruments	
  /investments	


Exis*ng	
  situa*on	
  
Regional	
  Opera*onal	
  Progr.	
  
Analisys	
  of	
  the	
  
current	
  situa#on	
  
Budget	
  constraints	
  
Available	
  Policy	
  Instr.	
  
and	
  Costs	
  
Incen#ves,	
  regula#on,	
  
informa#on	
  etc.	
  
Figure 2: High level overview of Inputs and Outputs of a DSS for ePolicy.
3.1 Expected Outputs
Roughly speaking, the ultimate goal of a plan is to achieve the regional objectives and
priorities through actions and activities that should be compatible with constraints, and
at the same time environmentally, socially and economically assessed.
To this end, a plan consists of a set of decisions about the following aspects:
1. which types of primary activities should be inserted in the plan, and their magni-
tude for each of them;
2. how much money will be assigned to implement these activities. This decision can
be split up into different sub-issues:
(a) the amount of money to be allocated from the regional budget to fund these
activities;
(b) the amount of money to be allocated for pushing each different activity imple-
mented by citizens and stakeholders;
(c) the mechanisms for assigning such incentives (e.g., auctions).
From a mathematical perspective, a policy maker has a set of variables, and it is her duty
to assign values to such variables. Variables represent decisions that have to be taken.
For example, we could have a vector of activities A = (a1, . . . , aNa ). For each activity
the policy maker decides also its magnitude Magi, i ∈ [1..Na]. The magnitude could be
represented in two ways: in an absolute way, as the amount of a given activity, or in a
relative way, as a percentage with respect of the existing quantity of the same activity. In
this document we adopt the absolute representation.
18
Moreover, for each activity, the policy maker has to decide the amount of financial funds
to be used either directly or in the form of incentives, and which mechanisms for each
activity type (one or more mechanism for each activity type).
3.2 Requirements for the Global Optimization component
When dealing with the regional plan, the policy maker must take into account many
different inputs. In the following we provide an overview of different types of inputs that
are of interest for global optimization component. Indeed, the expected outcomes for this
component are plans that respect all the constraints (provided as inputs), and guarantee
the optimal solution with respect to some optimization function (representing the desired
outcome, and provided as input).
3.2.1 Inputs related to the activities
The first group of input information is related to the activities. Such group of inputs is
shown in Figure 2 on the left side of the DSS. We distinguish primary activities from
secondary activities. Primary ones are those activities that are of main importance in a
given plan, and that directly affect the achieving of a goal. Secondary activities are those
supporting the primary ones by providing the needed infrastructures. We envisage the
following type of inputs, directly linked to the notion of activity:
1. list of primary activities and, possibly, minimal amounts for each activity
2. function cost: a function for each activity, to determine the cost for each unit of ac-
tivity. Notice that the considered cost is the total cost of the activity for the regional
system, which is not the same as the cost for the taxpayers of the Emilia-Romagna
region. Indeed, the region can enforce policies in many ways, e.g. by convincing
private stakeholders to invest in specific activities. In turn, this can be done e.g.
with the financial leverage, or by giving favourable conditions (either economic or
other) to investors;
3. efficiency function: a function for each activity, to determine the outcome produced
per unit of activity;
4. the Primary-Secondary Activity matrix D, that is used to determine, for (the amount
of) each activity, which (and how much of) secondary activities are required.
3.2.2 Inputs related to the impacts
Each activity affects on one or more receptors. We distinguish between three different sets
of impacts, and for each one we envisage a different input. In Figure 2 such inputs are
depicted below the DSS.
1. environmental impacts, given in the form of the two matrices activities/pressures
and pressures/receptors, as described in Section 2; the impacts might also be sub-
ject to some constraints. For example, greenhouse gas emission (that is a negative
pressure) could be constrained to lowering a given threshold;
19
2. economic impacts, given in the form of complex activities/economic indicators; ac-
tivities indeed have a huge impact on the territory, e.g. creation of temporary/permanent
new jobs and new business supporting the activities;
3. social impacts, linked to each different activity type, and provided by opinion min-
ing tools (ex-ante).
3.2.3 Inputs linked to the regional objectives
Each region has its own specific and peculiar objectives. Some of them are intrinsically
determined by the region itself, while other have a more political nature, and are the
consequence of political decisions. In Figure 2 such inputs are depicted on the right of
the DSS.
1. required/expected outcome: each activity has an outcome. Each plan has an ex-
pected outcome that is constrained to be a certain amount;
2. budget constraints: each region has a total amount of funds available to be used
both for implementing activities that are fully paid by the Region or as incentives for
driving the citizen and stakeholders towards the desired direction; given a budget
budPlan available for a given plan, a constraint limits the overall plan costs. This
constraint can be posted either on the overall plan, or on parts of it. As an example,
let’s suppose the budget has already been partitioned into chapters: then it would be
possible to impose the above constraint only on activities related to a given chapter;
3. available policy instruments and costs a feedback about the mechanisms and the
amount of incentives, provided by tools such as opinion mining, social agent-based
simulation, game theory and mechanism design;
4. political objectives, provided by politicians. For example, a possible (political) pri-
ority is to be conformant with European guidelines such as the 20-20-20 initiative3
.
3.2.4 Inputs related to socio-geographical aspects and best practices
1. Specific plan constraints: there are some constraints that are specific for a given
plan. An example on energy source diversification will be given in section 4.
2. Social and geographic limits: each region has its own geo-physical characteristics.
This poses constraints on the maximum number of activities that can be produced
in a specific area.
3. Available policy instruments: the available policy instruments cover a variety of
actions that the policy maker has to determine in order to make sure that the policy
is indeed implemented. PPA Energy is surveying a number of policy instruments
available in Emilia Romagna, in the UK, in Europe and in the US that will be con-
tained in deliverable D2.2.
3
The 20-20-20 initiative aims to achieve three ambitious targets by 2020: reducing by 20% its greenhouse
gas emissions, having a 20% share of the final energy consumption produced by renewable sources, and
improving by 20% its energy efficiency.
20
4. Mechanisms for distributing economic incentives: the Emilia Romagna Region
exploited economic incentives distributed to private stakeholders interested to per-
form activities. The amount of economic incentives, as well as the way (the mech-
anism such incentives are distributed to private stakeholders is an input to be con-
sidered. In particular, among many possible mechanisms, e-Policy should evaluate
the best one, w.r.t. a certain budget availability.
3.3 Requirements for the ePolicy Social Simulation component
The social simulation in the ePolicy project focuses on the simulation of the impact of dif-
ferent policy instruments on the adoption of photovoltaic panels at a household level. It
is placed logically after the planning-step on the regional level (also referred to as global
level in the project). Once planning policies have been determined, through optimisation
(e.g. with respect to minimum costs, maximum CO2-reduction, minimum disruption,...)
at the level of the region, it then is necessary to apply them. However, what is an optimal
policy at the regional level may not be locally or individually optimal. Thus some mech-
anism is needed to enforce the policy – one cannot assume that individual agents will
adopt the desired behaviours of their own accord. These potential policy instruments
could reach from fiscal incentives, via tax incentives and different tariffs to legislation for
example4
. All options have disadvantages, and which is best is not clear and will vary
from case to case. The social simulation will be used to derive the most effective instru-
ments by analysing their impact on a household level. The goal of this endeavour is to cre-
ate a multi-level agent-based model with agents representing individual households that
will allow policymakers to explore the consequences of different types of policy instru-
ment and thus enable them to make better choices. The agents will be given behavioural
rules modelling their likely individual responses to policy instruments (including the ef-
fect of influences from other actors, e.g. as a result of collective actions, imitation etc.).
The overall response to the simulated policy instruments will be measured to inform pol-
icymakers. In order to calibrate and validate the model, data will be gathered on actors’
past behaviour (for example, their choices of energy consumption options), on their per-
ceptions and opinions (for example, their interest in combating global warming and their
sensitivity to energy cost changes), and on their knowledge of the policy relevant actions.
After briefly outlining the role of the social simulation in the ePolicy project, this section
focuses in the connection of the social simulation to other project components, both on
a conceptual (Section Sections 3.3.1, 3.3.2, and 3.3.3) as well as on a data format level
(Section 3.3.4).
3.3.1 Connection to Global Level Optimization
In Section 3.3 we noted that the role of the social simulation is to analyze the impact of
different policy instruments (which are being decided upon at a regional level) on the
adoption of photovoltaic panels at a household level. We therefore see the policy instru-
4
Currently a summary report on policy instruments for renewable resources is being drafted by PPA en-
ergy. We will use this report for the decision which policy instruments to consider in the social simulation.
21
ments decided upon at the regional optimization level as input for the social simulation,
which then analyzes the adoption of photovoltaic panels, the resulting costs, etc. that
would result from the application of these policy instruments. The recommendations of
policy instruments based on the results of the regional optimization hence serve as input
for setup of the social simulation setup, i.e. they determine which policy instruments are
considered and analysed w.r.t. the households reaction to them.
3.3.2 Connection to Visual Analytics
With respect to the visual analytics component of the project the social simulation has
one main connection: the visualization of the simulation results. The currently employed
simulation platform (Netlogo5
) has its own visual components that allows the display of
the results in form of graphs and animated maps of the region while the simulation runs.
Figure 3 shows an example of such a Netlogo visualization with GIS information of the
Emilia Romagna region6
and Figure 4 the visualization of the adoption of photovoltaic
by households over time.
Figure 3: Example of Netlogo Visualization (GIS)
The Netlogo visualizations are typically conducted per experimental run and can be logged
externally (more information about this can be found in Section 3.3.4). We therefore see
the role of visual analytics as being in the reprocessing of the results of the individual
runs, the incorporation of the relation between simulation setup and simulation results,
the comparison of simulation experiments with slightly different setups and the presen-
tation of consolidated results in a form that is easily understandable for the stakeholders
5
http://ccl.northwestern.edu/netlogo/
6
The green points represent households which have already adopted photovoltaic, whereas the black
points refer to households that use other energy resources.
22
Figure 4: Example of Netlogo Visualization (Simple Plot)
of the decision support system (e.g. policy makers). The social simulation therefore pro-
vides the visual analytics components with simulation results (which will vary according
to the input parameters of the simulation).
3.3.3 Connection to Game Theory Interaction
Whereas the connection of the social simulation has been clearly defined for the visual
analytics and global optimization component, with respect to the game theory compo-
nent the connection is less clear. The focus of the game theory group at the moment is
on mechanism design for auctions. As previous grants in the Emilia Romagna Region
have been allocated with the help of auctions they want to look deeper into this distribu-
tion tool for the policy instrument of fiscal incentives by designing an auction mechanism
that optimizes the allocation of resources (grants) to those households which benefit most
from them. If—on the global optimization level—the policy instrument of fiscal incen-
tives is chosen (which is then given to the social simulation as input), one option for the
connection of the two components is to incorporate the auction mechanisms in the social
simulation. This is envisioned as follows: if an auction for grants to support the installa-
tion of photovoltaic panels is announced, the agents aware of this auction can decide to
put forward bids for the auction. The auction mechanism then decides which agents win
the auction (i.e. obtain a grant) and feeds this information back to the agents. The agents
then incorporate the result of the auction (getting or not getting a grant) into their deci-
sion making w.r.t. installing photovoltaic (the agents that have received a grant have to
install a photovoltaic system, whereas the other agents can decide to do so or not based on
their personal preferences). Summing up this idea, the social simulation would provide
input to the game theory component in form of bids (by agents) for the grant auction and
would get decision about the success of the bids back as output from the game theory
component. This output is then incorporated as information input for the simulation.
3.3.4 Data-Formats of In- and Output
For the social simulation the tool Netlogo will be used. NetLogo is an agent-based pro-
gramming language and integrated modeling environment.
When performing a social simulation, similar to any other scientific experiment, one
wants to observe the behaviour of the system (the simulation) with respect to the parameter-
23
setup of the simulation. Rephrasing this, one wants to analyze the relation between the
input (parameter-specification) of the simulation and its output (emergent system prop-
erties). These parameters can for example be numeric values (e.g. the number of agents to
be modelled), boolean values (e.g. whether a particular policy instrument shall be used
or not) or proportions (e.g. percentage of people that already have a photovoltaic system).
From the input perspective, Netlogo allows for two main ways to alter parameters of a
simulation setup: (i) changing the parameters by hand before each simulation experi-
ment, or (ii) using a tool to automate this process.
Due to the large number of experiments that we aim to perform, we shall use the second
option. For this purpose a feature built into Netlogo called “BehaviourSpace” is typically
used (see Figure 5).
Figure 5: The Netlogo BehaviourSpace
Using the dialog shown in Figure 5, the value for each parameter can be specified using
the simple form [“parameter name” [value1 value2 ...]] and once all parameters have
been defined, experiments sweeping through all possible parameter combinations can
be performed7
. For each of the experimental runs with one parameter combination, the
results of the simulation experiment are written to output files that can be specified by
7
In Netlogo the specification of parameter values does not need to be done through the interface of the
24
x y
01-2013 1298
02-2013 1659
03-2013 1819
04-2013 1892
05-2013 1935
06-2013 1964
Table 2: Number of Households with Photovoltaic Systems
the user of the simulation. These output files are typically csv-files that track output
parameters that are of interest to the simulating person over time. One output parameter
that is of interest for the social simulation is the total number of households adopting
photovoltaic systems over time. Table 2 shows what the logged output for this parameter
might look like:
The x-variable in Table 2 indicates the time (MM-YYYY), and the y-variable, the total
number of households having a photovoltaic system. Using this information, one could,
for example, develop theories of the dissemination of photovoltaic systems over time.
3.4 Requirements for the Opinion Mining component
The overall goal of the opinion mining component (OP) is to infer the sentiment of the
population/society towards some topic. This will essentially consist of a numeric score
in the interval [−2, 2], with negative (positive) values indicating negative (positive) senti-
ment.
The inferred score will be used as one of many factors in the simulation module of the
ePolicy DSS.
For this inference to be possible several key aspects need to be defined a priori. Namely,
two of the main decisions are:
• The sources from where the sentiment will be inferred
• The topics for which we are interested in obtaining the sentiment
The sources are essentially Web 2.0 platforms that allow users (the population) to express
their opinions on energy related topics through textual messages.
The topics are a list of subjects that we consider relevant within the field of energy policy
making.
Although these two issues need not be closed, at each point in time, they need to be
fixed. This requirement results from the way the OP system will work. This system will
have two main working modules, with different requirements in terms of interface and
integration with the general DSS:
BehaviourSpace program, but this is the most common way. Other options include reading values from
Excel or CSV-files, or programming parameter sweeps into the NetLogo program itself.
25
• Inference module
• Learning module
The inference module must be coupled with the general DSS and is the only module
that "standard" users will see. This module will be responsible for obtaining a sentiment
score regards topic i at any time t. This will be inferred using sentiment prediction models
that where previously developed by the learning module. The learning module does not
need to be integrated with the general DSS as it will be executed offline with the goal of
obtaining the prediction models that will be used by the inference module.
3.4.1 The Inference Module
The inference module should be coupled with the general DSS. Its task is to obtain a
sentiment score regarding a certain topic.
The requirements of the inference module are the following. At the most basic level of
interaction the user will ask at time t for the sentiment score of the population concerning
a topic i. As a result the module should return a numeric sentiment score. This assumes
the existence of a fixed set of available topics for which prediction models were previously
obtained by the learning module, using another fixed set of Web sources.
At a higher level of interaction one can assume that the user also specifies a certain past
time window which is to be used to infer the sentiment. In this context, the inference
module will only use the documents/news/posts available in that time window to reach
a global sentiment score.
In terms of computation, the task of the inference module is to try to predict the sentiment
score for a set of documents and then somehow aggregate these individual predictions
into a single sentiment of the population. In principle, given that the prediction mod-
els are assumed to be obtained before in a offline manner by the learning module, the
sentiment inference task should have a small computational cost.
3.4.2 The Learning Module
The learning module is responsible for obtaining sentiment prediction models that will
be used by the inference module. It is essentially a text mining tool that, given a set
of textual sources, obtains a model that can be used to infer the sentiment of new texts
regards a certain topic. Given the difficulty in constructing large data sets with documents
previously tagged concerning the sentiment by a domain expert, we will consider several
learning methodologies with the goal of overcoming this difficulty.
The learning module does not need to be coupled with the general DSS. It can be executed
by a kind of system administrator under certain conditions. These conditions may vary
but they can include: i) need for models for a new topic; ii) need to include new Web
sources of data; iii) need for updating the prediction models with more recent data; etc.
In terms of requirements the learning module receives as inputs a set of textual docu-
ments (labelled or not concerning the sentiment score) and a target topic, and produces
26
as output a prediction model.
Obtaining the sentiment prediction models for a set of topics using a set of textual sources
should be a computationally very demanding task.
3.5 Requirements for the Visualization component
The visualization component will address three main tasks, and therefore support the
user at three different levels:
• Giving non-expert IT users an intuitive access to information and results coming
from the components of the technical work packages. Get overview.
• Provide analysts a visualization tool to explore the dependencies between the pa-
rameters of each technical component’s model and its output. Analyse alternatives.
• Provide on overview of the integration of all technical components and their inter-
dependencies. Supervise overall workflow.
To address these tasks, it will be connected to the technical components of the other work
packages. These are mainly the optimization, the agent-based simulation, and the opin-
ion mining component. In the following, the connection of the visualization component
to these three components is described. Respectively, the other components’ input and
output to be used by the visualization component is specified, and the control flow is
regarded.
3.5.1 Connection to Optimization component
As described in Section 3 the optimization component analyses the policy situation from
a global level perspective. Input parameters to be specified by the users are
• the target function (e.g. minimize costs, maximize energy production, etc.)
• constraints on optimization problem (e.g. budget constraints, maximum value of
air pollution, etc.)
The output consists of the types of primary activities to be inserted in the plan, and the
magnitude for each of them. Moreover, a matrix describing the influences of each activity
on environmental, economical, and social impacts will be provided.
At a first stage, the visualization component will provide the user a visual access to the
output generated by the optimization component with fixed parameter setup. Therefore
the output data and the associated parameter setup has to be made accessible for the
visualization component (e.g. via a database).
In a later stage, the visualization component will provide a graphical user interface that
enables the user to visual-interactively specify the input parameters for the optimization
components, and analyse the resulting output. Therefore a control flow from the visual-
ization to the optimization component has to be resolved and the output data has to be
provided in order to realize the analysis of dependencies between input and output data.
Several optimization runs with different parameters and associated output data have to
be accessed, e.g. via a database, to enable a performant workflow.
27
3.5.2 Connection to Agent-based Simulation component
The main connection to the simulation component is the visualization of the simulation
results (see also section 3.3. The policy analysts will be provided with an intuitive access
to simulation results. The associated data has to be provided to the visualization tool,
e.g., via a database.
In a second development stage the visual-interactive analysis of the interdependencies
between the different (input) parameter setups and the associated simulation results (out-
put) will be addressed. Therefore, the input and output data has to be made accessible
by the simulation component (e.g. via a database).
3.5.3 Connection to Opinion Mining component
Regarding the opinion mining component, the task of the visualization component is
the visual-interactive exploration of public sentiment regarding pre-specified topics. The
user will be provided with a visualization, in which the time frames and the topics can
be specified by the user. Moreover, additional meta-information, like the web source, or
statistical information, like the number of posts, will be visualized. This information has
to be made available for the visualization, e.g. via a database.
4 Requirement instantiation for the Regional Energy Plan
In this section we ground the general requirements on the Regional Energy Plan. An
overview of inputs and outputs for a DSS grounded on this Plan are shown in Figure 6.
4.1 Outputs
Roughly speaking, the ultimate goal of an energy plan is to drive the free market of energy
production towards the covering of the regional’s energy requirements, and to achieve
some political objectives. To this end, an energy plan consists of a set of decisions about
the following aspects:
1. which types of energy production systems should be employed, and for each of
them their magnitude;
2. how much money will be assigned to push the market (through incentives) towards
the desired production of energy, as identified in the previous point. This decision
can be split up into two different sub-issues:
(a) the amount of money to be allocated for pushing each different energy produc-
tion system type, in the form of incentives;
(b) the mechanisms for assigning such incentives (e.g., auctions)
At a general level the policy maker has to choose which activities, and magnitude, have to
be promoted to reach the objectives. In the case of the energy plan, this means to choose
which energy sources, together with installed power, have to been “pushed” within the
energy market. Moreover, for each chosen energy source, the policy maker has to decide
the amount of financial funds to be used in the form of incentives, and which mechanisms
for each energy source type (one or more mechanism for each type).
28
Primary	
  Ac*vi*es	
  
Costs	
  
Outcomes	
  
Biomass	
  power	
  plants	
  
Photovoltaic	
  plants	
  
Wind	
  power	
  plants	
  ….	
  
Cost	
  per	
  MW	
  of	
  
energy	
  produced.	
  
Energy	
  efficiency	
  of	
  
each	
  source.	
  
Square	
  matrix:	
  
acCvity	
  x	
  acCvity	


Primary-­‐Secondary	
  Act.	
  
Enviromental	
  impacts	
  
2	
  matrices:	
  acCviCes/
pressures/	
  receptors	


Economic	
  impacts	
  
Matrix	
  acCviCes/
economic	
  indicators	


Social	
  impacts	
  
Matrix	
  acCviCes/
social	
  indicators	


ARPA	
   RAMEA/ISTAT	
  
Opinion	
  
mining	


ePolicy	
  
	
  decision	
  support	
  system	
  
Regional	
  Energy	
  Plan	
  
SIMULATOR	
  
Planned	
  ac*vi*es	
  and	
  investments	


Rrgional	
  Energy	
  Balance	
  
Regional	
  Opera*onal	
  Progr.	
  
Total	
  Energy	
  Required	
  
by	
  the	
  Region	
  
Budget	
  constraints	
  
Available	
  Policy	
  Instr.	
  
and	
  Costs	
  
IncenCves,	
  regulaCon,	
  
informaCon	
  etc.	
  
Figure 6: High level overview of Inputs and Outputs of a DSS for the Regional Energy
Plan.
Example 4 (RER Energy Plan 2011-2013)
An excerpt of the Energy Plan of Region Emilia Romagna is shown in Table 3. For each of the
energy sources, the plan provides:
• the currently installed power, in MW, as of 2010;
• the forecast/required installed power for 2013, in MW;
• the total energy produced in a year, in kTOE (TOE stands for Tonnes of Oil Equivalent), for
2013;
• the total cost, in eM, required to be invested (by the private sector, industry, government,
etc.) to reach the desired production;
Being more precise, the installed power and the produced energy expected for 2013 are linked by
a deterministic function8
. Moreover, also the costs/investments for each activity are determined
using some deterministic function.
4.2 Inputs for a DSS
In the following we provide an overview of different types of inputs, w.r.t. the setting of
a regional energy plan.
8
The ratio between installed power and total produced energy is mainly influenced by the availability
of the source: while a biomass plant can (at least in theory) produce energy 24/7, the sun is available only
during the day, and the wind only occasionally. For unreliable sources, usually an average for the whole
year is taken.
29
Power 2010 Power 2013 Energy 2013 Investments
Electrical power plants (MW) (MW) (kTOE) (Me)
Hydroelectric 300 310 69.3 84
Photovoltaic 230 850 87.7 2170
Thermodyn. solar pow. 0 10 1 45
Wind generators 20 80 10.3 120
Biomasses 430 600 361.2 595
Total 980 1850 529.5 3014
Table 3: Energy plan developed by the region’s experts for 2011-2013
4.2.1 Inputs related to the activities
The first group of input information is related to the activities. Such group of inputs is
shown in Figure 6 on the left side of the DSS. We distinguish primary activities from
secondary activities. Primary activities are all those activities that directly produce en-
ergy, namely renewable and non-renewable power plants. Secondary activities are those
supporting the primary ones by providing the needed infrastructures. We envisage the
following type of inputs, directly linked to the notion of activity:
1. list of primary activities (e.g., Biomass plants, photovoltaic plants, wind turbines,
etc.) and, possibly, minimal amounts for each activity (e.g., increase by 10% the
amount of photovoltaic energy);
2. function cost: a function for each activity, to determine the cost for each MW of
energy produced depending on the activity9
;
3. efficiency function: a function for each activity, to determine the energy produced
by each installed MWatt of each activity;
4. the Primary-Secondary Activity matrix D, that is used to determine, for (the amount
of) each activity, which (and how much of) secondary activities are required.
4.2.2 Inputs related to the impacts
Each activity impacts on one or more receptors. We distinguish between three different
sets of impacts, and for each one we envisage a different input. In Figure 6 such inputs
are depicted below the DSS.
1. environmental impacts, given in the form of the two matrices activities/pressures
and pressures/receptors, as described in Section 2; the impacts might also be sub-
9
The cost of a plant depends mainly on the installed power: a solar plant has an installation cost that
depends on the square meters of installed panels, which in their turn can provide some maximum power
(peak power). Notice that the considered cost is the total cost of the plant for the regional system, which
is not the same as the cost for the taxpayers of the Emilia-Romagna region. Indeed, the region can enforce
policies in many ways, convincing private stakeholders to invest in power production. This can be done
with the financial leverage, or by giving favourable conditions (either economic or other) to investors. Some
power sources are economically profitable, so there is no need for the region to give subsidies. For example,
currently in Italy biomasses are economically advantageous for investors, so privates are proposing projects
to build biomasses plants. On the other hand, biomasses also produce pollutants, they are not always
sustainable (for a discussion on the issue, see [2]) so local committees are rather likely to spawn against the
construction of new plants.For these reasons, the number of licenses the region gives to private stakeholders
for building biomass-based plants are limited.
30
ject to some constraints. For example, greenhouse gas emission (that is a negative
pressure) could be constrained to lowering a given threshold;
2. economic impacts, given in the form of complex activities/economic indicators, as
provided by the project RAMEA; activities indeed have a huge impact on the terri-
tory, e.g. creation of temporary/permanent new jobs and new business supporting
the activities;
3. social impacts, linked to each different activity type, and provided by opinion min-
ing tools (ex-ante and ex-post).
4.2.3 Inputs linked to the regional objectives
Each region like, for example, Emilia Romagna, has its own peculiar objectives. Some
of them are intrinsically determined by the region itself, while other have a more polit-
ical nature, and are the consequence of political decisions. In Figure 6 such inputs are
depicted on the right of the DSS.
1. required/expected outcome: in an energy plan the outcome is the total energy to be
expected within the regional boundaries, usually based on some estimation about
the energy consumption;
2. budget constraints: each region has a total amount of funds available to be used
as incentives for driving the energy market towards the desired direction; given a
budget budPlan available for a given plan, a constraint limits the overall plan costs.
This constraint can be posted either on the overall plan, or on parts of it. For instance
suppose the budget has already been partitioned into chapters, then it would be
possible to impose the above constraint only on activities related to a given chapter;
3. feedback about the mechanisms and the amount of incentives, provided by tools
such as opinion mining, social agent-based simulation, game theory and mecha-
nism design;
4. political objectives, provided by politicians. For example, a possible (political) pri-
ority is to be conformant with European guidelines such as the 20-20-20 initiative10
.
Such objectives could be translated into constraints on the minimum amount of en-
ergy produced by renewable energy sources.
4.2.4 Inputs related to socio-geographical aspects and best practices
1. energy source diversification: the trend to allocate funds should not be directed
toward a single energy source, but should cover both renewable and non renewable
energy sources. This requirement comes as a best practice, and is supported by
several considerations. For example, to be “robust” w.r.t. fluctuations of the price
and availability of the various resources. Such input can be considered to be in the
form of a constraint about the minimal percentage of the total energy needed to be
produced by each energy source.
10
The 20-20-20 initiative aims to achieve three ambitious targets by 2020: reducing by 20% its greenhouse
gas emissions, having a 20% share of the final energy consumption produced by renewable sources, and
improving by 20% its energy efficiency.
31
2. social and geographic limits: each region has its own geo-physical characteristics.
For instance, some regions are particularly windy, while some others are not. Hy-
droelectric power plants can be built with a very careful consideration of environ-
mental impacts, the most obvious being the inundation of vast areas of land. This
poses constraints on the maximum energy that can be produced by a given energy
source.
3. mechanisms for distributing economic incentives: to boost the development of en-
ergy production plants, the Emilia Romagna Region exploited economic incentives
distributed to private stakeholders interested to build plants. The amount of eco-
nomic incentives, as well as the way (the mechanism such incentives are distributed
to private stakeholders is an input to be considered. In particular, among many
possible mechanisms, e-Policy should evaluate the best one, w.r.t. a certain budget
availability.
5 Use case scenario #1: the RER energy plan 2011-2013
The Energy Plan of Emilia Romagna Region, for the 2011-2013 years, has been published
in 2011, and it is publicly available in [3]11
. The data presented in this Section have been
taken from [3], or have been directly provided by RER employees.
The following inputs have been taken into consideration when preparing the energy plan:
Primary activities and minimum quantity (4.2.1:1) The primary activities that have been
identified are:
1. Hydroelectric, with a minimum amount of installed power of 3 MW;
2. Photovoltaic, with a minimum of 400 MW;
3. Thermodynamic Solar Power, with a minimum of 5 MW;
4. Wind generations, with a minimum of 20 MW;
5. Biomasses power plants, with a minimum of 100 MW;
Function cost (4.2.1:2) This function provides the estimated cost to realize a certain type
of energy production plant. These figures do not comprise the costs related to the
functioning of the production plant, but only the costs for realizing the plant.
1. Hydroelectric: 8,400,000e/MW;
2. Photovoltaic: 3,500,000e/MW;
3. Thermodynamic Solar Power: 4,500,000e/MW;
4. Wind generations: 2,000,000e/MW;
5. Biomasses power plants: 3,500,000e/MW;
Efficiency Function of each activity (4.2.1:3) This function provides the link between the
installed power and the estimated produced energy (in TOE). The function is the
result of estimated about the current technologies, and may vary over the years
with technology advances.
1. Hydroelectric: 0.2235483871 TOE/MW;
2. Photovoltaic: 0.1031764706 TOE/MW;
3. Thermodynamic Solar Power: 0.1 TOE/MW;
11
This resource is italian only. See in particluar Annex 1.
32
4. Wind generations: 0.12875 TOE/MW;
5. Biomasses power plants: 0.602 TOE/MW;
Primary-Secondary activity matrix (4.2.1:4) This input has not been taken into consid-
eration for the current energy plan.
Environmental Impacts (4.2.2:1) This input has not been taken into consideration for the
current energy plan.
Economic Impacts (4.2.2:2) This input has not been taken into consideration for the cur-
rent energy plan.
Social Impacts (4.2.2:3) This input has not been taken into consideration for the current
energy plan.
Total amount of energy to be produced (4.2.3:1) In the current plan, the total amount of
energy to be produced from renewable sources, for the year 2013, will be approxi-
matively about 529.5 kTOE.
Budget constraints (4.2.3:2) This input has not been taken into consideration for the cur-
rent energy plan.
Feedback about mechanisms and incentives (4.2.3:3 This input has not been taken into
consideration for the current energy plan.
Political Objectives (4.2.3:4) The current plan has been defined taking into account the
“20-20-20” goal. Once energy requirements for 2013 have been estimated from pre-
vious trends about energy consumption, the “20-20-20” goal has been taken into
account, thus establishing the energy amount to be achieved by efficiency, and the
final quantity (20%) of energy to be produced from renewable sources. Given the
current energy production figures (both renewable and non), the amount of energy
to be produced has been decided (529.5 kTOE, as mentioned above). Summing up,
the current energy plan has been “built” around a political objective: however, there
is no reason to consider such link as to be the default for the futures energy plans.
It is sure that political objectives will provide some lower/upper bounds for renew-
able sources.
Energy source Diversification(4.2.4:1) This input has not been taken into consideration
for the current energy plan.
Social and geographic limits (4.2.4:2) This input has not been taken into consideration
for the current energy plan.
Incentives and mechanisms (4.2.4:3) This input has not been taken into consideration
for the current energy plan.
6 Use case scenario #2: an “extended” energy plan
This scenario extend the previous one with novel dimensions and inputs that e-Policy is
going to take into account. It is an extension of the data already provided in the previous
scenario.
Primary-Secondary activity matrix (4.2.1:4) The matrix D is available in Appendix A.
Environmental Impacts (4.2.2:1) The matrices assesing the impacts on pressures and re-
ceptors are available in Appendix B.
33
Economic Impacts (4.2.2:2) At the current stage of the project we do not have (yet) any
reliable information about the impacts of a plan versus the economic variables. To
this end, we plan to exploit results from the RAMEA project12
, and from the national
statistic institute (ISTAT13
).
Social Impacts (4.2.2:3) At the current stage of the project we do not have (yet) any reli-
able information about the impacts of a plan versus the economic variables. To this
end, we plan to exploit results from the Opinion mining component.
Budget constraints (4.2.3:2) Budget constraints have been proved of a certain difficult to
be identified. Indeed, the current practices are adopted:
• no budget is established at the beginning of the energy planning process. It
is reasonable to assume that the budget will be within some interval; such
interval is derived by the total budget about the whole region; political and
economical factors greatly affects the funds availability;
• to boost the implementation of energy production plants, RER usually identi-
fies a mechanism about some sort of economic incentive; to-date it has always
been an auction-based mechanism; domain experts do not exclude that such a
choice may change;
• the amount of money available for the mechanism is decided strictly before the
starting of the auction, and it is the consequence of many observations and po-
litical choices. Its amount is highly variable, and depends by many conditions,
most of them quite political and on the (whole region) budget availability;
• ePolicy will not consider the current practice, but rather will provide tools for
supporting and enhancing a correct planning about energy boosts. To this end,
ePolicy will assume an initial budget, and one of ePolicy’s outputs will be about
“how to” exploit such budget.
Feedback about mechanisms and incentives (4.2.3:3 No data is currently available about
the effectiveness of one incentive mechanism (compared to other ones). We plan to
collect this information by means of opinion mining techniques, and social simula-
tion.
Energy source Diversification(4.2.4:1) We will model such input in terms of minimal
threshold about installed power for each source. Currently, no lower limits have
been identified. However, the model should be able to tackle such constraint.
Social and geographic limits (4.2.4:2) We model such input in terms of maximum thresh-
old about installed power for each source. Reasonable values, provided by ARPA,
are the following:
1. Hydroelectric, max 20 MW;
2. Photovoltaic, max 1240 MW;
3. Thermodynamic Solar Power, max 20 MW;
4. Wind generations, max 120 MW;
5. Biomasses power plants, max 340 MW;
Incentives and mechanisms (4.2.4:3) The Emilia Romagna Region consider the follow-
ing mechanisms as feasible to be implemented:
12
http://www.arpa.emr.it/ramea/index.asp
13
http://www.istat.it
34
1. Capital account: incentives are given as a grant, and no money is returned
to the Region. Grants are about a percentage of the total plant cost. Previous
economic incentives (2003, 2004 and 2007) have been distributed by means of
a single, sealed bid english auction. Other auction types can be considered
within ePolicy.
2. Interests account: incentives are given as a grant only to pay (part of) interests
on bank loans (again no money is returned to the Region).
3. Rotation fund: the Region lends money and interests are returned after a given
period.
4. Guarantee fund: the Region guarantees for the investor that obtains a bank
loan, thus easing the loan request.
35
References
[1] Paolo Cagnoli. VAS valutazione ambientale strategica. Dario Flaccovio, 2010.
[2] Massimiliano Cattafi, Marco Gavanelli, Michela Milano, and Paolo Cagnoli. Sustain-
able biomass power plant location in the Italian Emilia-Romagna region. ACM Trans-
actions on Intelligent Systems and Technology, 2(4):33:11–33:19, July 2011.
[3] Regione Emilia-Romagna. IL SECONDO PIANO TRIENNALE DI ATTUAZIONE
DEL PIANO ENERGETICO REGIONALE 2011-2013.
[4] Barry Sadler, Ralf Aschemann, Jiri Dusik, Thomas Fischer, Maria Partidario, and
Rob Verheem (eds.). Handbook of Strategic Environmental Assessment. Earthscan, 2010.
[5] Jens C. Sorensen and Mitchell L. Moss. Procedures and programs to assist in the
impact statement process. Technical report, Univ. of California, Berkely, 1973.
36
A The Primary-Secondary Activities Matrix
The Primary–Secondary Activities matrix taken into consideration at Region Emilia Ro-
magna is a 105 × 105 matrix, where for each activity enlisted in the rows, there is the
amount of how many units of other activities are needed. To make the matrix human-
readable, we split it into four groups: each group lists the whole set of activities, and
their requirements of only a subset of other activities. The four groups are shown in Ta-
bles 4, 5, 6, and 7, respectively.
37
Table4:Primary–SecondaryActivitiesMatrix:FIRSTGROUP
Sewers
Water supply systems
Sewage treatment and wastewater treat-
ment plants
Water purification plants
Waste storage
Incinerators
Torches
Drill cutting treatment plants
Pylons and power line supports
Overhead Power Lines
Underground Power Lines
Electric transformation plants
Wind turbines
Pipelines (oil, steam, gas, etc.)
Gas pipelines pressurization plants
Underground storage tanks for petroleum
gas
Lighting systems
Antennas
Heating / cooling plants
Tunnel ventilation systems
Construction sites (artifacts, traffic)
Housing and residential areas
Squares and yards
Roads (Traffic and artifacts)
1Sewers1
2Watersupplysystems1
3Sewagetreatmentandwastewater
treatmentplants
1
4Waterpurificationplants1
5Wastestorage1
6Incinerators1
7Torches1
8Drillcuttingtreatmentplants1
9Pylonsandpowerlinesupports000000010,9990,0010,000100000,00100,0010,0010,0001
10OverheadPowerLines00000001100,0001000000000
11UndergroundPowerLines1
12Electrictransformationplants1
13Windturbines0000000110,0010,00110000,100,010,010,01
14Pipelines(oil,steam,gas,etc.)0,0010,00110,0001
15Gaspipelinespressurizationplants0,0010,00110,0001
16Undergroundstoragetanksfor
petroleumgas
0,0010,00110,0001
17Lightingsystems0,0010,0010,0001
18Antennas0,0010,0010,00011
19Heating/coolingplants0,10,100,10000,0010,00102000,00110,10,10,0001
20Tunnelventilationsystems0,0010,0010,00110,0001
21Constructionsites(artifacts,traffic)0,0010,0010,00110,0001
22Housingandresidentialareas0,0010,0010,001110,0001
23Squaresandyards0,0010,0010,0010,0001
24Roads(Trafficandartifacts)0,0010,0010,0010,0001
25Junctions,interchanges0,0010,0010,0010,0001
26Paths0,0010,0010,0010,0001
27Bridgesandviaducts0,0010,0010,0010,0001
28Tunnels0,0010,0010,0010,0001
29Railways(platformsandtraffic)0,0010,0010,0010,0001
30Airports(groundtrafficandartifact
employment)
0,0010,0010,0010,0001
31Cablewaysorskilifts0,0010,0010,0010,0001
32Constructionsitepaths0,0010,0010,0010,0001
33Shipyards,haulageandlaunching
plants
0,0010,0010,0010,0001
34Seaportservices(sanitation,docks
cleaning,...)
0,0010,0010,0010,0001
35Reservoirs,impoundments,artificial
lakesformultipleuses
0,0010,0010,0010,0001
36Dams,dikes,embankments0,0010,0010,0010,0001
37Industrialbuildings,garages,sheds0,0010,0010,0010,0001
38
Table4–Continuedfrompreviouspage:Primary–SecondaryActivitiesMatrix,FIRSTGROUP
Sewers
Water supply systems
Sewage treatment and wastewater treat-
ment plants
Water purification plants
Waste storage
Incinerators
Torches
Drill cutting treatment plants
Pylons and power line supports
Overhead Power Lines
Underground Power Lines
Electric transformation plants
Wind turbines
Pipelines (oil, steam, gas, etc.)
Gas pipelines pressurization plants
Underground storage tanks for petroleum
gas
Lighting systems
Antennas
Heating / cooling plants
Tunnel ventilation systems
Construction sites (artifacts, traffic)
Housing and residential areas
Squares and yards
Roads (Traffic and artifacts)
38Fences(productionareas,contruction
sites,...)
0,0010,0010,0010,0001
39Disposalofobsoletefacilities0,0010,0010,0010,0001
40Landstabilization,slopeconsolidation
works
0,0010,0010,0010,0001
41Cavesandmines0,0010,0010,0010,0001
42Excavationandearthworks0,0010,0010,0010,0001
43Depositsforexcavationmaterial0,0010,0010,0010,0001
44Washingfacilitiesforexcavated
lithoids
0,0010,0010,0010,0001
45Crushers0,0010,0010,0010,0001
46Groundwaterextractionfacilities0,0010,0010,0010,0001
47Gasandoilextractionfacilities0,0010,0010,0010,0001
48Welldrilling0,0010,0010,0010,0001
49Hunting0,0010,0010,0010,0001
50Hydraulicworks0,0010,0010,0010,0001
51Detentionbasins0,0010,0010,0010,0001
52Floodways,deviationcanals0,0010,0010,0010,0001
53Newriverbeds,correctionofexisting
riverbeds
0,0010,0010,0010,0001
54Riverbedswaterproofingandcanaliza-
tion
0,0010,0010,0010,0001
55Dredgingworks,riverbedrecalibration0,0010,0010,0010,0001
56Drainsanddrainingsystemtransfor-
mations
0,0010,0010,0010,0001
57Embankments0,0010,0010,0010,0001
58River’sbanks0,0010,0010,0010,0001
59Constructionsitefordsandwades0,0010,0010,0010,0001
60Groynes0,0010,0010,0010,0001
61Piers,wharfs0,0010,0010,0010,0001
62Cliffs,reefs,revetments0,0010,0010,0010,0001
63Beachnourishment0,0010,0010,0010,0001
64Industrialworksandtransformations0,0010,0010,0010,0001
65Biomassthermoelectricplant0,010,010,10,100110,0010,00100000,100,10,10,001
66Biomassthermalenergyplant0,010,010,10,100110,0010,00101000,1010,10,001
67Naturalgasthermoelectricplant0,0010,01000,1110,0010,001010110,100,10,10,001
68Coal-firedthermoelectricplant0,0010,010,10,10,1110,0010,00101000,100,10,10,001
69Oil-firedthermoelectricplant0,0010,010,10,10,1110,0010,001010000,100,10,10,001
70Hydroelectricplants010000110,0010,00100000,0100,10,10,01
71Mini-Hydroelectricplants01000110,0010,0010000000,010,010,010,0010,001
72Windgenerators0,0010,0010,000100,00010,00010,001
73Photovoltaicplants00000110,0010,001000000000,001
74Plantsforproductionofelectricalen-
ergy,gas,andhotwater
0,000100,0001
39
Table4–Continuedfrompreviouspage:Primary–SecondaryActivitiesMatrix,FIRSTGROUP
Sewers
Water supply systems
Sewage treatment and wastewater treat-
ment plants
Water purification plants
Waste storage
Incinerators
Torches
Drill cutting treatment plants
Pylons and power line supports
Overhead Power Lines
Underground Power Lines
Electric transformation plants
Wind turbines
Pipelines (oil, steam, gas, etc.)
Gas pipelines pressurization plants
Underground storage tanks for petroleum
gas
Lighting systems
Antennas
Heating / cooling plants
Tunnel ventilation systems
Construction sites (artifacts, traffic)
Housing and residential areas
Squares and yards
Roads (Traffic and artifacts)
75Productionofmetalandmetalprod-
ucts
0,000100,0001
76Nonmetallicmineralprocessing0,000100,0001
77Dangeroussubstancetreatmentplants0,000100,00010,0001
78Foodprocessingplants0,000100,0001
79Foodandperishablestockings0,000100,0001
80Dairies0,000100,0001
81Agricultureandforestryworksand
transformations
0,000100,0001
82Organicandintegratedfarming0,000100,0001
83Intensivelivestockfarming0,000100,0001
84Freerangelivestockfarming0,000100,0001
85Cattlestorage0,000100,0001
86Biofuelproductionplants10,10,50,10000000000,000100,010,0010,0001
87Usageofexplosives
88Dangerousmaterialstocking
89Undergroundtankswithpollutingliq-
uids
90Tanks,reservoirswithpollutingliq-
uids
91Hydraulicplants(pipes,pumps,
valves,etc.)
92Heavymaterialmovement
93Externalmovementofdangerousma-
terials
94Internalmovementofdangerousmate-
rials
95Maritimetrade
96Airtrade
97Externalmovementofwaste
98Internalmovementofwaste
99Monitorsystemsforaccidentsandim-
pacts
100Fireextinguishingsystems
101Informationsystems,traningsystems
andDSS
102CertificationsofEnvironmentalquality
103Thermodynamicsolarplants0,10,10,10,010110,0010,00100,001000,01000,10,001
104Solarthermalpanels00,0010000000000000000
105Geothermalsurfaceplants000000000000000000
40
Table5:Primary–SecondaryActivitiesMatrix:SECONDGROUP
Junctions, interchanges
Paths
Bridges and viaducts
Tunnels
Railways (platforms and traffic)
Airports (ground traffic and artifact em-
ployment)
Cableways or ski lifts
Construction site paths
Shipyards, haulage and launching plants
Seaport services (sanitation, docks clean-
ing,...)
Reservoirs, impoundments, artificial lakes
for multiple uses
Dams, dikes, embankments
Industrial buildings, garages, sheds
Fences (production areas, contruction sites,
...)
Disposal of obsolete facilities
Land stabilization, slope consolidation
works
Caves and mines
Excavation and earthworks
Deposits for excavation material
Washing facilities for excavated lithoids
Crushers
Groundwater extraction facilities
Gas and oil extraction facilities
Well drilling
1Sewers
2Watersupplysystems
3Sewagetreatmentandwastewater
treatmentplants
4Waterpurificationplants
5Wastestorage
6Incinerators
7Torches
8Drillcuttingtreatmentplants
9Pylonsandpowerlinesupports0,000100000,00010,00010,100,0010000
10OverheadPowerLines00000000,1000000
11UndergroundPowerLines
12Electrictransformationplants
13Windturbines0,01000000,001100,10000
14Pipelines(oil,steam,gas,etc.)00,10,1
15Gaspipelinespressurizationplants00,10,1
16Undergroundstoragetanksfor
petroleumgas
00,10,1
17Lightingsystems00,10,1
18Antennas00,10,1
19Heating/coolingplants0,00010,000100000,10,10,10000,10
20Tunnelventilationsystems0,00010,00010,000100,10,1
21Constructionsites(artifacts,traffic)0,00010,00010,000100,10,1
22Housingandresidentialareas0,00010,00010,0001010,110,1
23Squaresandyards0,00010,00010,000100,10,1
24Roads(Trafficandartifacts)0,00010,00010,000100,10,1
25Junctions,interchanges10,00010,00010,000100,10,1
26Paths0,00010,00010,000100,10,1
27Bridgesandviaducts0,000110,00010,000100,10,1
28Tunnels0,000110,00010,000100,10,1
29Railways(platformsandtraffic)0,000110,00010,000100,10,1
30Airports(groundtrafficandartifact
employment)
0,000110,00010,000100,10,1
31Cablewaysorskilifts0,000110,00010,000100,10,1
32Constructionsitepaths0,000110,00010,000100,10,1
33Shipyards,haulageandlaunching
plants
0,00010,00010,000100,10,1
34Seaportservices(sanitation,docks
cleaning,...)
0,00010,00010,000100,10,1
35Reservoirs,impoundments,artificial
lakesformultipleuses
0,00010,00010,000100,10,1
36Dams,dikes,embankments0,00010,00010,0001010,10,1
37Industrialbuildings,garages,sheds0,00010,00010,000100,10,1
41
DSS Requirements for Regional Planning

More Related Content

Similar to DSS Requirements for Regional Planning

Cesar working document 3 urban strategy experiment 2
Cesar working document 3 urban strategy experiment 2Cesar working document 3 urban strategy experiment 2
Cesar working document 3 urban strategy experiment 2Marco
 
Role of data in Climate Change Adaptation - Maddalena Dali, DG CLIMA
Role of data in Climate Change Adaptation - Maddalena Dali, DG CLIMARole of data in Climate Change Adaptation - Maddalena Dali, DG CLIMA
Role of data in Climate Change Adaptation - Maddalena Dali, DG CLIMAOECD Governance
 
Project Clean Lake, Appendix 3 Green Infrastructure Anticipated Co-Benefits A...
Project Clean Lake, Appendix 3 Green Infrastructure Anticipated Co-Benefits A...Project Clean Lake, Appendix 3 Green Infrastructure Anticipated Co-Benefits A...
Project Clean Lake, Appendix 3 Green Infrastructure Anticipated Co-Benefits A...Northeast Ohio Regional Sewer District
 
ENERGY EFFICIENCY EVALUAITON_CONCEPTS & BEST PRACTICES
ENERGY EFFICIENCY EVALUAITON_CONCEPTS & BEST PRACTICESENERGY EFFICIENCY EVALUAITON_CONCEPTS & BEST PRACTICES
ENERGY EFFICIENCY EVALUAITON_CONCEPTS & BEST PRACTICESCharles Xu
 
H2020 Work Programme 2018-2020 for Future and Emerging Technologies (FET)
H2020 Work Programme 2018-2020 for Future and Emerging Technologies (FET)H2020 Work Programme 2018-2020 for Future and Emerging Technologies (FET)
H2020 Work Programme 2018-2020 for Future and Emerging Technologies (FET)KTN
 
ARIADNE: Final innovation agenda and action plan
ARIADNE: Final innovation agenda and action planARIADNE: Final innovation agenda and action plan
ARIADNE: Final innovation agenda and action planariadnenetwork
 
Ap dung cac cong cu PRA
Ap dung cac cong cu PRAAp dung cac cong cu PRA
Ap dung cac cong cu PRAforeman
 
Item 5a_GPIP overview_D.Simek_OECD.pdf
Item 5a_GPIP overview_D.Simek_OECD.pdfItem 5a_GPIP overview_D.Simek_OECD.pdf
Item 5a_GPIP overview_D.Simek_OECD.pdfOECD Environment
 
TA-7779 Introduction to High level
TA-7779 Introduction to High levelTA-7779 Introduction to High level
TA-7779 Introduction to High levelSon Ha-Dang
 
Cesar working document 6 us experiment 4
Cesar working document 6 us experiment 4Cesar working document 6 us experiment 4
Cesar working document 6 us experiment 4Marco
 
Risk management and identification of side effects
Risk management and identification of side effectsRisk management and identification of side effects
Risk management and identification of side effectsOlgaRodrguezLargo
 
CCXG Global Forum March 2018, Transparency of reporting in technology support...
CCXG Global Forum March 2018, Transparency of reporting in technology support...CCXG Global Forum March 2018, Transparency of reporting in technology support...
CCXG Global Forum March 2018, Transparency of reporting in technology support...OECD Environment
 
Evaluation and Monitoring of Transboundary Aspects of Maritime Spatial Planni...
Evaluation and Monitoring of Transboundary Aspects of Maritime Spatial Planni...Evaluation and Monitoring of Transboundary Aspects of Maritime Spatial Planni...
Evaluation and Monitoring of Transboundary Aspects of Maritime Spatial Planni...Pan Baltic Scope / Baltic SCOPE
 
SUNSHINE short overview of the project and its objectives
SUNSHINE short overview of the project and its objectives SUNSHINE short overview of the project and its objectives
SUNSHINE short overview of the project and its objectives Raffaele de Amicis
 

Similar to DSS Requirements for Regional Planning (20)

Cesar working document 3 urban strategy experiment 2
Cesar working document 3 urban strategy experiment 2Cesar working document 3 urban strategy experiment 2
Cesar working document 3 urban strategy experiment 2
 
Role of data in Climate Change Adaptation - Maddalena Dali, DG CLIMA
Role of data in Climate Change Adaptation - Maddalena Dali, DG CLIMARole of data in Climate Change Adaptation - Maddalena Dali, DG CLIMA
Role of data in Climate Change Adaptation - Maddalena Dali, DG CLIMA
 
Project Clean Lake, Appendix 3 Green Infrastructure Anticipated Co-Benefits A...
Project Clean Lake, Appendix 3 Green Infrastructure Anticipated Co-Benefits A...Project Clean Lake, Appendix 3 Green Infrastructure Anticipated Co-Benefits A...
Project Clean Lake, Appendix 3 Green Infrastructure Anticipated Co-Benefits A...
 
ENERGY EFFICIENCY EVALUAITON_CONCEPTS & BEST PRACTICES
ENERGY EFFICIENCY EVALUAITON_CONCEPTS & BEST PRACTICESENERGY EFFICIENCY EVALUAITON_CONCEPTS & BEST PRACTICES
ENERGY EFFICIENCY EVALUAITON_CONCEPTS & BEST PRACTICES
 
SDS Impact Report: Haven for Hope
SDS Impact Report: Haven for HopeSDS Impact Report: Haven for Hope
SDS Impact Report: Haven for Hope
 
H2020 Work Programme 2018-2020 for Future and Emerging Technologies (FET)
H2020 Work Programme 2018-2020 for Future and Emerging Technologies (FET)H2020 Work Programme 2018-2020 for Future and Emerging Technologies (FET)
H2020 Work Programme 2018-2020 for Future and Emerging Technologies (FET)
 
ARIADNE: Final innovation agenda and action plan
ARIADNE: Final innovation agenda and action planARIADNE: Final innovation agenda and action plan
ARIADNE: Final innovation agenda and action plan
 
Ap dung cac cong cu PRA
Ap dung cac cong cu PRAAp dung cac cong cu PRA
Ap dung cac cong cu PRA
 
Item 5a_GPIP overview_D.Simek_OECD.pdf
Item 5a_GPIP overview_D.Simek_OECD.pdfItem 5a_GPIP overview_D.Simek_OECD.pdf
Item 5a_GPIP overview_D.Simek_OECD.pdf
 
TA-7779 Introduction to High level
TA-7779 Introduction to High levelTA-7779 Introduction to High level
TA-7779 Introduction to High level
 
EMPOWERING_D6.3
EMPOWERING_D6.3EMPOWERING_D6.3
EMPOWERING_D6.3
 
Cbp Sem Inception Meeting May 09
Cbp   Sem Inception Meeting May 09Cbp   Sem Inception Meeting May 09
Cbp Sem Inception Meeting May 09
 
Project management
Project managementProject management
Project management
 
Evaluations of SEAPs: strengths and weaknesses - Melica
Evaluations of SEAPs: strengths and weaknesses - MelicaEvaluations of SEAPs: strengths and weaknesses - Melica
Evaluations of SEAPs: strengths and weaknesses - Melica
 
Cesar working document 6 us experiment 4
Cesar working document 6 us experiment 4Cesar working document 6 us experiment 4
Cesar working document 6 us experiment 4
 
Risk management and identification of side effects
Risk management and identification of side effectsRisk management and identification of side effects
Risk management and identification of side effects
 
CCXG Global Forum March 2018, Transparency of reporting in technology support...
CCXG Global Forum March 2018, Transparency of reporting in technology support...CCXG Global Forum March 2018, Transparency of reporting in technology support...
CCXG Global Forum March 2018, Transparency of reporting in technology support...
 
Evaluation and Monitoring of Transboundary Aspects of Maritime Spatial Planni...
Evaluation and Monitoring of Transboundary Aspects of Maritime Spatial Planni...Evaluation and Monitoring of Transboundary Aspects of Maritime Spatial Planni...
Evaluation and Monitoring of Transboundary Aspects of Maritime Spatial Planni...
 
EIA TECHNIQUES.pptx
EIA TECHNIQUES.pptxEIA TECHNIQUES.pptx
EIA TECHNIQUES.pptx
 
SUNSHINE short overview of the project and its objectives
SUNSHINE short overview of the project and its objectives SUNSHINE short overview of the project and its objectives
SUNSHINE short overview of the project and its objectives
 

Recently uploaded

shot list for my tv series two steps back
shot list for my tv series two steps backshot list for my tv series two steps back
shot list for my tv series two steps back17lcow074
 
办理学位证(SFU证书)西蒙菲莎大学毕业证成绩单原版一比一
办理学位证(SFU证书)西蒙菲莎大学毕业证成绩单原版一比一办理学位证(SFU证书)西蒙菲莎大学毕业证成绩单原版一比一
办理学位证(SFU证书)西蒙菲莎大学毕业证成绩单原版一比一F dds
 
Mookuthi is an artisanal nose ornament brand based in Madras.
Mookuthi is an artisanal nose ornament brand based in Madras.Mookuthi is an artisanal nose ornament brand based in Madras.
Mookuthi is an artisanal nose ornament brand based in Madras.Mookuthi
 
PORTAFOLIO 2024_ ANASTASIYA KUDINOVA
PORTAFOLIO   2024_  ANASTASIYA  KUDINOVAPORTAFOLIO   2024_  ANASTASIYA  KUDINOVA
PORTAFOLIO 2024_ ANASTASIYA KUDINOVAAnastasiya Kudinova
 
Call Girls Satellite 7397865700 Ridhima Hire Me Full Night
Call Girls Satellite 7397865700 Ridhima Hire Me Full NightCall Girls Satellite 7397865700 Ridhima Hire Me Full Night
Call Girls Satellite 7397865700 Ridhima Hire Me Full Nightssuser7cb4ff
 
Call Girls in Okhla Delhi 💯Call Us 🔝8264348440🔝
Call Girls in Okhla Delhi 💯Call Us 🔝8264348440🔝Call Girls in Okhla Delhi 💯Call Us 🔝8264348440🔝
Call Girls in Okhla Delhi 💯Call Us 🔝8264348440🔝soniya singh
 
FiveHypotheses_UIDMasterclass_18April2024.pdf
FiveHypotheses_UIDMasterclass_18April2024.pdfFiveHypotheses_UIDMasterclass_18April2024.pdf
FiveHypotheses_UIDMasterclass_18April2024.pdfShivakumar Viswanathan
 
昆士兰大学毕业证(UQ毕业证)#文凭成绩单#真实留信学历认证永久存档
昆士兰大学毕业证(UQ毕业证)#文凭成绩单#真实留信学历认证永久存档昆士兰大学毕业证(UQ毕业证)#文凭成绩单#真实留信学历认证永久存档
昆士兰大学毕业证(UQ毕业证)#文凭成绩单#真实留信学历认证永久存档208367051
 
Passbook project document_april_21__.pdf
Passbook project document_april_21__.pdfPassbook project document_april_21__.pdf
Passbook project document_april_21__.pdfvaibhavkanaujia
 
NO1 Famous Amil Baba In Karachi Kala Jadu In Karachi Amil baba In Karachi Add...
NO1 Famous Amil Baba In Karachi Kala Jadu In Karachi Amil baba In Karachi Add...NO1 Famous Amil Baba In Karachi Kala Jadu In Karachi Amil baba In Karachi Add...
NO1 Famous Amil Baba In Karachi Kala Jadu In Karachi Amil baba In Karachi Add...Amil baba
 
Call Us ✡️97111⇛47426⇛Call In girls Vasant Vihar༒(Delhi)
Call Us ✡️97111⇛47426⇛Call In girls Vasant Vihar༒(Delhi)Call Us ✡️97111⇛47426⇛Call In girls Vasant Vihar༒(Delhi)
Call Us ✡️97111⇛47426⇛Call In girls Vasant Vihar༒(Delhi)jennyeacort
 
专业一比一美国亚利桑那大学毕业证成绩单pdf电子版制作修改#真实工艺展示#真实防伪#diploma#degree
专业一比一美国亚利桑那大学毕业证成绩单pdf电子版制作修改#真实工艺展示#真实防伪#diploma#degree专业一比一美国亚利桑那大学毕业证成绩单pdf电子版制作修改#真实工艺展示#真实防伪#diploma#degree
专业一比一美国亚利桑那大学毕业证成绩单pdf电子版制作修改#真实工艺展示#真实防伪#diploma#degreeyuu sss
 
Call In girls Bhikaji Cama Place 🔝 ⇛8377877756 FULL Enjoy Delhi NCR
Call In girls Bhikaji Cama Place 🔝 ⇛8377877756 FULL Enjoy Delhi NCRCall In girls Bhikaji Cama Place 🔝 ⇛8377877756 FULL Enjoy Delhi NCR
Call In girls Bhikaji Cama Place 🔝 ⇛8377877756 FULL Enjoy Delhi NCRdollysharma2066
 
8377877756 Full Enjoy @24/7 Call Girls in Nirman Vihar Delhi NCR
8377877756 Full Enjoy @24/7 Call Girls in Nirman Vihar Delhi NCR8377877756 Full Enjoy @24/7 Call Girls in Nirman Vihar Delhi NCR
8377877756 Full Enjoy @24/7 Call Girls in Nirman Vihar Delhi NCRdollysharma2066
 
定制(RMIT毕业证书)澳洲墨尔本皇家理工大学毕业证成绩单原版一比一
定制(RMIT毕业证书)澳洲墨尔本皇家理工大学毕业证成绩单原版一比一定制(RMIT毕业证书)澳洲墨尔本皇家理工大学毕业证成绩单原版一比一
定制(RMIT毕业证书)澳洲墨尔本皇家理工大学毕业证成绩单原版一比一lvtagr7
 
Top 10 Modern Web Design Trends for 2025
Top 10 Modern Web Design Trends for 2025Top 10 Modern Web Design Trends for 2025
Top 10 Modern Web Design Trends for 2025Rndexperts
 
办理(宾州州立毕业证书)美国宾夕法尼亚州立大学毕业证成绩单原版一比一
办理(宾州州立毕业证书)美国宾夕法尼亚州立大学毕业证成绩单原版一比一办理(宾州州立毕业证书)美国宾夕法尼亚州立大学毕业证成绩单原版一比一
办理(宾州州立毕业证书)美国宾夕法尼亚州立大学毕业证成绩单原版一比一F La
 
VIP Call Girls Service Bhagyanagar Hyderabad Call +91-8250192130
VIP Call Girls Service Bhagyanagar Hyderabad Call +91-8250192130VIP Call Girls Service Bhagyanagar Hyderabad Call +91-8250192130
VIP Call Girls Service Bhagyanagar Hyderabad Call +91-8250192130Suhani Kapoor
 

Recently uploaded (20)

Cheap Rate ➥8448380779 ▻Call Girls In Iffco Chowk Gurgaon
Cheap Rate ➥8448380779 ▻Call Girls In Iffco Chowk GurgaonCheap Rate ➥8448380779 ▻Call Girls In Iffco Chowk Gurgaon
Cheap Rate ➥8448380779 ▻Call Girls In Iffco Chowk Gurgaon
 
shot list for my tv series two steps back
shot list for my tv series two steps backshot list for my tv series two steps back
shot list for my tv series two steps back
 
办理学位证(SFU证书)西蒙菲莎大学毕业证成绩单原版一比一
办理学位证(SFU证书)西蒙菲莎大学毕业证成绩单原版一比一办理学位证(SFU证书)西蒙菲莎大学毕业证成绩单原版一比一
办理学位证(SFU证书)西蒙菲莎大学毕业证成绩单原版一比一
 
Mookuthi is an artisanal nose ornament brand based in Madras.
Mookuthi is an artisanal nose ornament brand based in Madras.Mookuthi is an artisanal nose ornament brand based in Madras.
Mookuthi is an artisanal nose ornament brand based in Madras.
 
PORTAFOLIO 2024_ ANASTASIYA KUDINOVA
PORTAFOLIO   2024_  ANASTASIYA  KUDINOVAPORTAFOLIO   2024_  ANASTASIYA  KUDINOVA
PORTAFOLIO 2024_ ANASTASIYA KUDINOVA
 
Call Girls Satellite 7397865700 Ridhima Hire Me Full Night
Call Girls Satellite 7397865700 Ridhima Hire Me Full NightCall Girls Satellite 7397865700 Ridhima Hire Me Full Night
Call Girls Satellite 7397865700 Ridhima Hire Me Full Night
 
Call Girls in Okhla Delhi 💯Call Us 🔝8264348440🔝
Call Girls in Okhla Delhi 💯Call Us 🔝8264348440🔝Call Girls in Okhla Delhi 💯Call Us 🔝8264348440🔝
Call Girls in Okhla Delhi 💯Call Us 🔝8264348440🔝
 
FiveHypotheses_UIDMasterclass_18April2024.pdf
FiveHypotheses_UIDMasterclass_18April2024.pdfFiveHypotheses_UIDMasterclass_18April2024.pdf
FiveHypotheses_UIDMasterclass_18April2024.pdf
 
昆士兰大学毕业证(UQ毕业证)#文凭成绩单#真实留信学历认证永久存档
昆士兰大学毕业证(UQ毕业证)#文凭成绩单#真实留信学历认证永久存档昆士兰大学毕业证(UQ毕业证)#文凭成绩单#真实留信学历认证永久存档
昆士兰大学毕业证(UQ毕业证)#文凭成绩单#真实留信学历认证永久存档
 
Passbook project document_april_21__.pdf
Passbook project document_april_21__.pdfPassbook project document_april_21__.pdf
Passbook project document_april_21__.pdf
 
Call Girls in Pratap Nagar, 9953056974 Escort Service
Call Girls in Pratap Nagar,  9953056974 Escort ServiceCall Girls in Pratap Nagar,  9953056974 Escort Service
Call Girls in Pratap Nagar, 9953056974 Escort Service
 
NO1 Famous Amil Baba In Karachi Kala Jadu In Karachi Amil baba In Karachi Add...
NO1 Famous Amil Baba In Karachi Kala Jadu In Karachi Amil baba In Karachi Add...NO1 Famous Amil Baba In Karachi Kala Jadu In Karachi Amil baba In Karachi Add...
NO1 Famous Amil Baba In Karachi Kala Jadu In Karachi Amil baba In Karachi Add...
 
Call Us ✡️97111⇛47426⇛Call In girls Vasant Vihar༒(Delhi)
Call Us ✡️97111⇛47426⇛Call In girls Vasant Vihar༒(Delhi)Call Us ✡️97111⇛47426⇛Call In girls Vasant Vihar༒(Delhi)
Call Us ✡️97111⇛47426⇛Call In girls Vasant Vihar༒(Delhi)
 
专业一比一美国亚利桑那大学毕业证成绩单pdf电子版制作修改#真实工艺展示#真实防伪#diploma#degree
专业一比一美国亚利桑那大学毕业证成绩单pdf电子版制作修改#真实工艺展示#真实防伪#diploma#degree专业一比一美国亚利桑那大学毕业证成绩单pdf电子版制作修改#真实工艺展示#真实防伪#diploma#degree
专业一比一美国亚利桑那大学毕业证成绩单pdf电子版制作修改#真实工艺展示#真实防伪#diploma#degree
 
Call In girls Bhikaji Cama Place 🔝 ⇛8377877756 FULL Enjoy Delhi NCR
Call In girls Bhikaji Cama Place 🔝 ⇛8377877756 FULL Enjoy Delhi NCRCall In girls Bhikaji Cama Place 🔝 ⇛8377877756 FULL Enjoy Delhi NCR
Call In girls Bhikaji Cama Place 🔝 ⇛8377877756 FULL Enjoy Delhi NCR
 
8377877756 Full Enjoy @24/7 Call Girls in Nirman Vihar Delhi NCR
8377877756 Full Enjoy @24/7 Call Girls in Nirman Vihar Delhi NCR8377877756 Full Enjoy @24/7 Call Girls in Nirman Vihar Delhi NCR
8377877756 Full Enjoy @24/7 Call Girls in Nirman Vihar Delhi NCR
 
定制(RMIT毕业证书)澳洲墨尔本皇家理工大学毕业证成绩单原版一比一
定制(RMIT毕业证书)澳洲墨尔本皇家理工大学毕业证成绩单原版一比一定制(RMIT毕业证书)澳洲墨尔本皇家理工大学毕业证成绩单原版一比一
定制(RMIT毕业证书)澳洲墨尔本皇家理工大学毕业证成绩单原版一比一
 
Top 10 Modern Web Design Trends for 2025
Top 10 Modern Web Design Trends for 2025Top 10 Modern Web Design Trends for 2025
Top 10 Modern Web Design Trends for 2025
 
办理(宾州州立毕业证书)美国宾夕法尼亚州立大学毕业证成绩单原版一比一
办理(宾州州立毕业证书)美国宾夕法尼亚州立大学毕业证成绩单原版一比一办理(宾州州立毕业证书)美国宾夕法尼亚州立大学毕业证成绩单原版一比一
办理(宾州州立毕业证书)美国宾夕法尼亚州立大学毕业证成绩单原版一比一
 
VIP Call Girls Service Bhagyanagar Hyderabad Call +91-8250192130
VIP Call Girls Service Bhagyanagar Hyderabad Call +91-8250192130VIP Call Girls Service Bhagyanagar Hyderabad Call +91-8250192130
VIP Call Girls Service Bhagyanagar Hyderabad Call +91-8250192130
 

DSS Requirements for Regional Planning

  • 1. Engineering the Policy-making Life Cycle Deliverable 2.1: Decision Support System Requirements Document type: Deliverable Dissemination Level: Public Editor: Michela Milano Document Version: 1.0 Contributing Partners: All Contributing WPs: WP2 Estimated P/M (if applicable): n.a. Date of Completion: 31st of July 2012 Date of Delivery to EC 31st of July 2012 Number of pages: 110 ABSTRACT The aim of this document is to define the requirements of a Decision Support System (DSS) able to support decision makers in the regional planning activity. We first identify common features of different regional plans and define common, general requirements. From the latter, we identify general inputs and outputs that will characterize the core of the DSS for regional planning. Secondly as this project is focussed on the Regional Energy plan, we will use this as an example of these general requirements applied to a specific plan. These requirements stem from a detailed analysis of a set of plans of the Emilia Romagna Region: the Regional Energy Plan, the Transportation Plan, and the Regional Operational Program. Despite very different in nature and in the contained details, these three plans have a common structure and a set of common features. Thus, it is possible to design a general system that can be instantiated on specific plans on a later moment. In this setting, the policy making process should be at the same time (a) consistent with constraints; (b) optimal with respect to given objectives; and (c) assessed to avoid negative impacts on the environment, economy and society. In this document we identify the main ingredients that a Decision Support System has to take into account when aiding the policy maker in his decision process. The project is co-funded by the European Community under the Information and Communication Technologies (ICT) theme of the Seventh Framework Programme (FP7/2007-2013). Grant Agreement n◦288147.
  • 2. Authors of this document: ALL PARTNERS http://www.epolicy-project.eu/ Copyright c by the ePolicy Consortium The ePolicy Consortium consists of the following partners: University of Bologna; University College Cork, National University Ireland, Cork; University of Surrey; INESC Porto, Instituto de Engenharia de Sistemas e Computadores do Porto, Fraunhofer – Gesellschaft zur Foerderung der Angewandten Forschung E.V.; Regione Emila-Romagna; ASTER – Società Consortile per Azioni; Università degli Studi di Ferrara. Possible inaccuracies of information are under the responsibility of the project team. The text reflects solely the views of its authors. The European Commission is not liable for any use that may be made of the information contained therein.
  • 3. Contents 1 Introduction 5 2 Regional Planning and Impact Assessment 6 2.1 The Regional Plan . . . . . . . . . . . . . . . . . . . . . . . . . . . . . . . . . 6 2.2 The Strategic Environmental Assessment . . . . . . . . . . . . . . . . . . . 9 2.3 The Regional Energy Plan . . . . . . . . . . . . . . . . . . . . . . . . . . . . 10 2.4 The Transportation Plan . . . . . . . . . . . . . . . . . . . . . . . . . . . . . 12 2.5 The Regional Operational Programme . . . . . . . . . . . . . . . . . . . . . 15 3 Decision Support System Requirements 17 3.1 Expected Outputs . . . . . . . . . . . . . . . . . . . . . . . . . . . . . . . . . 18 3.2 Requirements for the Global Optimization component . . . . . . . . . . . . 19 3.2.1 Inputs related to the activities . . . . . . . . . . . . . . . . . . . . . . 19 3.2.2 Inputs related to the impacts . . . . . . . . . . . . . . . . . . . . . . 19 3.2.3 Inputs linked to the regional objectives . . . . . . . . . . . . . . . . 20 3.2.4 Inputs related to socio-geographical aspects and best practices . . . 20 3.3 Requirements for the ePolicy Social Simulation component . . . . . . . . . 21 3.3.1 Connection to Global Level Optimization . . . . . . . . . . . . . . . 21 3.3.2 Connection to Visual Analytics . . . . . . . . . . . . . . . . . . . . . 22 3.3.3 Connection to Game Theory Interaction . . . . . . . . . . . . . . . . 23 3.3.4 Data-Formats of In- and Output . . . . . . . . . . . . . . . . . . . . 23 3.4 Requirements for the Opinion Mining component . . . . . . . . . . . . . . 25 3.4.1 The Inference Module . . . . . . . . . . . . . . . . . . . . . . . . . . 26 3.4.2 The Learning Module . . . . . . . . . . . . . . . . . . . . . . . . . . 26 3.5 Requirements for the Visualization component . . . . . . . . . . . . . . . . 27 3.5.1 Connection to Optimization component . . . . . . . . . . . . . . . . 27 3.5.2 Connection to Agent-based Simulation component . . . . . . . . . 28 3.5.3 Connection to Opinion Mining component . . . . . . . . . . . . . . 28 4 Requirement instantiation for the Regional Energy Plan 28 4.1 Outputs . . . . . . . . . . . . . . . . . . . . . . . . . . . . . . . . . . . . . . . 28 4.2 Inputs for a DSS . . . . . . . . . . . . . . . . . . . . . . . . . . . . . . . . . . 29 4.2.1 Inputs related to the activities . . . . . . . . . . . . . . . . . . . . . . 30 4.2.2 Inputs related to the impacts . . . . . . . . . . . . . . . . . . . . . . 30 4.2.3 Inputs linked to the regional objectives . . . . . . . . . . . . . . . . 31 4.2.4 Inputs related to socio-geographical aspects and best practices . . . 31 5 Use case scenario #1: the RER energy plan 2011-2013 32 6 Use case scenario #2: an “extended” energy plan 33 A The Primary-Secondary Activities Matrix 37 3
  • 4. B The coaxial matrices 50 4
  • 5. 1 Introduction Regional planning is the science of the efficient placement of land use activities and in- frastructures for the sustainable growth of a region. Regional plans are classified into types, such as Agriculture, Forest, Fishing, Energy, Industry, Transport, Waste, Water, Telecommunication, Tourism, Urban and Environmental plans, to name a few. Each plan defines a set of activities that should be carried out to obtain specific objectives. They greatly differ from each other about the objectives and the type of activities, and often they define plans at a different granularity of details. Despite such differences, regional plans share some common characteristics that foster for a uniform treatment in terms of requirements of a Decision Support System (DSS). Roughly speaking, Regional Plans are organized as follows: • Existing situation and previous plan analysis The first step of a regional plan deeply analyses the existing situation and results of previous plans on the same topic. Environmental, social, and economic aspects are considered, and the results of implementation instruments adopted in the past are identified and evaluated. • Objectives and Strategies On the basis of the existing situation, the main objectives and strategies to be reached are identified. Objectives can be derived from EU and national guidelines, exist- ing rules and norms, opinions from citizens and stakeholder participation, regional goals and specific needs. Ex ante evaluation plays a role in this phase. • Priorities and intervention lines To achieve the objectives, the regional plan identifies intervention lines and priori- ties. E.g., the region might decide to invest on industrial research and technology transfer, on renewable energy sources, on land use qualification, etc. Usually, the plans refer to the concept of axis, to indicate different application fields. For each axis specific objectives and activities are identified and planned, and budget is allocated. This is the decisional part of the plan and contains a resource allocation component that is aimed at achieving the objectives by satisfying specific constraints. • Implementation and Monitoring: To foster the objectives identified at the previous step, the Region should define implementation instruments. We can group instruments into four big classes: – regulatory, such as self-regulation by voluntary bodies, or standards imposed by formal standards bodies and legislation; – economic, such as taxes, fees and user-charges, certificate trading, procurement policies, subsidies; – cooperation, such as voluntary agreements, producer and consumer associa- tions; – information, such as labelling schemes, reporting requirements, advice ser- vices and technology transfer. When devising a regional plan, the policy maker has to take into account impacts on the environment, on the economy and on the society. Currently the procedure aimed to 5
  • 6. assess the impacts of a Regional Plan is called Strategic Environmental Assessment [4], and it relates activities defined in the plan to environmental and economic impacts. For example, in the Emilia Romagna Region such assessment procedure is manually im- plemented by environmental experts to check the effects of a given plan or programme. Currently, the impacts evaluation is not applied during the plan/program construction. Rather, it is performed on a given, already instantiated plan. Such approach has a major drawback: taking into account impacts a posteriori enables only corrective interventions that aims to reduce negative effects of one or more wrong planning decisions. Clearly, prevention of negative effects is more desirable than corrective actions applied to already executing plans. The ePolicy project aims to identify general aspects of the Regional Planning activity, namely constraints, impacts, objectives and guidelines that will constitute the Deliverable 2.2. Here we report the initial stage of this global study to identify the main requirements of a decision support system supporting policy makers in their decision making activity. Therefore, this deliverable contains a first preliminary description of the regional plan- ning activity, together with some examples taken from the Regional Energy plans, the Transportation plans and the Operational program (being the last a sort of a meta-plan that regulates resource allocation for other plans). Then, we consider the requirements of the decision support system, that is the decision making component of the ePolicy project. To aid the decision support system, other components are needed, namely: the opinion mining component, that provides ex-ante evaluation of the policy domain from e-participation; the simulation component, that provides the social response to different policy instruments; and the visualization techniques, that provide an intuitive interface for non IT-experts. The requirements for all these components are considered and de- scribed. 2 Regional Planning and Impact Assessment 2.1 The Regional Plan The Regional Plan is the main result of the policy making activities European regions are involved in. Each region has a budget distributed by the Operational Programme (OP): an OP sets out each region priorities for delivering the funds. On the basis of these funds, each region has to define its priorities: e.g., a priority in the energy field is to increase the use of renewable energy sources. Once priorities have been identified, a region should decide which activities to insert in the plan. Activities may be roughly divided into six types: (1) infrastructures and plants; (2) buildings and land use transformations; (3) resources extraction; (4) modifications of hydraulic regimes; (5) industrial transformations; (6) environmental management. 6
  • 7. Also, a magnitude for each activity is decided, describing how much of a given activity is performed. In the case of the Energy Plan, possible activities are energy plants, and their expected outcomes are quantity of energy produced. In case of the Traffic Plan, possible activities are road constructions, while some of their outcomes are congestion reduction in specific areas, or pollutant emission reduction. Regional plans are in general organized with four big chapters: • Part 1: Existing situation and previous plans The current regional situation is analysed and previous plans are considered. For example the regional energy plan REP [3] considers the current energy pro- duction and the current energy consumption in various sectors, namely mobility, households, enterprises, and services. This is called Regional Energy Balance and constitutes the preliminary chapter of the REP. Then, environmental impacts of the current situation are considered in terms of air/water pollutants, impacts on the landscape and other environmental indicators. Social and economic impacts are also considered, for example when a plan affects the creation of employment, pop- ulation wealth, or the technology transfer from research to business. Beside the current situation, also previous plans are considered. Basically, an analy- sis is performed to establish if previous decisions/plans have achieved the desired effects. Such analysis represents a sort of ex-post evaluation and provides useful feedbacks for the current planning activity. • Part 2: Objectives and Strategies On the basis of the existing situation, the main objectives to be achieved are identi- fied. In order to get consistent plans, regional objectives must be identified within a national and European perspective, and they should be compliant with norms and objectives identified at higher decision levels. In this step, the ex-ante evaluation from citizens and stakeholders participation plays an important role. Traditionally, the outcomes of physical meetings of policy makers with stakeholders are collected and taken into account. From both the global and the individual perspectives the main objectives of the plan arise in this stage. Moreover, it is already possible to devise a high level strategic plan, although not fully specified and yet in its initial status. • Part 3: Priorities and intervention lines On the basis of the current situation and to achieve the objectives and the strategic directions previously identified, the regional planners identify intervention lines and priorities. For instance the region might decide to invest on industrial research and technology transfer, on renewable energy sources, on land use qualification, etc. For each axes specific objectives, activities and allocated budget are identified and planned. This is the decisional part of the plan: usually it contains a resource allocation component that aims to achieve the objectives by satisfying specific con- straints. For example, the regional energy plan REP contains 8 axes of interven- tion, namely: (1) Development of a regional energy-related research and education 7
  • 8. infrastructure; (2) Development of the green economy and productive system ri- qualification; (3) Development and energy quality improvement of agricultural sec- tor; (4) Building and urban energy quality improvement qualification; (5) Sustain- able mobility; (6) Rules and norms; (7) Local programs, information and commu- nication; (8)Technical assistance and partnership. Recursively, for each axis specific objectives are identified, activities are planned and budget is allocated. • Part 4: Implementation and Monitoring To foster the activities identified at the previous step, the Region should define im- plementation instruments. We can group instruments into four big classes: regula- tory, economic, cooperation, and information. In this deliverable we are interested in identifying requirements for the decision support system. Therefore, we consider as DSS inputs the results of Parts 1 and 2, while Part 3 and (a subset of) Part 4 are taken to be the core output of the decision strategy we will im- plement. Indeed, the DSS should provide the third part of the regional plan by deciding activities and budget allocation. It should also define implementation strategies that are usually tackled in Part 4. In each plan we consider activities. Each activity ai (i = 1..Na) (where Na is the total number of considered activities) has an outcome Out = (out1, . . . , outNa ) and a C = (c1, . . . , cNa ) vectors where each element is associated to a specific activity and represents the outcome and cost per unit of activity, respectively. Activities are divided into primary and secondary activities. Primary activities are those inserted in the plan since they produce an outcome and partially reach one (or more) objective. For example, in the Regional Energy Plan, the primary activities are energy plans producing as outcome a certain amount of energy. In the Transportation plan, the primary activity is the improvement of public transports that produces as outcome a re- duction on the use of private vehicles (and consequently a reduction in greenhouse gas emissions). Secondary activities are those that are needed to support primary activities but do not produce a measurable outcome that affects the objectives of the regional plan. Secondary activities are considered since they impacts the environment (and also on so- cial and econocmi aspects), and they have a cost. The cost can be either a cost for the public body (say the Region), or a cost for private bodies (enterprises and citizens). For example, if the regional plan envisages some activ- ities to improve the Ravenna port1 , funds should be most probably found in the regional budget. On the contrary, if the action is to improve the production of electric energy by using photovoltaic, then private citizens and enterprises might be the main players for implementing this objective. In the latter case a region can only look for implementation strategies that drive citizens and enterprise to invest into renewable energy sources, and Photovoltaics in particular. There are constraints linking primary and secondary activities: for instance if a regional plan decides to build three biomass power plants (primary activities for an energy plan), 1 Ravenna is a city in the Emilia Romagna Region, placed few kilometres from the Adriatic sea 8
  • 9. each of these plants should be equipped with proper infrastructures (streets, sewage or possibly a small village nearby, power lines), also called secondary activities for an energy plan. Associated to activities we have a matrix of dependencies between activities. In particular we have a Na × Na square matrix D where each element dij represents the magnitude of activity j per unit of activity i. Example 1 Let us consider the Emilia-Romagna Regional Energy Plan approved in 2007. Such plan was the outcome of the policy making process. Among many objectives and requirements, policy makers were requested to provide a plan such that: (1) it ensures the production of a given amount of energy (400 additional MW from renewable energy sources); (2) it reduces the current greenhouse gas emission percentage by 6.5% with respect to 2003 values; (3) budget constraint limits the amount of money allocated to the energy plan by the Regional Operational Programme to e 30.5M (for 2007). 2.2 The Strategic Environmental Assessment The policy maker has to take into account impacts on the environment, on the economy, and on the society, on the basis of a Strategic Environmental Assessment (SEA). The SEA relates activities defined in a plan to environmental and economic impacts, providing an evaluation of how (and how much) a plan affects such aspects. Different solutions and tools have been used to perform the SEA. Among many, we con- sider here a state-of-the-art methodology adopted within the region Emilia-Romagna. This methodology is based on coaxial matrices [1], and it has been developed from the “network method” [5]. In this methodology, each activity affects the environment in terms of positive and neg- ative pressures: an example of positive pressure is the increased availability of energy, while a negative pressure is the production of pollutants. Pressures are themselves linked to environmental receptors such as the quality of the air, or the quality of the surface wa- ter. On both pressures and receptors, there are constraints: e.g., a constraint limits the maximum amount of greenhouse gas emissions of the overall plan. A matrix M defines the dependencies between the above mentioned activities contained in a plan and positive and negative pressures on the environment. Each element mij of the matrix M defines a qualitative dependency between the activity i and the negative or positive impact j. The dependency can be high, medium, low or null. Examples of nega- tive impacts are energy/water/land consumption, variation of water flows, water and air pollution, etc. Examples of positive impacts are reduction of water/air pollution, reduc- tion of greenhouse gas emission, reduction of noise, natural resources savings, creation of new ecosystems, etc. A second matrix N defines how the impacts/pressures influence environmental receptors. Each element nij of the matrix N defines a qualitative dependency between the negative or positive impact i and an environmental receptor j. Again the dependency can be high, medium, low or null. Examples of environmental receptors are the quality of surface water and groundwater, quality of landscapes, energy availability, wildlife wellness. 9
  • 10. The matrices M and N currently used in Emilia Romagna are reported in Appendix I. These matrices have been defined by ARPA Emilia Romagna, a member of the Advisory and Dissemination Board of the ePolicy project and have been studied and refined by UNIBO and UNIFE with ARPA experts. This has been a long process as the number of activities and receptor is high. Example 2 The matrices currently used by ARPA for the SEA for the region Emilia-Romagna contain 93 activities, 29 negative impacts, 19 positive impacts and 23 receptors and assess 11 types of plans. Such matrices are used to evaluate how primary activities affect receptors, taking into account also secondary activities needed by primary ones (as specified by a 93×93 matrix D). The evaluation of how secondary activities affect receptors does take into account also the fact that some secondary activities are needed during the implementation of the primary ones, while others are needed during the functioning of primary activities. Regional Planning and Environmental Assessment are tightly related activities. Despite this strict relation, current practices often consider them as two separate steps, performed sequentially. More precisely, there are a number of issues: 1. to the best of our knowledge, the regional planning activities are usually carried out by human experts. The activity of building a single plan to achieve regional objectives, taking into consideration national and EU guidelines, is performed by humans, and no computer based techniques are exploited. 2. Once a plan has been devised (and only after that), a Strategical Environmental As- sessment is performed by the agency for environmental protection. The assessment evaluates if the devised plan is environmentally friendly or not, and it does not pro- vide feedback on the plan. I.e., the SEA is not intended for changing the plan, but rather to only provide some “quality score” about it. In rare cases, the SEA can propose corrective countermeasures, whose only result is to mitigate the negative impact of wrong planning decisions. 3. Although European and national regulations state that a significant environmen- tal assessment should compare two or more options (different plans), this is rarely done, in Italy as well as in Europe [1]. ePolicy firmly advocates the needs for exploiting the Strategic Environmental Assessment during the planning activity. The aim is to devise plans that already minimise (maximise) negative (positive, respectively) impacts over the receptors. 2.3 The Regional Energy Plan In 2011 the Emilia Romagna Region (RER) has assembled a Regional Energy Plan (REP). The plan has been devised considering a short term horizon (expectations for year 2013), as well as a long term horizon (forecast for year 2020). The plan has been defined accord- ing to a 4-step process: • Evaluation of current situation and trends, and projection of future energy demands for the area. • Formulation of objectives and policies to guide the region toward the goal of an energy-efficient future. 10
  • 11. • Evaluation of options for meeting identified demands; followed by the selection of a flexible “portfolio” of preferred resources for meeting the energy needs. • Design of a short-range plan of specific actions, meant to be the first steps toward the 2020 objective. A vast citizen engagement activity has been conducted by RER and, to some extent, citizen and stakeholder opinions have been acknowledged by the policy makers. The analysis of the current situation has been done on data coming from the last monitoring, performed in 2010. Policy makers have identified eight intervention axis: (a) Development of a regional energy-related research and education infrastructure: this objective is aimed at nurturing the research activity and technology transfer in energy-related fields, to the end of promoting “green economy”. Enabling tech- nologies, products innovation, enabling procedures for energy efficiency and saving should be taken into account. Roughly speaking, the idea is to create a high tech- nology network merging research oriented enterprises. (b) Development of the green economy and productive system re-qualification: an industrial strategy based on sustainability concepts should aim to promote the Emilia Romagna land use. The specific goals in this context are (1) the increase of energetic- environmental sustainability indicators through an increased productive cycle effi- ciency, the use of renewable sources and the management of resources and pro- duction waste residuals; and (2) the encouragement of best practices of enterprises, and the exploitation of the environment and landscape, with particular attention to tourism-appealing areas. (c) Development and energetic qualification of the agricultural sector: the agricul- ture sector has a great impact on the energy production for what concerns both biomasses and photovoltaic. The plan should increase the use of agriculture and zootechny waste, and it should promote the use of photovoltaic on agricultural lands via informative campaigns and via the simplification of the bureaucratic pro- cedures. (d) Buildings and urban energetic qualification: the objective is to drastically reduce the energetic needs of new and renewed buildings, and to promote the energy effi- ciency interventions in all buildings. (e) Sustainable mobility: mobility plays an important role in the energy sector. The REP acknowledges the core objectives of the Regional Transportation plan (see Sec- tion 2.4). (f) Rules and norms: the energy sector is rapidly changing; moreover, the field is reg- ulated by rules and norms coming from different government levels (EU, National, and Regional levels). As a consequence, the whole field regulation is not clear about some aspects (if not inconsistent). In turn, this make it difficult for energy sector players to take decisions and to operate. One aim of the Regional Energy Plan is to promote collaboration between normative bodies and energy sector operators to identify the critical issues. As a concrete activity, the plan envisage the creation of a repository containing all the norms and rules; such repository would be accessible by all the involved parties. 11
  • 12. Power 2010 Power 2013 Energy 2013 Inv. 2013 Power 2020 Energy 2020 Inv. 2020 Electrical power plants (MW) (MW) (kTOE) (Me) Hydroelectric 300 310 69.3 84 330 73.8 204 Photovoltaic 230 850 87.7 2170 2500 258.0 7945 Thermodyn. solar pow. 0 10 1 45 30 3.1 135 Wind generators 20 80 10.3 120 300 38.7 568 Biomasses 430 600 361.2 595 1900 1143.8 5145 Total 980 1850 529.5 3014 5060 1517,4 13989 Table 1: Energy plan developed by the region’s experts for 2011-2013 with a long term objective at 2020 (g) Local programs, information and communication: the aim of this axis is to support activities that enable the diffusion of a novel culture about rational and sustainable use of energy, and for renewable energy source awareness. Informative campaigns are needed to increase the awareness of the importance of best practices in the use of energy. (h) Technical assistance and partnership: the plan promotes an infrastructure for mon- itoring, assessing and managing regional energy policies. An example of output for what concerns renewable energy sources is the following. Example 3 (RER Energy Plan 2011-2013) An excerpt of the Energy Plan of Region Emilia Romagna is shown in Table 1. For each of the energy sources, the plan provides: • the currently installed power, in MW, as of 2010; • the forecast/required installed power for 2013, in MW; • the total energy produced in a year, in kTOE (TOE stands for Tonnes of Oil Equivalent), for 2013; • the total, cumulative cost, in Me, required to be invested (by the private sector, industry, government, etc.) to reach the desired production in 2013; • the forecast/required installed power for 2020, in MW; • the total energy produced in a year, in kTOE (TOE stands for Tonnes of Oil Equivalent), for 2020; • the total cost, in eM, required to be invested (by the private sector, industry, government, etc.) to reach the desired production in 2020; 2.4 The Transportation Plan The Transportation Plan is a long term plan headed towards the year 2020. Like other plans, it has been prepared by assessing the current situation, by identifying the main goals, and by deciding a bunch of options for meeting the future, forecast demands. The current situation has been analysed as of 2008, headed to year 2020 with an interme- diate scenario at 2015. The main goals have been identified as being: • to guarantee high accessibility levels, to both people and goods; subsequently, to increase local industries competitiveness and to attract external investments; • to assure high security standards; 12
  • 13. • to guarantee an efficient and effective use of public funds for services and infras- tructures; • to increase life quality within cities and other urban territories; • to achieve a sustainable development of transportation, by reducing energy con- sumption, pollutant emission and local impacts; • to guarantee public transport access to economically disadvantaged population; • to promote citizens participation in the decision making process (for what regards transportation). All the actions have been planned around two main principles: (i) “sustainability of the whole transportation system”, towards the environment, the accessibility to the region territory, the life and health quality, the economic profile, and the citizens participation; and (ii) “management of the mobility demand”, intended as the main tool to address the 2020’s goals and requirements. Differently from the Regional Energy Plan, the Transportation Plan has been organized around the intervention axis: for each of them, specific goals and actions have been iden- tified. Summing up, the intervention axes are: (a) Transportation planning, mobility and the Territorial Planning: the transporta- tion plan must be developed in a tight agreement with the Territorial Development Plan, that identifies a number of social and economic priorities within the region. To this end, “vast regional areas” have been identified, taking into consideration such parameters as intra- and extra-municipality transports, major railway stations, etc. (b) Roadway Infrastructure: after a detailed specification of the existing roadways and the already planned/in construction roadways, the Transportation Plan identifies a number of detailed goals for increasing the overall quality of specific roads. To such ends, guideline have been identified, such as guaranteeing the functionality of the roads, improving the security of the roads, augmenting the urban compatibility, and minimizing the environmental impact. Each action regarding a major road will take into account also the relation with the adjacent area, the relation w.r.t. the avail- able public transports and the traffic throughput/congestions, etc. The planned ac- tions will be of four different types: to increase the security of high traffic roads; to increase the traffic outflow form high traffic roads; small modifications due to geo- logical/hydrological issues; increasing of the accessibility to specific urban sites. (c) Roadway Security: the plan acknowledges the European objective of “zero kills within 2050”, and fixes and intermediate step at 2020, where the number of traffic victims must be half of the current figures. This general goal is then translated into more specific goals, such as the reduction of the use of personal vehicles, the reduc- tion of incorrect behaviours by means of education and controls, the improvement of infrastructures, and incentives to passive/active security means in vehicles. To reach the goals, different type of actions are proposed: – educational activities for the technicians involved at any public administration level, for the adoption of proper design and development tools; – implementation of a regional security registry; 13
  • 14. – interventions to reduce interference between roads and urban areas, and in general to increase the security of roads within urban areas; – identification of priority criteria to simplify funding and minimum require- ments for each planned intervention; – preparation of a two-year report about the security and the roads qualification; – development of the “intelligent road”, in conjunction with the European GPS system Galileo; – activation of the regional centre for Monitoring; – strict monitoring of the implementation of the established interventions; – increase the synergy between different local public administrations. (d) Railway Transport: the regional plan focuses on the following goals: to increase the services, and their quality, especially w.r.t. specific time intervals within the day; to increase the integration among different transport systems, extending such integra- tion also to the billing system; to increase and renew the existing network as well as the railway stations; to increase the information made available to the public. To achieve the previous goal, the Transportation Plan envisages the following actions: – to free the market for the transport services concession, by clearly separating the management of the railway network from the services operated through such network; – to increase the accessibility to the railways stations; – to transform the railway stations into “inter-modality transport nodes”; – to increase the number and the quality of the services; to renew trains and other technical material. (e) Local Public Transport and Inter-modal Transport: the plan envisages to achieve a tighter integration between the many different transportation means. In particular, it aims to: – promote the public transport as the main transport method; – to educate citizens to the ideas of “good mobility”; – to provide them with a unified billing system; – to promote the electrical infrastructure, to support innovative transport means such as electrical vehicles; – to develop information services for the mobility. For each goal, a number of different actions are identified: roughly speaking all the cited goals were already subject of the previous transportation plan. Thus, the current plan envisages actions to strengthen the current objectives. (f) Goods/materials Transportation and Logistic Aspects: the plan recognizes the great importance for the goods transport. However, since the transportation of goods is related to all the aspects of the transport sector, the plan analyses its re- lation w.r.t. to such aspects: for each of them, specific objectives are identified and actions are planned. (g) The Ravenna port: an entire section is dedicated to the situation of the Ravenna2 port. The plan affirms the importance of the port within the mobility of goods: 2 Ravenna is a medium size city sited on the east coast for the Emilia Romagna region 14
  • 15. the objectives can be summarized into increasing the quality and the number of services offered by the port. The planned actions are all focused to increase the port infrastructure. (h) Waterway Transport system: the regional waterway system is of a limited dimen- sion; nevertheless, the plan envisages a number of concrete actions to increase the quality of the waterways, such as the maintenance and the enlarging of the canals, and a tighter integration with other transport modalities. (i) Regional ports: the region recognizes the importance of a (relatively small) number of ports, together with several touristic ports. The plan assumes as main objective the increase of their activity, and the envisaged actions are all focussed to increase the quality of the offered services. (j) Air transport system: the plan takes as main objective the integration of all the regional air transport, and at the same time the increase of the total number of transports (passengers and goods). To this end, the planned actions are about the increase of the airport related services, such as the implementation of dedicated metro services, etc. (k) Intelligent Transport Systems: the plan identifies the use of innovative ICT tools as a key to address many traffic management problems. To this end, the region has started to develop an ICT infrastructure, and the plan envisages specific actions to enforce such regional framework. (l) Overall interference of the plan w.r.t. the environment: the Transportation Plan assesses all the previous intervention axis, w.r.t. to environmental aspects. In par- ticular, the four dimensions of (1) fertile soil consumption, (2) natural area preser- vation, (3) hydro-geological risk, and (4) energy-related aspects are taken into con- sideration. For each one of these dimensions, proper actions are taken into consid- eration, to mitigate the effect of other planned actions. Finally, the Regional Transportation Plan is concluded with a section dedicated to the monitoring of the plan execution, and with some general figures relating to available funds. 2.5 The Regional Operational Programme On 7th of August, 2007, the European Commission approved the Regional Operational Programme (POR) for Italy’s Emilia-Romagna Region for the years 2007-2013. This Pro- gramme comes under the Regional Competitiveness and Employment objective, and it has a total budget of some 347 eM. The assistance provided by the European Union through the Regional Development Fund (ERDF) amounts to nearly 128 eM, which rep- resents around 0.4% of EC contributions to Italy under the cohesion policy for the period 2007-2013. The strategy of the Operational Programme is based mainly on: (i) the regional issues, identified after an analysis of the region’s potential; and (ii) the EC and national strategic frameworks, which set out the principles for the allocation of EC funding. 15
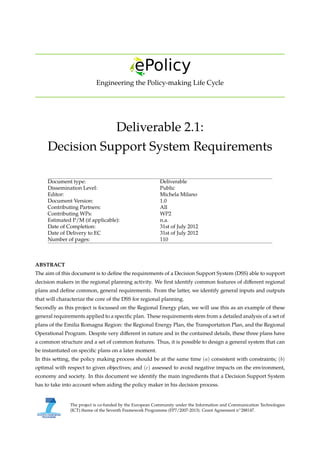
  • 16. In particular, to be “competitive” within a global system, production processes and sys- tems must be reorganised. Accordingly, sustainable development and the strengthening of research and innovation capabilities at both territorial and sectoral levels are at the heart of the region’s strategy. Region Emilia-Romagna is also focusing on promoting eco- logical platforms in industrial zones and on doubling its renewable energy production. The programme thus contributes towards achieving the objectives of the Lisbon Strategy in the field of economic competitiveness and employment. It also aims to: (1) give a sig- nificant boost to research and technology transfer capabilities; (2) increase the support for innovation; and (3) increase the efforts for a sustainable and environmentally friendly development. Consequently, the main areas covered by the programme are research, in- novation, energy and the environment, including better exploitation of the environmental and cultural heritage. The implementation of the programme aims to achieve the following results: increased spending on technological research and development; reduce regional greenhouse gas emissions; increase the current share of renewable energies in energy production; and increase the number of created jobs (with a target of 14,000 units by 2015). The operational programme is divided into five priorities: • Priority 1, Industrial research and technology transfer: this priority is funded with approximately 33% of the total investment, and it promotes industrial research and technology transfer so as to boost competitiveness within the economic system. Consequently, the programme’s aim is to strengthen the regional high-technology network and its connection with the production system. • Priority 2, Entrepreneurial development and innovation: funded with approxi- mately 20% of the total investment, this priority supports innovation in the pro- duction system. The integration of knowledge in production processes is therefore the key element in ensuring the international competitiveness of the region and its industry. • Priority 3, Improved energy and environmental efficiency, and sustainable devel- opment: it focuses on sustainable development, and in particular towards the in- novation in the environment and energy fields. Also, it promotes energy efficiency. This priority has been funded with approximately 23% of the total investment. • Priority 4, Enhancing and better exploiting the environmental and cultural her- itage: funded with approximately 20% of the total investment, it focuses on enhanc- ing and better exploiting the region’s cultural and natural resources so as to make them more attractive. • Priority 5, Technical assistance: it is envisaged for management, monitoring, eval- uation, organisation, information and communication activities. It is funded with approximately 4% of the total investment. The final fund allocation of the POR is depicted in Figure 1. 16
  • 17. 33%   20%   23%   20%   4%   Industrial  research  and   technology  transfer   Entrepreneurial  development   and  innova7on   Improved  energy  and   environmental  efficiency  and   sustainable  development   Enhancing  and  be:er  exploi7ng   the  environmental  and  cultural   heritage   Technical  assistance   Figure 1: Emilia Romagna Regional Operational Programme 2007-2013 3 Decision Support System Requirements Within the ePolicy project, a Decision Support System (DSS) will be developed to support the policy maker in the task of defining a plan. The ePolicy DSS will comprise social agent- based modelling, opinion mining, game theory and mechanism design techniques, and optimization techniques. The Emilia-Romagna Region, as a partner of the ePolicy project, has provided a profound and detailed insight on the process that leads the policy makers to develop a regional plan. Through their expertises, we have identified a number of requisites that the DSS should meet. Such requisites are not focused on technical details, but rather defined in terms of which inputs policy makers can provide, and which outputs they would expect from the DSS. Notice that part of the identified requirements (Sections 3.1, 3.2) stems from the direct experience and current practices. ePolicy however envisages a novel ap- proach where more aspects are taken into considerations. Hence, the remaining part of the requirements (Sections 3.3, 3.4) is related to the novel components taken into account within the project. These requirements will be then instantiated on the Regional Energy Plan that we use as a use case for the ePolicy Project. An overview of inputs and outputs for a DSS is shown in Figure 2. When a policy maker starts the planning activity, he/she must take into account many constraints, objectives, needs and requirements that will lead him/her to identify a possible plan. Some con- straints can be easily expressed in numerical terms, while others are expressed in natural language terms. In the latter case, we present a possible reification of natural language constraints into some numerical form. 17
  • 18. Primary  Ac*vi*es   Costs   Ac*vity  Outcomes   Ac#vi#es  that   compose  the  plan  and   produce  some  output   Cost  of  each  unit  of   ac#vity   Primary  ac#vi#es  have  an   outcome  matching  part  of  the   objec#ve  for  which  it  has  been   inserted  in  the  plan   Square  matrix:  ac#vity  x   ac#vity.  How  many   secondary  ac#vity  to   produce  for  each  unit  of  PA     Primary-­‐Secondary  Act.   Enviromental  impacts   2  matrices:  ac#vi#es/ pressures/  receptors     Economic  impacts   Matrix  ac#vi#es/ economic  indicators     Social  impacts   Matrix  ac#vi#es/ social  indicators     ENVIRONMENTAL   AGENCY   EUROSTAT   Opinion   mining       ePolicy    decision  support  system           Regional  Plan   Impact  of  Policy    instruments   SIMULATOR   Planned  ac*vi*es/policy  Instruments  /investments         Exis*ng  situa*on   Regional  Opera*onal  Progr.   Analisys  of  the   current  situa#on   Budget  constraints   Available  Policy  Instr.   and  Costs   Incen#ves,  regula#on,   informa#on  etc.   Figure 2: High level overview of Inputs and Outputs of a DSS for ePolicy. 3.1 Expected Outputs Roughly speaking, the ultimate goal of a plan is to achieve the regional objectives and priorities through actions and activities that should be compatible with constraints, and at the same time environmentally, socially and economically assessed. To this end, a plan consists of a set of decisions about the following aspects: 1. which types of primary activities should be inserted in the plan, and their magni- tude for each of them; 2. how much money will be assigned to implement these activities. This decision can be split up into different sub-issues: (a) the amount of money to be allocated from the regional budget to fund these activities; (b) the amount of money to be allocated for pushing each different activity imple- mented by citizens and stakeholders; (c) the mechanisms for assigning such incentives (e.g., auctions). From a mathematical perspective, a policy maker has a set of variables, and it is her duty to assign values to such variables. Variables represent decisions that have to be taken. For example, we could have a vector of activities A = (a1, . . . , aNa ). For each activity the policy maker decides also its magnitude Magi, i ∈ [1..Na]. The magnitude could be represented in two ways: in an absolute way, as the amount of a given activity, or in a relative way, as a percentage with respect of the existing quantity of the same activity. In this document we adopt the absolute representation. 18
  • 19. Moreover, for each activity, the policy maker has to decide the amount of financial funds to be used either directly or in the form of incentives, and which mechanisms for each activity type (one or more mechanism for each activity type). 3.2 Requirements for the Global Optimization component When dealing with the regional plan, the policy maker must take into account many different inputs. In the following we provide an overview of different types of inputs that are of interest for global optimization component. Indeed, the expected outcomes for this component are plans that respect all the constraints (provided as inputs), and guarantee the optimal solution with respect to some optimization function (representing the desired outcome, and provided as input). 3.2.1 Inputs related to the activities The first group of input information is related to the activities. Such group of inputs is shown in Figure 2 on the left side of the DSS. We distinguish primary activities from secondary activities. Primary ones are those activities that are of main importance in a given plan, and that directly affect the achieving of a goal. Secondary activities are those supporting the primary ones by providing the needed infrastructures. We envisage the following type of inputs, directly linked to the notion of activity: 1. list of primary activities and, possibly, minimal amounts for each activity 2. function cost: a function for each activity, to determine the cost for each unit of ac- tivity. Notice that the considered cost is the total cost of the activity for the regional system, which is not the same as the cost for the taxpayers of the Emilia-Romagna region. Indeed, the region can enforce policies in many ways, e.g. by convincing private stakeholders to invest in specific activities. In turn, this can be done e.g. with the financial leverage, or by giving favourable conditions (either economic or other) to investors; 3. efficiency function: a function for each activity, to determine the outcome produced per unit of activity; 4. the Primary-Secondary Activity matrix D, that is used to determine, for (the amount of) each activity, which (and how much of) secondary activities are required. 3.2.2 Inputs related to the impacts Each activity affects on one or more receptors. We distinguish between three different sets of impacts, and for each one we envisage a different input. In Figure 2 such inputs are depicted below the DSS. 1. environmental impacts, given in the form of the two matrices activities/pressures and pressures/receptors, as described in Section 2; the impacts might also be sub- ject to some constraints. For example, greenhouse gas emission (that is a negative pressure) could be constrained to lowering a given threshold; 19
  • 20. 2. economic impacts, given in the form of complex activities/economic indicators; ac- tivities indeed have a huge impact on the territory, e.g. creation of temporary/permanent new jobs and new business supporting the activities; 3. social impacts, linked to each different activity type, and provided by opinion min- ing tools (ex-ante). 3.2.3 Inputs linked to the regional objectives Each region has its own specific and peculiar objectives. Some of them are intrinsically determined by the region itself, while other have a more political nature, and are the consequence of political decisions. In Figure 2 such inputs are depicted on the right of the DSS. 1. required/expected outcome: each activity has an outcome. Each plan has an ex- pected outcome that is constrained to be a certain amount; 2. budget constraints: each region has a total amount of funds available to be used both for implementing activities that are fully paid by the Region or as incentives for driving the citizen and stakeholders towards the desired direction; given a budget budPlan available for a given plan, a constraint limits the overall plan costs. This constraint can be posted either on the overall plan, or on parts of it. As an example, let’s suppose the budget has already been partitioned into chapters: then it would be possible to impose the above constraint only on activities related to a given chapter; 3. available policy instruments and costs a feedback about the mechanisms and the amount of incentives, provided by tools such as opinion mining, social agent-based simulation, game theory and mechanism design; 4. political objectives, provided by politicians. For example, a possible (political) pri- ority is to be conformant with European guidelines such as the 20-20-20 initiative3 . 3.2.4 Inputs related to socio-geographical aspects and best practices 1. Specific plan constraints: there are some constraints that are specific for a given plan. An example on energy source diversification will be given in section 4. 2. Social and geographic limits: each region has its own geo-physical characteristics. This poses constraints on the maximum number of activities that can be produced in a specific area. 3. Available policy instruments: the available policy instruments cover a variety of actions that the policy maker has to determine in order to make sure that the policy is indeed implemented. PPA Energy is surveying a number of policy instruments available in Emilia Romagna, in the UK, in Europe and in the US that will be con- tained in deliverable D2.2. 3 The 20-20-20 initiative aims to achieve three ambitious targets by 2020: reducing by 20% its greenhouse gas emissions, having a 20% share of the final energy consumption produced by renewable sources, and improving by 20% its energy efficiency. 20
  • 21. 4. Mechanisms for distributing economic incentives: the Emilia Romagna Region exploited economic incentives distributed to private stakeholders interested to per- form activities. The amount of economic incentives, as well as the way (the mech- anism such incentives are distributed to private stakeholders is an input to be con- sidered. In particular, among many possible mechanisms, e-Policy should evaluate the best one, w.r.t. a certain budget availability. 3.3 Requirements for the ePolicy Social Simulation component The social simulation in the ePolicy project focuses on the simulation of the impact of dif- ferent policy instruments on the adoption of photovoltaic panels at a household level. It is placed logically after the planning-step on the regional level (also referred to as global level in the project). Once planning policies have been determined, through optimisation (e.g. with respect to minimum costs, maximum CO2-reduction, minimum disruption,...) at the level of the region, it then is necessary to apply them. However, what is an optimal policy at the regional level may not be locally or individually optimal. Thus some mech- anism is needed to enforce the policy – one cannot assume that individual agents will adopt the desired behaviours of their own accord. These potential policy instruments could reach from fiscal incentives, via tax incentives and different tariffs to legislation for example4 . All options have disadvantages, and which is best is not clear and will vary from case to case. The social simulation will be used to derive the most effective instru- ments by analysing their impact on a household level. The goal of this endeavour is to cre- ate a multi-level agent-based model with agents representing individual households that will allow policymakers to explore the consequences of different types of policy instru- ment and thus enable them to make better choices. The agents will be given behavioural rules modelling their likely individual responses to policy instruments (including the ef- fect of influences from other actors, e.g. as a result of collective actions, imitation etc.). The overall response to the simulated policy instruments will be measured to inform pol- icymakers. In order to calibrate and validate the model, data will be gathered on actors’ past behaviour (for example, their choices of energy consumption options), on their per- ceptions and opinions (for example, their interest in combating global warming and their sensitivity to energy cost changes), and on their knowledge of the policy relevant actions. After briefly outlining the role of the social simulation in the ePolicy project, this section focuses in the connection of the social simulation to other project components, both on a conceptual (Section Sections 3.3.1, 3.3.2, and 3.3.3) as well as on a data format level (Section 3.3.4). 3.3.1 Connection to Global Level Optimization In Section 3.3 we noted that the role of the social simulation is to analyze the impact of different policy instruments (which are being decided upon at a regional level) on the adoption of photovoltaic panels at a household level. We therefore see the policy instru- 4 Currently a summary report on policy instruments for renewable resources is being drafted by PPA en- ergy. We will use this report for the decision which policy instruments to consider in the social simulation. 21
  • 22. ments decided upon at the regional optimization level as input for the social simulation, which then analyzes the adoption of photovoltaic panels, the resulting costs, etc. that would result from the application of these policy instruments. The recommendations of policy instruments based on the results of the regional optimization hence serve as input for setup of the social simulation setup, i.e. they determine which policy instruments are considered and analysed w.r.t. the households reaction to them. 3.3.2 Connection to Visual Analytics With respect to the visual analytics component of the project the social simulation has one main connection: the visualization of the simulation results. The currently employed simulation platform (Netlogo5 ) has its own visual components that allows the display of the results in form of graphs and animated maps of the region while the simulation runs. Figure 3 shows an example of such a Netlogo visualization with GIS information of the Emilia Romagna region6 and Figure 4 the visualization of the adoption of photovoltaic by households over time. Figure 3: Example of Netlogo Visualization (GIS) The Netlogo visualizations are typically conducted per experimental run and can be logged externally (more information about this can be found in Section 3.3.4). We therefore see the role of visual analytics as being in the reprocessing of the results of the individual runs, the incorporation of the relation between simulation setup and simulation results, the comparison of simulation experiments with slightly different setups and the presen- tation of consolidated results in a form that is easily understandable for the stakeholders 5 http://ccl.northwestern.edu/netlogo/ 6 The green points represent households which have already adopted photovoltaic, whereas the black points refer to households that use other energy resources. 22
  • 23. Figure 4: Example of Netlogo Visualization (Simple Plot) of the decision support system (e.g. policy makers). The social simulation therefore pro- vides the visual analytics components with simulation results (which will vary according to the input parameters of the simulation). 3.3.3 Connection to Game Theory Interaction Whereas the connection of the social simulation has been clearly defined for the visual analytics and global optimization component, with respect to the game theory compo- nent the connection is less clear. The focus of the game theory group at the moment is on mechanism design for auctions. As previous grants in the Emilia Romagna Region have been allocated with the help of auctions they want to look deeper into this distribu- tion tool for the policy instrument of fiscal incentives by designing an auction mechanism that optimizes the allocation of resources (grants) to those households which benefit most from them. If—on the global optimization level—the policy instrument of fiscal incen- tives is chosen (which is then given to the social simulation as input), one option for the connection of the two components is to incorporate the auction mechanisms in the social simulation. This is envisioned as follows: if an auction for grants to support the installa- tion of photovoltaic panels is announced, the agents aware of this auction can decide to put forward bids for the auction. The auction mechanism then decides which agents win the auction (i.e. obtain a grant) and feeds this information back to the agents. The agents then incorporate the result of the auction (getting or not getting a grant) into their deci- sion making w.r.t. installing photovoltaic (the agents that have received a grant have to install a photovoltaic system, whereas the other agents can decide to do so or not based on their personal preferences). Summing up this idea, the social simulation would provide input to the game theory component in form of bids (by agents) for the grant auction and would get decision about the success of the bids back as output from the game theory component. This output is then incorporated as information input for the simulation. 3.3.4 Data-Formats of In- and Output For the social simulation the tool Netlogo will be used. NetLogo is an agent-based pro- gramming language and integrated modeling environment. When performing a social simulation, similar to any other scientific experiment, one wants to observe the behaviour of the system (the simulation) with respect to the parameter- 23
  • 24. setup of the simulation. Rephrasing this, one wants to analyze the relation between the input (parameter-specification) of the simulation and its output (emergent system prop- erties). These parameters can for example be numeric values (e.g. the number of agents to be modelled), boolean values (e.g. whether a particular policy instrument shall be used or not) or proportions (e.g. percentage of people that already have a photovoltaic system). From the input perspective, Netlogo allows for two main ways to alter parameters of a simulation setup: (i) changing the parameters by hand before each simulation experi- ment, or (ii) using a tool to automate this process. Due to the large number of experiments that we aim to perform, we shall use the second option. For this purpose a feature built into Netlogo called “BehaviourSpace” is typically used (see Figure 5). Figure 5: The Netlogo BehaviourSpace Using the dialog shown in Figure 5, the value for each parameter can be specified using the simple form [“parameter name” [value1 value2 ...]] and once all parameters have been defined, experiments sweeping through all possible parameter combinations can be performed7 . For each of the experimental runs with one parameter combination, the results of the simulation experiment are written to output files that can be specified by 7 In Netlogo the specification of parameter values does not need to be done through the interface of the 24
  • 25. x y 01-2013 1298 02-2013 1659 03-2013 1819 04-2013 1892 05-2013 1935 06-2013 1964 Table 2: Number of Households with Photovoltaic Systems the user of the simulation. These output files are typically csv-files that track output parameters that are of interest to the simulating person over time. One output parameter that is of interest for the social simulation is the total number of households adopting photovoltaic systems over time. Table 2 shows what the logged output for this parameter might look like: The x-variable in Table 2 indicates the time (MM-YYYY), and the y-variable, the total number of households having a photovoltaic system. Using this information, one could, for example, develop theories of the dissemination of photovoltaic systems over time. 3.4 Requirements for the Opinion Mining component The overall goal of the opinion mining component (OP) is to infer the sentiment of the population/society towards some topic. This will essentially consist of a numeric score in the interval [−2, 2], with negative (positive) values indicating negative (positive) senti- ment. The inferred score will be used as one of many factors in the simulation module of the ePolicy DSS. For this inference to be possible several key aspects need to be defined a priori. Namely, two of the main decisions are: • The sources from where the sentiment will be inferred • The topics for which we are interested in obtaining the sentiment The sources are essentially Web 2.0 platforms that allow users (the population) to express their opinions on energy related topics through textual messages. The topics are a list of subjects that we consider relevant within the field of energy policy making. Although these two issues need not be closed, at each point in time, they need to be fixed. This requirement results from the way the OP system will work. This system will have two main working modules, with different requirements in terms of interface and integration with the general DSS: BehaviourSpace program, but this is the most common way. Other options include reading values from Excel or CSV-files, or programming parameter sweeps into the NetLogo program itself. 25
  • 26. • Inference module • Learning module The inference module must be coupled with the general DSS and is the only module that "standard" users will see. This module will be responsible for obtaining a sentiment score regards topic i at any time t. This will be inferred using sentiment prediction models that where previously developed by the learning module. The learning module does not need to be integrated with the general DSS as it will be executed offline with the goal of obtaining the prediction models that will be used by the inference module. 3.4.1 The Inference Module The inference module should be coupled with the general DSS. Its task is to obtain a sentiment score regarding a certain topic. The requirements of the inference module are the following. At the most basic level of interaction the user will ask at time t for the sentiment score of the population concerning a topic i. As a result the module should return a numeric sentiment score. This assumes the existence of a fixed set of available topics for which prediction models were previously obtained by the learning module, using another fixed set of Web sources. At a higher level of interaction one can assume that the user also specifies a certain past time window which is to be used to infer the sentiment. In this context, the inference module will only use the documents/news/posts available in that time window to reach a global sentiment score. In terms of computation, the task of the inference module is to try to predict the sentiment score for a set of documents and then somehow aggregate these individual predictions into a single sentiment of the population. In principle, given that the prediction mod- els are assumed to be obtained before in a offline manner by the learning module, the sentiment inference task should have a small computational cost. 3.4.2 The Learning Module The learning module is responsible for obtaining sentiment prediction models that will be used by the inference module. It is essentially a text mining tool that, given a set of textual sources, obtains a model that can be used to infer the sentiment of new texts regards a certain topic. Given the difficulty in constructing large data sets with documents previously tagged concerning the sentiment by a domain expert, we will consider several learning methodologies with the goal of overcoming this difficulty. The learning module does not need to be coupled with the general DSS. It can be executed by a kind of system administrator under certain conditions. These conditions may vary but they can include: i) need for models for a new topic; ii) need to include new Web sources of data; iii) need for updating the prediction models with more recent data; etc. In terms of requirements the learning module receives as inputs a set of textual docu- ments (labelled or not concerning the sentiment score) and a target topic, and produces 26
  • 27. as output a prediction model. Obtaining the sentiment prediction models for a set of topics using a set of textual sources should be a computationally very demanding task. 3.5 Requirements for the Visualization component The visualization component will address three main tasks, and therefore support the user at three different levels: • Giving non-expert IT users an intuitive access to information and results coming from the components of the technical work packages. Get overview. • Provide analysts a visualization tool to explore the dependencies between the pa- rameters of each technical component’s model and its output. Analyse alternatives. • Provide on overview of the integration of all technical components and their inter- dependencies. Supervise overall workflow. To address these tasks, it will be connected to the technical components of the other work packages. These are mainly the optimization, the agent-based simulation, and the opin- ion mining component. In the following, the connection of the visualization component to these three components is described. Respectively, the other components’ input and output to be used by the visualization component is specified, and the control flow is regarded. 3.5.1 Connection to Optimization component As described in Section 3 the optimization component analyses the policy situation from a global level perspective. Input parameters to be specified by the users are • the target function (e.g. minimize costs, maximize energy production, etc.) • constraints on optimization problem (e.g. budget constraints, maximum value of air pollution, etc.) The output consists of the types of primary activities to be inserted in the plan, and the magnitude for each of them. Moreover, a matrix describing the influences of each activity on environmental, economical, and social impacts will be provided. At a first stage, the visualization component will provide the user a visual access to the output generated by the optimization component with fixed parameter setup. Therefore the output data and the associated parameter setup has to be made accessible for the visualization component (e.g. via a database). In a later stage, the visualization component will provide a graphical user interface that enables the user to visual-interactively specify the input parameters for the optimization components, and analyse the resulting output. Therefore a control flow from the visual- ization to the optimization component has to be resolved and the output data has to be provided in order to realize the analysis of dependencies between input and output data. Several optimization runs with different parameters and associated output data have to be accessed, e.g. via a database, to enable a performant workflow. 27
  • 28. 3.5.2 Connection to Agent-based Simulation component The main connection to the simulation component is the visualization of the simulation results (see also section 3.3. The policy analysts will be provided with an intuitive access to simulation results. The associated data has to be provided to the visualization tool, e.g., via a database. In a second development stage the visual-interactive analysis of the interdependencies between the different (input) parameter setups and the associated simulation results (out- put) will be addressed. Therefore, the input and output data has to be made accessible by the simulation component (e.g. via a database). 3.5.3 Connection to Opinion Mining component Regarding the opinion mining component, the task of the visualization component is the visual-interactive exploration of public sentiment regarding pre-specified topics. The user will be provided with a visualization, in which the time frames and the topics can be specified by the user. Moreover, additional meta-information, like the web source, or statistical information, like the number of posts, will be visualized. This information has to be made available for the visualization, e.g. via a database. 4 Requirement instantiation for the Regional Energy Plan In this section we ground the general requirements on the Regional Energy Plan. An overview of inputs and outputs for a DSS grounded on this Plan are shown in Figure 6. 4.1 Outputs Roughly speaking, the ultimate goal of an energy plan is to drive the free market of energy production towards the covering of the regional’s energy requirements, and to achieve some political objectives. To this end, an energy plan consists of a set of decisions about the following aspects: 1. which types of energy production systems should be employed, and for each of them their magnitude; 2. how much money will be assigned to push the market (through incentives) towards the desired production of energy, as identified in the previous point. This decision can be split up into two different sub-issues: (a) the amount of money to be allocated for pushing each different energy produc- tion system type, in the form of incentives; (b) the mechanisms for assigning such incentives (e.g., auctions) At a general level the policy maker has to choose which activities, and magnitude, have to be promoted to reach the objectives. In the case of the energy plan, this means to choose which energy sources, together with installed power, have to been “pushed” within the energy market. Moreover, for each chosen energy source, the policy maker has to decide the amount of financial funds to be used in the form of incentives, and which mechanisms for each energy source type (one or more mechanism for each type). 28
  • 29. Primary  Ac*vi*es   Costs   Outcomes   Biomass  power  plants   Photovoltaic  plants   Wind  power  plants  ….   Cost  per  MW  of   energy  produced.   Energy  efficiency  of   each  source.   Square  matrix:   acCvity  x  acCvity     Primary-­‐Secondary  Act.   Enviromental  impacts   2  matrices:  acCviCes/ pressures/  receptors     Economic  impacts   Matrix  acCviCes/ economic  indicators     Social  impacts   Matrix  acCviCes/ social  indicators     ARPA   RAMEA/ISTAT   Opinion   mining       ePolicy    decision  support  system   Regional  Energy  Plan   SIMULATOR   Planned  ac*vi*es  and  investments         Rrgional  Energy  Balance   Regional  Opera*onal  Progr.   Total  Energy  Required   by  the  Region   Budget  constraints   Available  Policy  Instr.   and  Costs   IncenCves,  regulaCon,   informaCon  etc.   Figure 6: High level overview of Inputs and Outputs of a DSS for the Regional Energy Plan. Example 4 (RER Energy Plan 2011-2013) An excerpt of the Energy Plan of Region Emilia Romagna is shown in Table 3. For each of the energy sources, the plan provides: • the currently installed power, in MW, as of 2010; • the forecast/required installed power for 2013, in MW; • the total energy produced in a year, in kTOE (TOE stands for Tonnes of Oil Equivalent), for 2013; • the total cost, in eM, required to be invested (by the private sector, industry, government, etc.) to reach the desired production; Being more precise, the installed power and the produced energy expected for 2013 are linked by a deterministic function8 . Moreover, also the costs/investments for each activity are determined using some deterministic function. 4.2 Inputs for a DSS In the following we provide an overview of different types of inputs, w.r.t. the setting of a regional energy plan. 8 The ratio between installed power and total produced energy is mainly influenced by the availability of the source: while a biomass plant can (at least in theory) produce energy 24/7, the sun is available only during the day, and the wind only occasionally. For unreliable sources, usually an average for the whole year is taken. 29
  • 30. Power 2010 Power 2013 Energy 2013 Investments Electrical power plants (MW) (MW) (kTOE) (Me) Hydroelectric 300 310 69.3 84 Photovoltaic 230 850 87.7 2170 Thermodyn. solar pow. 0 10 1 45 Wind generators 20 80 10.3 120 Biomasses 430 600 361.2 595 Total 980 1850 529.5 3014 Table 3: Energy plan developed by the region’s experts for 2011-2013 4.2.1 Inputs related to the activities The first group of input information is related to the activities. Such group of inputs is shown in Figure 6 on the left side of the DSS. We distinguish primary activities from secondary activities. Primary activities are all those activities that directly produce en- ergy, namely renewable and non-renewable power plants. Secondary activities are those supporting the primary ones by providing the needed infrastructures. We envisage the following type of inputs, directly linked to the notion of activity: 1. list of primary activities (e.g., Biomass plants, photovoltaic plants, wind turbines, etc.) and, possibly, minimal amounts for each activity (e.g., increase by 10% the amount of photovoltaic energy); 2. function cost: a function for each activity, to determine the cost for each MW of energy produced depending on the activity9 ; 3. efficiency function: a function for each activity, to determine the energy produced by each installed MWatt of each activity; 4. the Primary-Secondary Activity matrix D, that is used to determine, for (the amount of) each activity, which (and how much of) secondary activities are required. 4.2.2 Inputs related to the impacts Each activity impacts on one or more receptors. We distinguish between three different sets of impacts, and for each one we envisage a different input. In Figure 6 such inputs are depicted below the DSS. 1. environmental impacts, given in the form of the two matrices activities/pressures and pressures/receptors, as described in Section 2; the impacts might also be sub- 9 The cost of a plant depends mainly on the installed power: a solar plant has an installation cost that depends on the square meters of installed panels, which in their turn can provide some maximum power (peak power). Notice that the considered cost is the total cost of the plant for the regional system, which is not the same as the cost for the taxpayers of the Emilia-Romagna region. Indeed, the region can enforce policies in many ways, convincing private stakeholders to invest in power production. This can be done with the financial leverage, or by giving favourable conditions (either economic or other) to investors. Some power sources are economically profitable, so there is no need for the region to give subsidies. For example, currently in Italy biomasses are economically advantageous for investors, so privates are proposing projects to build biomasses plants. On the other hand, biomasses also produce pollutants, they are not always sustainable (for a discussion on the issue, see [2]) so local committees are rather likely to spawn against the construction of new plants.For these reasons, the number of licenses the region gives to private stakeholders for building biomass-based plants are limited. 30
  • 31. ject to some constraints. For example, greenhouse gas emission (that is a negative pressure) could be constrained to lowering a given threshold; 2. economic impacts, given in the form of complex activities/economic indicators, as provided by the project RAMEA; activities indeed have a huge impact on the terri- tory, e.g. creation of temporary/permanent new jobs and new business supporting the activities; 3. social impacts, linked to each different activity type, and provided by opinion min- ing tools (ex-ante and ex-post). 4.2.3 Inputs linked to the regional objectives Each region like, for example, Emilia Romagna, has its own peculiar objectives. Some of them are intrinsically determined by the region itself, while other have a more polit- ical nature, and are the consequence of political decisions. In Figure 6 such inputs are depicted on the right of the DSS. 1. required/expected outcome: in an energy plan the outcome is the total energy to be expected within the regional boundaries, usually based on some estimation about the energy consumption; 2. budget constraints: each region has a total amount of funds available to be used as incentives for driving the energy market towards the desired direction; given a budget budPlan available for a given plan, a constraint limits the overall plan costs. This constraint can be posted either on the overall plan, or on parts of it. For instance suppose the budget has already been partitioned into chapters, then it would be possible to impose the above constraint only on activities related to a given chapter; 3. feedback about the mechanisms and the amount of incentives, provided by tools such as opinion mining, social agent-based simulation, game theory and mecha- nism design; 4. political objectives, provided by politicians. For example, a possible (political) pri- ority is to be conformant with European guidelines such as the 20-20-20 initiative10 . Such objectives could be translated into constraints on the minimum amount of en- ergy produced by renewable energy sources. 4.2.4 Inputs related to socio-geographical aspects and best practices 1. energy source diversification: the trend to allocate funds should not be directed toward a single energy source, but should cover both renewable and non renewable energy sources. This requirement comes as a best practice, and is supported by several considerations. For example, to be “robust” w.r.t. fluctuations of the price and availability of the various resources. Such input can be considered to be in the form of a constraint about the minimal percentage of the total energy needed to be produced by each energy source. 10 The 20-20-20 initiative aims to achieve three ambitious targets by 2020: reducing by 20% its greenhouse gas emissions, having a 20% share of the final energy consumption produced by renewable sources, and improving by 20% its energy efficiency. 31
  • 32. 2. social and geographic limits: each region has its own geo-physical characteristics. For instance, some regions are particularly windy, while some others are not. Hy- droelectric power plants can be built with a very careful consideration of environ- mental impacts, the most obvious being the inundation of vast areas of land. This poses constraints on the maximum energy that can be produced by a given energy source. 3. mechanisms for distributing economic incentives: to boost the development of en- ergy production plants, the Emilia Romagna Region exploited economic incentives distributed to private stakeholders interested to build plants. The amount of eco- nomic incentives, as well as the way (the mechanism such incentives are distributed to private stakeholders is an input to be considered. In particular, among many possible mechanisms, e-Policy should evaluate the best one, w.r.t. a certain budget availability. 5 Use case scenario #1: the RER energy plan 2011-2013 The Energy Plan of Emilia Romagna Region, for the 2011-2013 years, has been published in 2011, and it is publicly available in [3]11 . The data presented in this Section have been taken from [3], or have been directly provided by RER employees. The following inputs have been taken into consideration when preparing the energy plan: Primary activities and minimum quantity (4.2.1:1) The primary activities that have been identified are: 1. Hydroelectric, with a minimum amount of installed power of 3 MW; 2. Photovoltaic, with a minimum of 400 MW; 3. Thermodynamic Solar Power, with a minimum of 5 MW; 4. Wind generations, with a minimum of 20 MW; 5. Biomasses power plants, with a minimum of 100 MW; Function cost (4.2.1:2) This function provides the estimated cost to realize a certain type of energy production plant. These figures do not comprise the costs related to the functioning of the production plant, but only the costs for realizing the plant. 1. Hydroelectric: 8,400,000e/MW; 2. Photovoltaic: 3,500,000e/MW; 3. Thermodynamic Solar Power: 4,500,000e/MW; 4. Wind generations: 2,000,000e/MW; 5. Biomasses power plants: 3,500,000e/MW; Efficiency Function of each activity (4.2.1:3) This function provides the link between the installed power and the estimated produced energy (in TOE). The function is the result of estimated about the current technologies, and may vary over the years with technology advances. 1. Hydroelectric: 0.2235483871 TOE/MW; 2. Photovoltaic: 0.1031764706 TOE/MW; 3. Thermodynamic Solar Power: 0.1 TOE/MW; 11 This resource is italian only. See in particluar Annex 1. 32
  • 33. 4. Wind generations: 0.12875 TOE/MW; 5. Biomasses power plants: 0.602 TOE/MW; Primary-Secondary activity matrix (4.2.1:4) This input has not been taken into consid- eration for the current energy plan. Environmental Impacts (4.2.2:1) This input has not been taken into consideration for the current energy plan. Economic Impacts (4.2.2:2) This input has not been taken into consideration for the cur- rent energy plan. Social Impacts (4.2.2:3) This input has not been taken into consideration for the current energy plan. Total amount of energy to be produced (4.2.3:1) In the current plan, the total amount of energy to be produced from renewable sources, for the year 2013, will be approxi- matively about 529.5 kTOE. Budget constraints (4.2.3:2) This input has not been taken into consideration for the cur- rent energy plan. Feedback about mechanisms and incentives (4.2.3:3 This input has not been taken into consideration for the current energy plan. Political Objectives (4.2.3:4) The current plan has been defined taking into account the “20-20-20” goal. Once energy requirements for 2013 have been estimated from pre- vious trends about energy consumption, the “20-20-20” goal has been taken into account, thus establishing the energy amount to be achieved by efficiency, and the final quantity (20%) of energy to be produced from renewable sources. Given the current energy production figures (both renewable and non), the amount of energy to be produced has been decided (529.5 kTOE, as mentioned above). Summing up, the current energy plan has been “built” around a political objective: however, there is no reason to consider such link as to be the default for the futures energy plans. It is sure that political objectives will provide some lower/upper bounds for renew- able sources. Energy source Diversification(4.2.4:1) This input has not been taken into consideration for the current energy plan. Social and geographic limits (4.2.4:2) This input has not been taken into consideration for the current energy plan. Incentives and mechanisms (4.2.4:3) This input has not been taken into consideration for the current energy plan. 6 Use case scenario #2: an “extended” energy plan This scenario extend the previous one with novel dimensions and inputs that e-Policy is going to take into account. It is an extension of the data already provided in the previous scenario. Primary-Secondary activity matrix (4.2.1:4) The matrix D is available in Appendix A. Environmental Impacts (4.2.2:1) The matrices assesing the impacts on pressures and re- ceptors are available in Appendix B. 33
  • 34. Economic Impacts (4.2.2:2) At the current stage of the project we do not have (yet) any reliable information about the impacts of a plan versus the economic variables. To this end, we plan to exploit results from the RAMEA project12 , and from the national statistic institute (ISTAT13 ). Social Impacts (4.2.2:3) At the current stage of the project we do not have (yet) any reli- able information about the impacts of a plan versus the economic variables. To this end, we plan to exploit results from the Opinion mining component. Budget constraints (4.2.3:2) Budget constraints have been proved of a certain difficult to be identified. Indeed, the current practices are adopted: • no budget is established at the beginning of the energy planning process. It is reasonable to assume that the budget will be within some interval; such interval is derived by the total budget about the whole region; political and economical factors greatly affects the funds availability; • to boost the implementation of energy production plants, RER usually identi- fies a mechanism about some sort of economic incentive; to-date it has always been an auction-based mechanism; domain experts do not exclude that such a choice may change; • the amount of money available for the mechanism is decided strictly before the starting of the auction, and it is the consequence of many observations and po- litical choices. Its amount is highly variable, and depends by many conditions, most of them quite political and on the (whole region) budget availability; • ePolicy will not consider the current practice, but rather will provide tools for supporting and enhancing a correct planning about energy boosts. To this end, ePolicy will assume an initial budget, and one of ePolicy’s outputs will be about “how to” exploit such budget. Feedback about mechanisms and incentives (4.2.3:3 No data is currently available about the effectiveness of one incentive mechanism (compared to other ones). We plan to collect this information by means of opinion mining techniques, and social simula- tion. Energy source Diversification(4.2.4:1) We will model such input in terms of minimal threshold about installed power for each source. Currently, no lower limits have been identified. However, the model should be able to tackle such constraint. Social and geographic limits (4.2.4:2) We model such input in terms of maximum thresh- old about installed power for each source. Reasonable values, provided by ARPA, are the following: 1. Hydroelectric, max 20 MW; 2. Photovoltaic, max 1240 MW; 3. Thermodynamic Solar Power, max 20 MW; 4. Wind generations, max 120 MW; 5. Biomasses power plants, max 340 MW; Incentives and mechanisms (4.2.4:3) The Emilia Romagna Region consider the follow- ing mechanisms as feasible to be implemented: 12 http://www.arpa.emr.it/ramea/index.asp 13 http://www.istat.it 34
  • 35. 1. Capital account: incentives are given as a grant, and no money is returned to the Region. Grants are about a percentage of the total plant cost. Previous economic incentives (2003, 2004 and 2007) have been distributed by means of a single, sealed bid english auction. Other auction types can be considered within ePolicy. 2. Interests account: incentives are given as a grant only to pay (part of) interests on bank loans (again no money is returned to the Region). 3. Rotation fund: the Region lends money and interests are returned after a given period. 4. Guarantee fund: the Region guarantees for the investor that obtains a bank loan, thus easing the loan request. 35
  • 36. References [1] Paolo Cagnoli. VAS valutazione ambientale strategica. Dario Flaccovio, 2010. [2] Massimiliano Cattafi, Marco Gavanelli, Michela Milano, and Paolo Cagnoli. Sustain- able biomass power plant location in the Italian Emilia-Romagna region. ACM Trans- actions on Intelligent Systems and Technology, 2(4):33:11–33:19, July 2011. [3] Regione Emilia-Romagna. IL SECONDO PIANO TRIENNALE DI ATTUAZIONE DEL PIANO ENERGETICO REGIONALE 2011-2013. [4] Barry Sadler, Ralf Aschemann, Jiri Dusik, Thomas Fischer, Maria Partidario, and Rob Verheem (eds.). Handbook of Strategic Environmental Assessment. Earthscan, 2010. [5] Jens C. Sorensen and Mitchell L. Moss. Procedures and programs to assist in the impact statement process. Technical report, Univ. of California, Berkely, 1973. 36
  • 37. A The Primary-Secondary Activities Matrix The Primary–Secondary Activities matrix taken into consideration at Region Emilia Ro- magna is a 105 × 105 matrix, where for each activity enlisted in the rows, there is the amount of how many units of other activities are needed. To make the matrix human- readable, we split it into four groups: each group lists the whole set of activities, and their requirements of only a subset of other activities. The four groups are shown in Ta- bles 4, 5, 6, and 7, respectively. 37
  • 38. Table4:Primary–SecondaryActivitiesMatrix:FIRSTGROUP Sewers Water supply systems Sewage treatment and wastewater treat- ment plants Water purification plants Waste storage Incinerators Torches Drill cutting treatment plants Pylons and power line supports Overhead Power Lines Underground Power Lines Electric transformation plants Wind turbines Pipelines (oil, steam, gas, etc.) Gas pipelines pressurization plants Underground storage tanks for petroleum gas Lighting systems Antennas Heating / cooling plants Tunnel ventilation systems Construction sites (artifacts, traffic) Housing and residential areas Squares and yards Roads (Traffic and artifacts) 1Sewers1 2Watersupplysystems1 3Sewagetreatmentandwastewater treatmentplants 1 4Waterpurificationplants1 5Wastestorage1 6Incinerators1 7Torches1 8Drillcuttingtreatmentplants1 9Pylonsandpowerlinesupports000000010,9990,0010,000100000,00100,0010,0010,0001 10OverheadPowerLines00000001100,0001000000000 11UndergroundPowerLines1 12Electrictransformationplants1 13Windturbines0000000110,0010,00110000,100,010,010,01 14Pipelines(oil,steam,gas,etc.)0,0010,00110,0001 15Gaspipelinespressurizationplants0,0010,00110,0001 16Undergroundstoragetanksfor petroleumgas 0,0010,00110,0001 17Lightingsystems0,0010,0010,0001 18Antennas0,0010,0010,00011 19Heating/coolingplants0,10,100,10000,0010,00102000,00110,10,10,0001 20Tunnelventilationsystems0,0010,0010,00110,0001 21Constructionsites(artifacts,traffic)0,0010,0010,00110,0001 22Housingandresidentialareas0,0010,0010,001110,0001 23Squaresandyards0,0010,0010,0010,0001 24Roads(Trafficandartifacts)0,0010,0010,0010,0001 25Junctions,interchanges0,0010,0010,0010,0001 26Paths0,0010,0010,0010,0001 27Bridgesandviaducts0,0010,0010,0010,0001 28Tunnels0,0010,0010,0010,0001 29Railways(platformsandtraffic)0,0010,0010,0010,0001 30Airports(groundtrafficandartifact employment) 0,0010,0010,0010,0001 31Cablewaysorskilifts0,0010,0010,0010,0001 32Constructionsitepaths0,0010,0010,0010,0001 33Shipyards,haulageandlaunching plants 0,0010,0010,0010,0001 34Seaportservices(sanitation,docks cleaning,...) 0,0010,0010,0010,0001 35Reservoirs,impoundments,artificial lakesformultipleuses 0,0010,0010,0010,0001 36Dams,dikes,embankments0,0010,0010,0010,0001 37Industrialbuildings,garages,sheds0,0010,0010,0010,0001 38
  • 39. Table4–Continuedfrompreviouspage:Primary–SecondaryActivitiesMatrix,FIRSTGROUP Sewers Water supply systems Sewage treatment and wastewater treat- ment plants Water purification plants Waste storage Incinerators Torches Drill cutting treatment plants Pylons and power line supports Overhead Power Lines Underground Power Lines Electric transformation plants Wind turbines Pipelines (oil, steam, gas, etc.) Gas pipelines pressurization plants Underground storage tanks for petroleum gas Lighting systems Antennas Heating / cooling plants Tunnel ventilation systems Construction sites (artifacts, traffic) Housing and residential areas Squares and yards Roads (Traffic and artifacts) 38Fences(productionareas,contruction sites,...) 0,0010,0010,0010,0001 39Disposalofobsoletefacilities0,0010,0010,0010,0001 40Landstabilization,slopeconsolidation works 0,0010,0010,0010,0001 41Cavesandmines0,0010,0010,0010,0001 42Excavationandearthworks0,0010,0010,0010,0001 43Depositsforexcavationmaterial0,0010,0010,0010,0001 44Washingfacilitiesforexcavated lithoids 0,0010,0010,0010,0001 45Crushers0,0010,0010,0010,0001 46Groundwaterextractionfacilities0,0010,0010,0010,0001 47Gasandoilextractionfacilities0,0010,0010,0010,0001 48Welldrilling0,0010,0010,0010,0001 49Hunting0,0010,0010,0010,0001 50Hydraulicworks0,0010,0010,0010,0001 51Detentionbasins0,0010,0010,0010,0001 52Floodways,deviationcanals0,0010,0010,0010,0001 53Newriverbeds,correctionofexisting riverbeds 0,0010,0010,0010,0001 54Riverbedswaterproofingandcanaliza- tion 0,0010,0010,0010,0001 55Dredgingworks,riverbedrecalibration0,0010,0010,0010,0001 56Drainsanddrainingsystemtransfor- mations 0,0010,0010,0010,0001 57Embankments0,0010,0010,0010,0001 58River’sbanks0,0010,0010,0010,0001 59Constructionsitefordsandwades0,0010,0010,0010,0001 60Groynes0,0010,0010,0010,0001 61Piers,wharfs0,0010,0010,0010,0001 62Cliffs,reefs,revetments0,0010,0010,0010,0001 63Beachnourishment0,0010,0010,0010,0001 64Industrialworksandtransformations0,0010,0010,0010,0001 65Biomassthermoelectricplant0,010,010,10,100110,0010,00100000,100,10,10,001 66Biomassthermalenergyplant0,010,010,10,100110,0010,00101000,1010,10,001 67Naturalgasthermoelectricplant0,0010,01000,1110,0010,001010110,100,10,10,001 68Coal-firedthermoelectricplant0,0010,010,10,10,1110,0010,00101000,100,10,10,001 69Oil-firedthermoelectricplant0,0010,010,10,10,1110,0010,001010000,100,10,10,001 70Hydroelectricplants010000110,0010,00100000,0100,10,10,01 71Mini-Hydroelectricplants01000110,0010,0010000000,010,010,010,0010,001 72Windgenerators0,0010,0010,000100,00010,00010,001 73Photovoltaicplants00000110,0010,001000000000,001 74Plantsforproductionofelectricalen- ergy,gas,andhotwater 0,000100,0001 39
  • 40. Table4–Continuedfrompreviouspage:Primary–SecondaryActivitiesMatrix,FIRSTGROUP Sewers Water supply systems Sewage treatment and wastewater treat- ment plants Water purification plants Waste storage Incinerators Torches Drill cutting treatment plants Pylons and power line supports Overhead Power Lines Underground Power Lines Electric transformation plants Wind turbines Pipelines (oil, steam, gas, etc.) Gas pipelines pressurization plants Underground storage tanks for petroleum gas Lighting systems Antennas Heating / cooling plants Tunnel ventilation systems Construction sites (artifacts, traffic) Housing and residential areas Squares and yards Roads (Traffic and artifacts) 75Productionofmetalandmetalprod- ucts 0,000100,0001 76Nonmetallicmineralprocessing0,000100,0001 77Dangeroussubstancetreatmentplants0,000100,00010,0001 78Foodprocessingplants0,000100,0001 79Foodandperishablestockings0,000100,0001 80Dairies0,000100,0001 81Agricultureandforestryworksand transformations 0,000100,0001 82Organicandintegratedfarming0,000100,0001 83Intensivelivestockfarming0,000100,0001 84Freerangelivestockfarming0,000100,0001 85Cattlestorage0,000100,0001 86Biofuelproductionplants10,10,50,10000000000,000100,010,0010,0001 87Usageofexplosives 88Dangerousmaterialstocking 89Undergroundtankswithpollutingliq- uids 90Tanks,reservoirswithpollutingliq- uids 91Hydraulicplants(pipes,pumps, valves,etc.) 92Heavymaterialmovement 93Externalmovementofdangerousma- terials 94Internalmovementofdangerousmate- rials 95Maritimetrade 96Airtrade 97Externalmovementofwaste 98Internalmovementofwaste 99Monitorsystemsforaccidentsandim- pacts 100Fireextinguishingsystems 101Informationsystems,traningsystems andDSS 102CertificationsofEnvironmentalquality 103Thermodynamicsolarplants0,10,10,10,010110,0010,00100,001000,01000,10,001 104Solarthermalpanels00,0010000000000000000 105Geothermalsurfaceplants000000000000000000 40
  • 41. Table5:Primary–SecondaryActivitiesMatrix:SECONDGROUP Junctions, interchanges Paths Bridges and viaducts Tunnels Railways (platforms and traffic) Airports (ground traffic and artifact em- ployment) Cableways or ski lifts Construction site paths Shipyards, haulage and launching plants Seaport services (sanitation, docks clean- ing,...) Reservoirs, impoundments, artificial lakes for multiple uses Dams, dikes, embankments Industrial buildings, garages, sheds Fences (production areas, contruction sites, ...) Disposal of obsolete facilities Land stabilization, slope consolidation works Caves and mines Excavation and earthworks Deposits for excavation material Washing facilities for excavated lithoids Crushers Groundwater extraction facilities Gas and oil extraction facilities Well drilling 1Sewers 2Watersupplysystems 3Sewagetreatmentandwastewater treatmentplants 4Waterpurificationplants 5Wastestorage 6Incinerators 7Torches 8Drillcuttingtreatmentplants 9Pylonsandpowerlinesupports0,000100000,00010,00010,100,0010000 10OverheadPowerLines00000000,1000000 11UndergroundPowerLines 12Electrictransformationplants 13Windturbines0,01000000,001100,10000 14Pipelines(oil,steam,gas,etc.)00,10,1 15Gaspipelinespressurizationplants00,10,1 16Undergroundstoragetanksfor petroleumgas 00,10,1 17Lightingsystems00,10,1 18Antennas00,10,1 19Heating/coolingplants0,00010,000100000,10,10,10000,10 20Tunnelventilationsystems0,00010,00010,000100,10,1 21Constructionsites(artifacts,traffic)0,00010,00010,000100,10,1 22Housingandresidentialareas0,00010,00010,0001010,110,1 23Squaresandyards0,00010,00010,000100,10,1 24Roads(Trafficandartifacts)0,00010,00010,000100,10,1 25Junctions,interchanges10,00010,00010,000100,10,1 26Paths0,00010,00010,000100,10,1 27Bridgesandviaducts0,000110,00010,000100,10,1 28Tunnels0,000110,00010,000100,10,1 29Railways(platformsandtraffic)0,000110,00010,000100,10,1 30Airports(groundtrafficandartifact employment) 0,000110,00010,000100,10,1 31Cablewaysorskilifts0,000110,00010,000100,10,1 32Constructionsitepaths0,000110,00010,000100,10,1 33Shipyards,haulageandlaunching plants 0,00010,00010,000100,10,1 34Seaportservices(sanitation,docks cleaning,...) 0,00010,00010,000100,10,1 35Reservoirs,impoundments,artificial lakesformultipleuses 0,00010,00010,000100,10,1 36Dams,dikes,embankments0,00010,00010,0001010,10,1 37Industrialbuildings,garages,sheds0,00010,00010,000100,10,1 41