Yonge bloor submarket dashboard q2 2010
•
0 likes•93 views

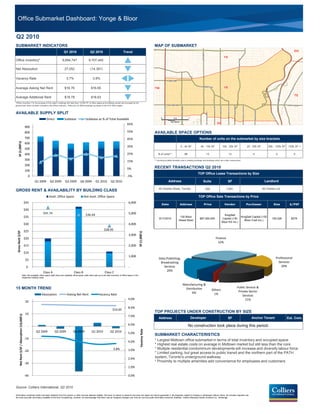
This document provides a quarterly dashboard and market indicators for the Yonge & Bloor office submarket in Toronto for Q2 2010. Key points include: - Inventory increased slightly to 9.7 million SF while net absorption was negative. Vacancy rose to 3.8%. - Average asking rents fell slightly to $16.65 per SF. - Recent large lease and sale transactions are noted. - Availability is split 65% direct and 35% sublease space. - Rents are highest for Class A buildings and lowest for Class C. - Absorption and vacancy trends over the past 15 months are shown.

Recommended
More Related Content
Similar to Yonge bloor submarket dashboard q2 2010
Similar to Yonge bloor submarket dashboard q2 2010 (11)
More from Chris Fyvie
More from Chris Fyvie (20)
Recently uploaded
Recently uploaded (20)
Yonge bloor submarket dashboard q2 2010
- 1. Office Submarket Dashboard: Yonge & Bloor Office Submarket Dashboard: Yonge & Bloor Q2 2010 Q2 2010 SUBMARKET INDICATORS MAP OF SUBMARKET Q1 2010 Q2 2010 Trend DO DO Avenue Road Avenue Road Avenue Road Avenue Road Avenue Road Avenue Road Avenue Road Avenue Road Avenue Road Avenue Road Avenue Road Avenue Road YS YS Mount Pleasant Road Mount Pleasant Road Mount Pleasant Road Office Inventory* 9,694,747 9,707,440 Mount Pleasant Road Mount Pleasant Road Net Absorption 27,052 (14,391) Vacancy Rate 3.7% 3.8% ⊳ Dupont Street Dupont Street Dupont Street Dupont Street Davenport Road Davenport Road Davenport Road Average Asking Net Rent $16.76 $16.65 TW TW Davenport Road Davenport Road YB YB e ue ue nue ue enu ven ve Ave Ave lley Parkw ay ay v lley Pa rkway ay lley Parkway Pa ay wA wA wA Pa rkw iew iew iew adv ie advie TE TE dv adv dv Pa Average Additional Rent $18.78 $18.63 Broa Broa Bro Bro Bro Don Valley Don Valley Don Valley Don Va Don Va Don Va *Office Inventory: For the purpose of this report, buildings with less than 10,000 SF of office space and buildings owned and occupied by the Bloor Street West Bloor Street West Bloor Street West Bloor Street West Bloor Street West Bloor Street West Danforth Avenue Danforth Avenue Danforth Avenue government have not been included in the office inventory. There are 75 office buildings surveyed in the GTA office region. Danforth Avenue Danforth Avenue Danforth Avenue Bathurst Street Yonge Street Bathurst Street Bathurst Street YongeStreet Yonge Street Bathurst Street Bathurst Street YongeStreet Yonge Street Spadina Avenue Spadina Avenue Spadina Avenue Bay Street Church Street Church Street Church Street Church Street Sherbourne Street Sherbourne Street Spadina Avenue Spadina Avenue Bay Street Bay Street Church Street Jarvis Street Sherbourne Street Sherbourne Street Spadina Avenue Spadina Bay Street Bay Street Church Street Jarvis Street Jarvis Street Jarvis Street Jarvis Street Sherbourne Street Sherbourne Street Jarvis Street Jarvis Street Jarvis Street Jarvis Street Parliament Street Parliament Street Parliament Street Street Parliament Street Parliament Street Ba Bay AVAILABLE SUPPLY SPLIT Ba y Queen's Park Crs E Queen's Park Crs E Ba Bay Queen's Park Crs E Queen's Park Crs E Queen's Park Crs E Queen's Park Crs E yvie yvie vie w vie w view vie vie vie vie vie vie vie ie ie iew Street Street Street Street Street Street wA Ave Av e Av Ave 0 0 0.5 0.5 1 1 ven Direct Sublease Sublease as % of Total Available en en u enu e nu e e ue ue e kilometers kilometers 65% DN DN 900 800 55% AVAILABLE SPACE OPTIONS 700 45% Number of units on the submarket by size brackets SF (1,000's) 600 35% 0 - 4k SF 4k - 10k SF 10k - 20k SF 20 - 50k SF 50k - 100k SF 100k SF + 500 400 25% # of units** 86 13 13 4 0 0 300 15% ** Counting smallest divisible units in existing buildings and buildings which are under construction. 200 5% RECENT TRANSACTIONS Q2 2010 100 TOP Office Lease Transactions by Size 0 -5% Q1 2009 Q2 2009 Q3 2009 Q4 2009 Q1 2010 Q2 2010 Address Suite SF Landlord 45 Charles Street, Toronto 200 7,691 45 Charles Ltd. GROSS RENT & AVAILABILITY BY BUILDING CLASS Avail. Office Space Not Avail. Office Space TOP Office Sale Transactions by Price $45 6,000 Date Address Price Vendor Purchaser Size $/PSF $40 $41.74 5,000 $36.44 KingSett $35 130 Bloor KingSett Captial (130 6/17/2010 $87,000,000 Capital (130 150,326 $579 Street West Bloor Creif Inc.) Bloor KS Inc.) $30 4,000 $25 $28.95 Gross Rent $/SF SF (1,000's) 3,000 $20 Finance 32% $15 2,000 $10 1,000 Data,Publishing, Professional $5 Broadcasting Services $- - Services 20% 20% Class A Class B Class C Note: Not available office space (light blue) and available office space (dark blue) add up to the total inventory of office space in the respective building class. Manufacturing & 15 MONTH TREND Distribution Public Service & Others Private Sector 6% 1% Absorption Asking Net Rent Vacancy Rate Services 9.0% 21% 20 8.0% $16.65 TOP PROJECTS UNDER CONSTRUCTION BY SIZE 10 Net Rent $/SF / Absorption (10,000's) 7.0% Address Developer SF Anchor Tenant Est. Com. - 6.0% No construction took place during this period. Vacancy Rate Q2 2009 Q3 2009 Q4 2009 Q1 2010 Q2 2010 5.0% SUBMARKET CHARACTERISTICS -10 * Largest Midtown office submarket in terms of total inventory and occupied space 4.0% * Highest real estate costs on average in Midtown market but still less than the core 3.8% 3.0% * Multiple residential condominium developments will increase and diversify labour force -20 * Limited parking, but great access to public transit and the northern part of the PATH 2.0% system, Toronto's underground walkway * Proximity to multiple amenities add convenience for employees and customers -30 1.0% -40 0.0% Source: Colliers International, Q2 2010 Information contained herein has been obtained from the owners or other sources deemed reliable. We have no reason to doubt its accuracy but regret we cannot guarantee it. All properties subject to change or withdrawal without notice. All numbers reported use the most accurate information available at the time of publishing, however we acknowledge that there may be marginal changes over time as more accurate information becomes available. Colliers Macaulay Nicolls (Ontario) Inc., Brokerage.