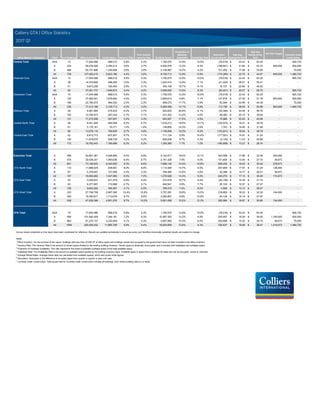
This document provides an overview of office market statistics for various submarkets in the Greater Toronto Area (GTA) for the first quarter of 2017. Key metrics reported include number of buildings, total office inventory, vacant space, vacancy rates, available space, absorption rates, and average asking rental rates. The Financial Core submarket had 94 buildings totaling 37 million square feet of office inventory, with a vacancy rate of 4.4% and average asking gross rent of $58.72 per square foot.
JLL just released the Q1 Chicago Suburbs Office Outlook. The report has some great insight into recent market activity and provides a forecast for the year ahead.
Pittsburgh is going into the fourth quarter with positive absorption. The market's unique position as a central distribution hub and hub to a petrochemical facility will continue to drive activity.
Fixed Capital Analysis PowerPoint Presentation SlidesSlideTeam
Presenting this set of slides with name - Fixed Capital Analysis Powerpoint Presentation Slides. This deck consists of total of fourty slides. It has PPT slides highlighting important topics of Fixed Capital Analysis Powerpoint Presentation Slides. This deck comprises of amazing visuals with thoroughly researched content. Each template is well crafted and designed by our PowerPoint experts. Our designers have included all the necessary PowerPoint layouts in this deck. From icons to graphs, this PPT deck has it all. The best part is that these templates are easily customizable. Just click the DOWNLOAD button shown below. Edit the colour, text, font size, add or delete the content as per the requirement. Download this deck now and engage your audience with this ready made presentation.
JLL Cincinnati Industrial Outlook - Q3 2016Ross Bratcher
Construction activity continued to trend smaller as buildings of less than 300,000 square feet accounted for the majority of projects in the development pipeline. Class B leasing activity outpaced Class A in the third quarter as Class B landlords increase tenant improvement packages to become more competitive. Two speculative projects commenced in the Airport submarket combining for a total of 415,800 square feet.
Pittsburgh industrial market vacancy rates are declining and asking rents are increasing. New speculative construction reveals a healthy investor appetite in a growing market.
JLL Detroit Industrial Insight & Statistics - Q2 2017Harrison West
Market sentiment remains positive, yet leasing activity was somewhat muted in the second quarter. Low market availability for quality space has encouraged build-to-suit projects as well as speculative construction.
2019 ended the decade on high notes, as Pittsburgh gets its first VC-funded tech unicorn and the former Civic Arena site gets an anchor tenant for the tower.
JLL Detroit Industrial Insight & Statistics - Q4 2017Harrison West
Overall vacancy fell by six basis points to 5.7 percent, while average asking rents rose by ten cents to $4.98 per square foot. In total, 9.6 million square feet was absorbed in 2017. The total construction pipeline fell just shy of topping 4.0 million square feet, while 1.7 million square feet delivered throughout the year.
Colliers canada national market snapshot 2020 q4Chris Fyvie
• Although Q4 2020 has brought good news on the vaccine front and removing some of the overall economic uncertainty, we are not in the clear yet and some asset types will take longer to rebound than others.
• The office market continues to experience rising vacancy, predominantly due to rising downtown sublet space. This corresponds with office attendance levels, which are trending below 15% in downtowns, compared to around 30% in the suburbs.
• After a brief pause in activity earlier in the pandemic, the industrial market continued to tighten in Q4 2020. Despite some weakness in bricks and mortar and restaurant distribution as well as in experiential users, strong demand from e-commerce and grocery users drove vacancy down and rents stable.
• The first half of 2021 will remain difficult for many. However, like in 2020, as summer 2021 approaches the economy is expected to thaw. This economic rebound will pick up steam as the vaccine rollout reaches completion.
Fixed Capital Analysis PowerPoint Presentation SlidesSlideTeam
Presenting this set of slides with name - Fixed Capital Analysis Powerpoint Presentation Slides. This deck consists of total of fourty slides. It has PPT slides highlighting important topics of Fixed Capital Analysis Powerpoint Presentation Slides. This deck comprises of amazing visuals with thoroughly researched content. Each template is well crafted and designed by our PowerPoint experts. Our designers have included all the necessary PowerPoint layouts in this deck. From icons to graphs, this PPT deck has it all. The best part is that these templates are easily customizable. Just click the DOWNLOAD button shown below. Edit the colour, text, font size, add or delete the content as per the requirement. Download this deck now and engage your audience with this ready made presentation.
JLL Cincinnati Industrial Outlook - Q3 2016Ross Bratcher
Construction activity continued to trend smaller as buildings of less than 300,000 square feet accounted for the majority of projects in the development pipeline. Class B leasing activity outpaced Class A in the third quarter as Class B landlords increase tenant improvement packages to become more competitive. Two speculative projects commenced in the Airport submarket combining for a total of 415,800 square feet.
Pittsburgh industrial market vacancy rates are declining and asking rents are increasing. New speculative construction reveals a healthy investor appetite in a growing market.
JLL Detroit Industrial Insight & Statistics - Q2 2017Harrison West
Market sentiment remains positive, yet leasing activity was somewhat muted in the second quarter. Low market availability for quality space has encouraged build-to-suit projects as well as speculative construction.
2019 ended the decade on high notes, as Pittsburgh gets its first VC-funded tech unicorn and the former Civic Arena site gets an anchor tenant for the tower.
JLL Detroit Industrial Insight & Statistics - Q4 2017Harrison West
Overall vacancy fell by six basis points to 5.7 percent, while average asking rents rose by ten cents to $4.98 per square foot. In total, 9.6 million square feet was absorbed in 2017. The total construction pipeline fell just shy of topping 4.0 million square feet, while 1.7 million square feet delivered throughout the year.
Similar to Colliers GTA Office Statistics Q1 2017 (20)
Colliers canada national market snapshot 2020 q4Chris Fyvie
• Although Q4 2020 has brought good news on the vaccine front and removing some of the overall economic uncertainty, we are not in the clear yet and some asset types will take longer to rebound than others.
• The office market continues to experience rising vacancy, predominantly due to rising downtown sublet space. This corresponds with office attendance levels, which are trending below 15% in downtowns, compared to around 30% in the suburbs.
• After a brief pause in activity earlier in the pandemic, the industrial market continued to tighten in Q4 2020. Despite some weakness in bricks and mortar and restaurant distribution as well as in experiential users, strong demand from e-commerce and grocery users drove vacancy down and rents stable.
• The first half of 2021 will remain difficult for many. However, like in 2020, as summer 2021 approaches the economy is expected to thaw. This economic rebound will pick up steam as the vaccine rollout reaches completion.
Sense Levent Kagithane Catalog - Listing TurkeyListing Turkey
Sense Levent offers a luxurious living experience in the heart of Istanbul’s vibrant Levent district.
This cutting-edge development seamlessly integrates modern design with natural elements, featuring live evergreen plants maintained by an advanced irrigation system, ensuring lush greenery year-round.
The building’s elegant ceramic balconies are both stylish and durable, enhancing the overall aesthetic and functionality. Residents can enjoy the 700m Sky Lounge, which provides breathtaking views of Istanbul and a perfect space to relax and unwind.
Sense Levent promotes a healthy and active lifestyle with a full gym, swimming pool, sauna, and steam room, all available in the building. The interiors are crafted with high-quality materials, ensuring a luxurious and inviting living space.
Designed with young professionals in mind, Sense Levent features 1+1 and 2+1 units with smart floor plans and balconies. The project promises high investment returns, with an expected annual return of 6.5-7%, significantly above Istanbul’s average ROI.
Located in the rapidly growing and highly desirable Levent area, the development benefits from ongoing urban regeneration projects. Its prime location offers proximity to shopping malls, municipal buildings, universities, and public transportation, adding immense value to your investment.
Early investors can take advantage of discounted units during the construction phase, with an expected capital appreciation of +45% USD upon completion. Property Turkey provides comprehensive rental management services, ensuring a seamless and profitable investment experience.
Additionally, robust legal support and significant tax advantages are available through Property Turkey’s licensed Real Estate Investment Fund. Levent is a dynamic urban hub, ideal for young professionals with its numerous corporate headquarters and shopping malls.
Sense Levent is more than just a residence; it’s a place where dreams and opportunities come to life. Contact us today to secure your place in this exclusive development and experience the best of Istanbul living. Sense Levent: Sense the Opportunity. Live the Dream.
https://listingturkey.com/property/sense-levent/
500 acres of brilliance await you here at Riverview City which offers modern living, effortless convenience, and a beautiful natural setting. It is a mega township by Magarpatta City in Loni Kalbhor, Pune. Enjoy easy access to work, schools, and fun while experiencing a perfect work-life balance.
Visit - magarpattacity.developerprojects.in
Flat available for sale
Location- Tupudana, Ranchi
Savitri enclave
Area- 3BHK
Rate- 4000/sq.ft.
Super Build Up Area-1629 sq.ft.
Build-up area-1253 sq.ft.
Rate- 65lakh16k(approx)
Floor available- Flat available in all floor(G+12)
Balcony- 2
Washroom- 2
Parking - CAR PARKING
Amenities- Joggers track,temple, children's park,gym,banquet hall (5 Lakh)
Possession year (Handover year)- Dec 2025
Outside View from the apartment and flat balcony is very beautiful.
For more information contact AASHIYANA STAR PROPERTIES
7766900371
Need MCA leads? No sweat! MCAs are great for small biz funding. Learn how to snag top-notch leads: businesses needing cash, with repayment ability, decision-makers, and accurate contacts. Use content, social ads, lead platforms, partnerships, and capture processes for quality leads.
https://www.leadgeneration.media/blog/b/streamline-your-mca-sales-process-with-pre-qualified-leads
Omaxe Sports City Dwarka stands out as a premier residential and recreational destination, offering a blend of luxury and sports-centric living. Located in the thriving area of Dwarka, this project by Omaxe Limited is designed to cater to modern lifestyle needs while promoting a healthy, active living environment.
Referans Bahcesehir which is being constructed, in the center of the most regional destination as Bahçeşehir, shines out with its central location and unique landscape including social facilities such as a fitness center, sauna, sports facilities, children’s playground and recreational areas.
Not only drawing attention for immediate surroundings including commercial centers and private schools but also providing the easily accessible location with closeness to Tem Highway and connection roads, ongoing construction of 3rd Bridge Connection roads and Metro Projects
Bahcesehir is a rising value in the great city of Istanbul… Located at a new transportation junction in the northwest of the City… Located at such a spot that the access roads for the 3rd bridge and for the 3rd Airport will reach the region in 2016. The Marmaray and the Subway will extend all the way to Referans Bahcesehir respectively in 2018 and 2019.
465 flats and 34 stores are designed with an outstanding approach and arranged with a unique perspective offering the following options: 1 plus 1, 2 plus 1, 3 plus 1, 3.5 plus 1, 4 plus 1, and 4.5 plus 1. It is planned so as to safeguard you and your loved ones based upon a modern, technological safety approach. As you experience the joy and luxury here, you will be content and feet at ease.
It is worth seeing both inside and outside with heart-warming cafes, tasty restaurants and elegant stores… And it is ready to offer a vivacious social life with a warm and cozy space design.
A folding swimming pool and indoor swimming pools, playgrounds, Turkish bath, sauna… It has them all. Everything you need for your well-being and for having a pleasant time will be at your service. You simply need to align the rhythm of life with the rhythm of Referans Bahcesehir.
https://listingturkey.com/property/referans-bahcesehir/
Brigade Insignia offers meticulously designed apartments with modern architecture and premium finishes. The project features spacious 3,3.5,4 and 5 BHK units, each thoughtfully planned to provide maximum comfort, natural light, and ventilation.
https://www.newprojectbangalore.com/brigade-insignia-yelahanka-bangalore.html
Rixos Tersane Istanbul Residences Brochure_May2024_ENG.pdfListing Turkey
Tersane Suites Residences is a luxurious real estate project located in the heart of Istanbul, next to the beautiful Golden Horn. This unique development offers hotel concept residences with Rixos management, making it the perfect choice for both homeowners and investors.
The Tersane Suites Residences offers a wide range of options, from studio apartments to spacious four-bedroom units, all designed to the highest standard. The suites are finished with high-quality materials and feature modern, open-plan living spaces, fully-equipped kitchens, and large balconies with stunning views of the city and sea.
One of the standout features of Tersane Suites Residences is the Rixos management, which provides a truly exclusive and upscale living experience. Residents will have access to a range of luxury amenities, including a fitness center, spa, and indoor and outdoor swimming pools. Plus, the on-site restaurants and cafes provide a taste of the local and international cuisine.
The Tersane Suites Residences also offers a great opportunity for investors, as it provides a rental guarantee program. This means that investors can enjoy a steady income stream, with the peace of mind that their property is being managed by a reputable and experienced team.
The location of Tersane Suites Residences is also unbeatable, with easy access to the city’s main transportation links and within close proximity to the historic center, making it the perfect base for exploring all that Istanbul has to offer.
The SVN® organization shares a portion of their new weekly listings via their SVN Live® Weekly Property Broadcast. Visit https://svn.com/svn-live/ if you would like to attend our weekly call, which we open up to the brokerage community.
Keep Your Home Naturally Cool and Warm Out Change in Seasons
Vinra Construction is a private limited company registered under the ROC. The management has an experience of over 15 years of understanding the needs and delivering apt solutions to the end users We are providing turnkey solutions in construction fields. like Construction, Interior Designing Facility Management, Plantation Management, etc..
Vinra Construction Tech Enabled Company for Eco-Friendly Home Construction
Contact With Vinra for a Greener Future >>> Call us @ 888 4898 765
Green Homes, Islamabad Presentation .pdfticktoktips
Green Homes Islamabad offers beautifully designed 5, 8, and 10 Marla homes near the airport and motorway. Enjoy luxury, convenience, and high rental returns in a prime location.
Elegant Evergreen Homes - Luxury Apartments Redefining Comfort in Yelahanka, ...JagadishKR1
Experience unmatched luxury at Elegant Evergreen Homes, offering exquisite 2, 3, and 4 BHK apartments in the serene locality of Yelahanka, Bangalore. These meticulously crafted homes blend modern design with timeless elegance, providing a harmonious living environment. Enjoy top-tier amenities and a prime location, making Elegant Evergreen Homes the ideal choice for discerning homeowners.
Scanning tenants in NYC requires a thorough and compliant approach to ensure you find reliable renters. For a positive rental experience, consider hiring a property management service. Belgium Management LLC specializes in NYC rental property management and tenant relationship management. We prioritize tenant satisfaction, making us a trusted name in New York property management. Our dedicated team ensures tenants feel valued and supported throughout their lease.
Urbanrise Paradise on Earth - Unveiling Unprecedented Luxury in Exquisite Vil...JagadishKR1
Immerse yourself in the epitome of luxury living at Urbanrise Paradise on Earth. These opulent 4 BHK villas, nestled off the prestigious Kanakapura Road in Bangalore, redefine elegance and sophistication. With meticulous craftsmanship, breathtaking design, and unparalleled amenities, Urbanrise Paradise on Earth offers a sanctuary where every moment is infused with luxury and serenity. Experience a life of grandeur and indulgence at this exclusive residential enclave.
Investing In The US As A Canadian… And How To Do It RIGHT!! (feat. Erwin Szet...Volition Properties
=== Investing In The US As A Canadian… And How To Do It RIGHT!! (feat. Erwin Szeto) ===
Ever been curious about Real Estate Investing in the US?? At Volition, for the past 14 years, we have been focused on helping investors invest in over $250M of real estate and generate $100M of wealth in the Toronto market, but we are always open to learning more about other business models and learning from other investors.
The US has always been an intriguing market to invest in. But the US is a big place… if you’re interested in investing in the US, you probably have a lot of questions, like:
☑️ Specifically WHERE should you invest?
☑️ What are the best markets to invest in and why?
☑️ How much are property prices there?
☑️ What are the returns like?
☑️ What is cashflow like?
☑️ Compared to investing in Toronto or other cities in Ontario, what are the benefits / tradeoffs?
☑️ What ownership structure should I use?
☑️ What are the tax implications?
☑️ Can I get financing?
☑️ What are tenants like?
Enter Erwin Szeto, a longtime friend of Volition. Since 2005, Erwin Szeto and his team have navigated the challenging landscape of being landlords in Ontario. Now, they are shifting their focus and guiding their clients' investments toward the more landlord-friendly environment of the USA. This decision comes after assisting Canadian clients in transacting over $440,000,000 in income properties. Faced with issues like affordability constraints, tenant-friendly laws, rent control, and rental licensing in Canada, Erwin sees a clear opportunity in the U.S. Here, there is a significant influx of investments leading to the creation of high-paying manufacturing jobs. Erwin and his clients are poised to capitalize on these opportunities where landlord rights are stronger and there is no rent control.
To facilitate this transition, Erwin has partnered with and become a client of SHARE, a one-stop-shop U.S. Asset Manager. Founded by Canadians for Canadians, SHARE enables as passive an ownership experience as possible for landlords in the U.S., while still maintaining direct, 100% ownership.
Erwin is “Making Real Estate Investing Great Again”!!
Website: https://www.infinitywealth.ca/
Facebook: https://www.facebook.com/iwinrealestate and https://www.facebook.com/ErwinSzetoOfficial
Podcast: https://www.truthaboutrealestateinvesting.ca/
Instagram: https://www.instagram.com/iwinrealestate/ and https://www.instagram.com/erwinszeto/
Simpolo Tiles & Bathware
Tile ho,
toh Simpolo.
Since the first steps were taken in 1977, Simpolo Ceramics has carved its niche as a consistently growing organisation with unparalleled innovation and passion rooted in simplicity.
We endure gratification for every experience we offer, created to share something meaningful. It may not resonate with the majority, but that makes us a class apart. If only a handful were to understand the purpose of our existence, we would be proud to have found our believers. Rather, people with whom we can share our beliefs.
VISUALIZER
Design your space in your style with our very own Visualizer. Now, you can choose the tiles of your liking from our wide selection and see how they would look in a space. Select the tile from the multiple options and the visualiser will replace the surfaces in the image with the selected tiles. This way, instead of just your imagination, you can choose the tiles for your place by getting an actual picture of how they would look in a space. So, design your space the way you desire digitally and implement it in real life to get the best results!
You can also share this visualiser with others to help them design their space.
Committed to delighting customers with world-class ceramic products and services. Make Simpolo synonymous with the best quality and set new benchmarks of excellence for all stakeholders. Pursue best business practices with utmost integrity to make Simpolo an exciting organisation to work with, for vendors, channel partners, investors and employees alike.
Gain worldwide recognition in the field of ceramic building products through Research and Innovation and bring an enhanced lifestyle within reach for every household.
1. Office Market / Submarket Class # of Buildings Office Inventory Vacant Space Vacancy Rate
Prior Quarter
Vacancy Rate Available Space
Proportion of
Sublease
Availability Availability Rate
Absorption
Current Quarter
Wgt Avg.
Asking Net Rent
Wgt Avg.
Asking Gross
Rent
Net New Supply
Currently Under
Construction
Central Total AAA 15 17,044,586 988,015 5.8% 5.3% 1,700,570 12.9% 10.0% (78,016) 33.43$ 63.25$ - 905,722
Central Total A 224 59,278,928 3,295,212 5.6% 3.7% 4,922,576 12.3% 8.3% (198,641) 21.64$ 42.70$ 940,000 500,000
Central Total B 489 50,731,896 1,339,958 2.6% 2.8% 2,106,567 14.2% 4.2% 101,292 17.69$ 35.95$ - 75,000
Central Total All 728 127,055,410 5,623,185 4.4% 3.6% 8,729,713 12.9% 6.9% (175,365) 22.75$ 44.67$ 940,000 1,480,722
Financial Core AAA 15 17,044,586 988,015 5.8% 5.3% 1,700,570 12.9% 10.0% (78,016) 33.43$ 63.25$ - 905,722
Financial Core A 38 14,333,895 498,206 3.5% 3.3% 1,023,414 14.8% 7.1% (21,492) 28.51$ 55.41$ - -
Financial Core B 41 5,673,256 160,454 2.8% 3.1% 345,108 16.7% 6.1% 16,107 22.84$ 46.52$ - -
Financial Core All 94 37,051,737 1,646,675 4.4% 4.2% 3,069,092 13.9% 8.3% (83,401) 30.57$ 58.72$ - 905,722
Downtown Total AAA 15 17,044,586 988,015 5.8% 5.3% 1,700,570 12.9% 10.0% (78,016) 33.43$ 63.25$ - 905,722
Downtown Total A 125 37,582,541 1,676,664 4.5% 2.4% 2,669,614 9.8% 7.1% 137,878 27.30$ 51.76$ 940,000 500,000
Downtown Total B 196 22,785,072 464,034 2.0% 2.3% 899,274 17.7% 3.9% 53,294 22.99$ 44.38$ - 75,000
Downtown Total All 336 77,412,199 3,128,713 4.0% 3.0% 5,269,458 12.1% 6.8% 113,156 28.93$ 54.98$ 940,000 1,480,722
Midtown Total A 29 6,481,685 270,533 4.2% 3.7% 522,625 20.8% 8.1% (33,394) 24.54$ 46.70$ - -
Midtown Total B 102 10,790,973 287,424 2.7% 3.1% 431,202 13.4% 4.0% 49,360 20.10$ 39.65$ - -
Midtown Total All 131 17,272,658 557,957 3.2% 3.3% 953,827 17.5% 5.5% 15,966 22.63$ 43.66$ - -
Central North Total A 28 8,401,929 690,058 8.2% 6.7% 1,019,213 18.9% 12.1% (125,574) 19.21$ 39.78$ - -
Central North Total B 61 5,176,181 79,771 1.5% 1.6% 136,855 14.3% 2.6% 1,743 14.46$ 31.46$ - -
Central North Total All 89 13,578,110 769,829 5.7% 4.8% 1,156,068 18.3% 8.5% (123,831) 18.64$ 38.79$ - -
Central East Total A 42 6,812,773 657,957 9.7% 7.1% 711,124 5.9% 10.4% (177,551) 14.91$ 31.24$ - -
Central East Total B 130 11,979,670 508,729 4.2% 4.2% 639,236 9.7% 5.3% (3,105) 11.43$ 25.96$ - -
Central East Total All 172 18,792,443 1,166,686 6.2% 5.2% 1,350,360 7.7% 7.2% (180,656) 13.27$ 28.74$ - -
Suburban Total A 366 42,661,381 4,048,969 9.5% 9.9% 5,144,817 18.0% 12.1% 404,598 17.88$ 32.06$ 240,000 -
Suburban Total B 475 30,538,241 1,993,636 6.5% 6.7% 2,751,328 7.6% 9.0% 101,604 13.94$ 27.70$ 38,673 -
Suburban Total All 841 73,199,622 6,042,605 8.3% 8.6% 7,896,145 14.4% 10.8% 506,202 16.40$ 30.42$ 278,673 -
GTA North Total A 110 11,686,025 939,991 8.0% 8.8% 1,114,948 14.7% 9.5% 207,904 17.57$ 31.24$ 136,000 -
GTA North Total B 87 4,379,657 107,069 2.4% 2.3% 164,580 12.6% 3.8% 32,368 14.77$ 26.21$ 38,673 -
GTA North Total All 197 16,065,682 1,047,060 6.5% 7.0% 1,279,528 14.4% 8.0% 240,272 17.15$ 30.49$ 174,673 -
GTA East Total A 23 3,226,647 221,579 6.9% 6.2% 272,578 19.7% 8.4% (20,156) 14.30$ 31.74$ - -
GTA East Total B 83 6,377,907 172,888 2.7% 3.1% 492,941 0.6% 7.7% 25,102 12.57$ 27.07$ - -
GTA East Total All 106 9,604,554 394,467 4.1% 4.2% 765,519 7.4% 8.0% 4,946 13.12$ 28.57$ - -
GTA West Total A 233 27,748,709 2,887,399 10.4% 10.9% 3,757,291 18.8% 13.5% 216,850 18.22$ 32.32$ 104,000 -
GTA West Total B 305 19,780,677 1,713,679 8.7% 8.9% 2,093,807 8.8% 10.6% 44,134 14.19$ 27.97$ - -
GTA West Total All 538 47,529,386 4,601,078 9.7% 10.0% 5,851,098 15.2% 12.3% 260,984 16.67$ 30.65$ 104,000 -
GTA Total AAA 15 17,044,586 988,015 5.8% 5.3% 1,700,570 12.9% 10.0% (78,016) 33.43$ 63.25$ - 905,722
GTA Total A 590 101,940,309 7,344,181 7.2% 6.3% 10,067,393 15.2% 9.9% 205,957 19.29$ 36.05$ 1,180,000 500,000
GTA Total B 964 81,270,137 3,333,594 4.1% 4.3% 4,857,895 10.4% 6.0% 202,896 15.32$ 30.74$ 38,673 75,000
GTA Total All 1569 200,255,032 11,665,790 5.8% 5.4% 16,625,858 13.6% 8.3% 330,837 19.09$ 36.47$ 1,218,673 1,480,722
Survey results presented on this report have been condensed for reference. Results are updated periodically to ensure accuracy and therefore historically published results are subject to change.
Notes:
1
Office Inventory: For the purpose of this report, buildings with less than 20,000 SF of office space and buildings owned and occupied by the government have not been included in the office inventory.
2
Vacancy Rate: The Vacancy Rate is the amount of vacant space divided by the existing building inventory. Vacant space is physically unoccupied, and it includes both headlease and sublease space.
3
Proportion of Sublease Availability: This ratio represents the share of available sublease space of the total available space.
4
Availability Rate: The Availability Rate is the amount of available space divided by the building inventory base. Available space is space that is available for lease and can be occupied, vacant or unknown.
5
Average Rental Rates: Average rental rates are calculated from available spaces, which also quote rental figures.
6
Absorption: Absorption is the difference in occupied space from quarter to quarter or year-over-year.
7
Currently Under Construction: Total square feet for currently under construction includes all buildings, even where building class is un-listed.
Colliers GTA | Office Statistics
2017 Q1
2. Office Market / Submarket Class
# of
Buildings Office Inventory Vacant Space Vacancy Rate
Prior Quarter
Vacancy Rate Available Space
Proportion of
Sublease
Availability
Availability
Rate
Absorption
Current Quarter
Wgt Avg.
Asking Net
Rent
Wgt Avg.
Asking Gross
Rent Net New Supply
Currently Under
Construction
Financial Core AAA 15 17,044,586 988,015 5.8% 5.3% 1,700,570 12.9% 10.0% (78,016) 33.43$ 63.25$ - 905,722
Financial Core A 38 14,333,895 498,206 3.5% 3.3% 1,023,414 14.8% 7.1% (21,492) 28.51$ 55.41$ - -
Financial Core B 41 5,673,256 160,454 2.8% 3.1% 345,108 16.7% 6.1% 16,107 22.84$ 46.52$ - -
Financial Core All 94 37,051,737 1,646,675 4.4% 4.2% 3,069,092 13.9% 8.3% (83,401) 30.57$ 58.72$ - 905,722
Downtown East A 14 1,665,705 102,054 6.1% 2.8% 134,824 23.8% 8.1% (55,708) 27.11$ 46.44$ - 500,000
Downtown East B 36 2,505,953 47,530 1.9% 2.5% 117,569 26.2% 4.7% 15,747 22.19$ 43.22$ - -
Downtown East All 50 4,171,658 149,584 3.6% 2.6% 252,393 24.9% 6.1% (39,961) 25.45$ 45.35$ - 500,000
Downtown North A 20 8,500,107 31,791 0.4% 0.3% 116,181 0.0% 1.4% (8,024) 22.21$ 43.41$ - -
Downtown North B 53 8,517,353 59,423 0.7% 0.6% 182,992 23.6% 2.1% (5,904) 21.85$ 42.76$ - -
Downtown North All 73 17,017,460 91,214 0.5% 0.5% 299,173 14.5% 1.8% (13,928) 21.99$ 43.01$ - -
Downtown South A 14 5,691,776 838,456 14.7% 1.3% 874,896 3.7% 15.4% 162,488 - - 940,000 -
Downtown South B 5 1,382,135 25,440 1.8% 2.8% 38,930 20.5% 2.8% 13,683 25.00$ 43.29$ - -
Downtown South All 19 7,073,911 863,896 12.2% 1.6% 913,826 4.4% 12.9% 176,171 25.00$ 43.29$ 940,000 -
Downtown West A 39 7,391,058 206,157 2.8% 3.6% 520,299 9.0% 7.0% 60,614 24.44$ 43.10$ - -
Downtown West B 61 4,706,375 171,187 3.6% 3.9% 214,675 8.9% 4.6% 13,661 25.75$ 42.08$ - 75,000
Downtown West All 100 12,097,433 377,344 3.1% 3.7% 734,974 9.0% 6.1% 74,275 25.15$ 42.55$ - 75,000
Downtown Total AAA 15 17,044,586 988,015 5.8% 5.3% 1,700,570 12.9% 10.0% (78,016) 33.43$ 63.25$ - 905,722
Downtown Total A 125 37,582,541 1,676,664 4.5% 2.4% 2,669,614 9.8% 7.1% 137,878 27.30$ 51.76$ 940,000 500,000
Downtown Total B 196 22,785,072 464,034 2.0% 2.3% 899,274 17.7% 3.9% 53,294 22.99$ 44.38$ - 75,000
Downtown Total All 336 77,412,199 3,128,713 4.0% 3.0% 5,269,458 12.1% 6.8% 113,156 28.93$ 54.98$ 940,000 1,480,722
Survey results presented on this report have been condensed for reference. Results are updated periodically to ensure accuracy and therefore historically published results are subject to change.
Notes:
1
Office Inventory: For the purpose of this report, buildings with less than 20,000 SF of office space and buildings owned and occupied by the government have not been included in the office inventory.
2
Vacancy Rate: The Vacancy Rate is the amount of vacant space divided by the existing building inventory. Vacant space is physically unoccupied, and it includes both headlease and sublease space.
3
Proportion of Sublease Availability: This ratio represents the share of available sublease space of the total available space.
4
Availability Rate: The Availability Rate is the amount of available space divided by the building inventory base. Available space is space that is available for lease and can be occupied, vacant or unknown.
5
Average Rental Rates: Average rental rates are calculated from available spaces, which also quote rental figures.
6
Absorption: Absorption is the difference in occupied space from quarter to quarter or year-over-year.
7
Currently Under Construction: Total square feet for currently under construction includes all buildings, even where building class is un-listed.
Colliers Downtown | Office Statistics
2017 Q1
3. Office Market / Submarket Class
# of
Buildings Office Inventory Vacant Space Vacancy Rate
Prior Quarter
Vacancy Rate Available Space
Proportion of
Sublease
Availability
Availability
Rate
Absorption
Current Quarter
Wgt Avg.
Asking Net
Rent
Wgt Avg.
Asking Gross
Rent Net New Supply
Currently Under
Construction
Yonge-Bloor A 13 4,076,294 217,815 5.3% 2.6% 452,439 21.2% 11.1% (111,072) 25.39$ 47.61$ - -
Yonge-Bloor B 43 5,547,886 135,073 2.4% 3.0% 199,808 11.2% 3.6% 33,137 22.04$ 42.15$ - -
Yonge-Bloor All 56 9,624,180 352,888 3.7% 2.9% 652,247 18.1% 6.8% (77,935) 24.37$ 45.94$ - -
Yonge-St.Clair A 6 896,638 17,545 2.0% 3.1% 19,047 7.9% 2.1% 10,409 21.48$ 43.53$ - -
Yonge-St.Clair B 17 1,727,937 59,333 3.4% 3.8% 90,374 12.3% 5.2% 5,743 19.41$ 38.95$ - -
Yonge-St.Clair All 23 2,624,575 76,878 2.9% 3.5% 109,421 11.5% 4.2% 16,152 19.93$ 40.10$ - -
Yonge-Eglinton A 9 1,470,253 35,173 2.4% 7.0% 51,139 22.2% 3.5% 67,269 17.52$ 39.16$ - -
Yonge-Eglinton B 31 2,882,201 88,518 3.1% 3.4% 135,202 18.1% 4.7% 10,480 17.43$ 36.08$ - -
Yonge-Eglinton All 40 4,352,454 123,691 2.8% 4.6% 186,341 19.2% 4.3% 77,749 17.45$ 36.89$ - -
Toronto West A 1 38,500 - 0.0% 0.0% - 0.0% 0.0% - - - - -
Toronto West B 11 632,949 4,500 0.7% 0.7% 5,818 0.0% 0.9% - - - - -
Toronto West All 12 671,449 4,500 0.7% 0.7% 5,818 0.0% 0.9% - - - - -
Midtown Total A 29 6,481,685 270,533 4.2% 3.7% 522,625 20.8% 8.1% (33,394) 24.54$ 46.70$ - -
Midtown Total B 102 10,790,973 287,424 2.7% 3.1% 431,202 13.4% 4.0% 49,360 20.10$ 39.65$ - -
Midtown Total All 131 17,272,658 557,957 3.2% 3.3% 953,827 17.5% 5.5% 15,966 22.63$ 43.66$ - -
Survey results presented on this report have been condensed for reference. Results are updated periodically to ensure accuracy and therefore historically published results are subject to change.
Notes:
1
Office Inventory: For the purpose of this report, buildings with less than 20,000 SF of office space and buildings owned and occupied by the government have not been included in the office inventory.
2
Vacancy Rate: The Vacancy Rate is the amount of vacant space divided by the existing building inventory. Vacant space is physically unoccupied, and it includes both headlease and sublease space.
3
Proportion of Sublease Availability: This ratio represents the share of available sublease space of the total available space.
4
Availability Rate: The Availability Rate is the amount of available space divided by the building inventory base. Available space is space that is available for lease and can be occupied, vacant or unknown.
5
Average Rental Rates: Average rental rates are calculated from available spaces, which also quote rental figures.
6
Absorption: Absorption is the difference in occupied space from quarter to quarter or year-over-year.
7
Currently Under Construction: Total square feet for currently under construction includes all buildings, even where building class is un-listed.
Colliers Midtown | Office Statistics
2017 Q1
4. Office Market / Submarket Class
# of
Buildings Office Inventory Vacant Space Vacancy Rate
Prior Quarter
Vacancy Rate Available Space
Proportion of
Sublease
Availability
Availability
Rate
Absorption
Current Quarter
Wgt Avg.
Asking Net
Rent
Wgt Avg.
Asking Gross
Rent Net New Supply
Currently Under
Construction
Don Mills/Eglinton A 8 1,081,359 203,398 18.8% 18.8% 226,830 12.4% 21.0% (302) 12.35$ 29.11$ - -
Don Mills/Eglinton B 42 4,786,521 98,976 2.1% 2.0% 103,970 0.0% 2.2% (4,820) 10.56$ 25.92$ - -
Don Mills/Eglinton All 50 5,867,880 302,374 5.2% 5.1% 330,800 8.5% 5.6% (5,122) 11.84$ 28.19$ - -
Duncan Mill A 5 526,196 764 0.1% 4.8% 4,354 0.0% 0.8% 24,492 14.50$ 30.11$ - -
Duncan Mill B 27 1,632,323 67,902 4.2% 4.7% 71,585 9.1% 4.4% 8,545 9.72$ 23.19$ - -
Duncan Mill All 32 2,158,519 68,666 3.2% 4.7% 75,939 8.6% 3.5% 33,037 10.05$ 23.67$ - -
Consumers Road A 7 1,305,491 202,372 15.5% 5.2% 217,218 5.2% 16.6% (134,403) 13.12$ 30.88$ - -
Consumers Road B 26 3,089,296 266,772 8.6% 8.6% 357,463 13.9% 11.6% (650) 12.42$ 28.30$ - -
Consumers Road All 33 4,394,787 469,144 10.7% 7.6% 574,681 10.6% 13.1% (135,053) 12.53$ 28.68$ - -
Woodbine/Steeles A 20 3,798,351 251,423 6.6% 4.8% 262,722 1.0% 6.9% (67,338) 17.29$ 33.06$ - -
Woodbine/Steeles B 31 2,269,242 75,079 3.3% 3.0% 106,218 5.4% 4.7% (6,180) 11.05$ 22.52$ - -
Woodbine/Steeles All 51 6,067,593 326,502 5.4% 4.2% 368,940 2.3% 6.1% (73,518) 15.56$ 30.15$ - -
Toronto East A 2 101,376 - 0.0% 0.0% - 0.0% 0.0% - - - - -
Toronto East B 4 202,288 - 0.0% 0.0% - 0.0% 0.0% - - - - -
Toronto East All 6 303,664 - 0.0% 0.0% - 0.0% 0.0% - - - - -
Central East Total A 42 6,812,773 657,957 9.7% 7.1% 711,124 5.9% 10.4% (177,551) 14.91$ 31.24$ - -
Central East Total B 130 11,979,670 508,729 4.2% 4.2% 639,236 9.7% 5.3% (3,105) 11.43$ 25.96$ - -
Central East Total All 172 18,792,443 1,166,686 6.2% 5.2% 1,350,360 7.7% 7.2% (180,656) 13.27$ 28.74$ - -
Survey results presented on this report have been condensed for reference. Results are updated periodically to ensure accuracy and therefore historically published results are subject to change.
Notes:
1
Office Inventory: For the purpose of this report, buildings with less than 20,000 SF of office space and buildings owned and occupied by the government have not been included in the office inventory.
2
Vacancy Rate: The Vacancy Rate is the amount of vacant space divided by the existing building inventory. Vacant space is physically unoccupied, and it includes both headlease and sublease space.
3
Proportion of Sublease Availability: This ratio represents the share of available sublease space of the total available space.
4
Availability Rate: The Availability Rate is the amount of available space divided by the building inventory base. Available space is space that is available for lease and can be occupied, vacant or unknown.
5
Average Rental Rates: Average rental rates are calculated from available spaces, which also quote rental figures.
6
Absorption: Absorption is the difference in occupied space from quarter to quarter or year-over-year.
7
Currently Under Construction: Total square feet for currently under construction includes all buildings, even where building class is un-listed.
Colliers Central East | Office Statistics
2017 Q1
5. Office Market / Submarket Class
# of
Buildings Office Inventory Vacant Space Vacancy Rate
Prior Quarter
Vacancy Rate Available Space
Proportion of
Sublease
Availability
Availability
Rate
Absorption
Current Quarter
Wgt Avg.
Asking Net
Rent
Wgt Avg.
Asking Gross
Rent Net New Supply
Currently Under
Construction
Yorkdale A 5 1,348,346 33,152 2.5% 2.4% 38,090 12.4% 2.8% (814) 14.32$ 34.02$ - -
Yorkdale B 14 832,842 3,899 0.5% 0.2% 16,119 0.0% 1.9% (2,447) 9.95$ 25.45$ - -
Yorkdale All 19 2,181,188 37,051 1.7% 1.5% 54,209 8.7% 2.5% (3,261) 13.05$ 31.53$ - -
Dufferin/Finch A 1 71,658 - 0.0% 0.0% - 0.0% 0.0% - - - - -
Dufferin/Finch B 19 1,552,607 37,128 2.4% 2.4% 41,933 0.0% 2.7% - 9.25$ 25.34$ - -
Dufferin/Finch All 20 1,624,265 37,128 2.3% 2.3% 41,933 0.0% 2.6% - 9.25$ 25.34$ - -
North Yonge Corridor A 22 6,981,925 656,906 9.4% 7.6% 981,123 19.1% 14.1% (124,760) 19.48$ 40.10$ - -
North Yonge Corridor B 28 2,790,732 38,744 1.4% 1.5% 78,803 24.8% 2.8% 4,190 17.87$ 35.67$ - -
North Yonge Corridor All 50 9,772,657 695,650 7.1% 5.9% 1,059,926 19.6% 10.8% (120,570) 19.35$ 39.75$ - -
Central North Total A 28 8,401,929 690,058 8.2% 6.7% 1,019,213 18.9% 12.1% (125,574) 19.21$ 39.78$ - -
Central North Total B 61 5,176,181 79,771 1.5% 1.6% 136,855 14.3% 2.6% 1,743 14.46$ 31.46$ - -
Central North Total All 89 13,578,110 769,829 5.7% 4.8% 1,156,068 18.3% 8.5% (123,831) 18.64$ 38.79$ - -
Survey results presented on this report have been condensed for reference. Results are updated periodically to ensure accuracy and therefore historically published results are subject to change.
Notes:
1
Office Inventory: For the purpose of this report, buildings with less than 20,000 SF of office space and buildings owned and occupied by the government have not been included in the office inventory.
2
Vacancy Rate: The Vacancy Rate is the amount of vacant space divided by the existing building inventory. Vacant space is physically unoccupied, and it includes both headlease and sublease space.
3
Proportion of Sublease Availability: This ratio represents the share of available sublease space of the total available space.
4
Availability Rate: The Availability Rate is the amount of available space divided by the building inventory base. Available space is space that is available for lease and can be occupied, vacant or unknown.
5
Average Rental Rates: Average rental rates are calculated from available spaces, which also quote rental figures.
6
Absorption: Absorption is the difference in occupied space from quarter to quarter or year-over-year.
7
Currently Under Construction: Total square feet for currently under construction includes all buildings, even where building class is un-listed.
Colliers Central North | Office Statistics
2017 Q1
6. Office Market / Submarket Class
# of
Buildings Office Inventory Vacant Space Vacancy Rate
Prior Quarter
Vacancy Rate Available Space
Proportion of
Sublease
Availability
Availability
Rate
Absorption
Current Quarter
Wgt Avg.
Asking Net
Rent
Wgt Avg.
Asking Gross
Rent Net New Supply
Currently Under
Construction
Vaughan A 33 2,620,523 170,642 6.5% 8.6% 195,179 12.0% 7.4% 178,847 18.06$ 29.83$ 136,000 -
Vaughan B 23 1,015,258 30,975 3.1% 2.5% 55,320 0.0% 5.4% 31,711 16.94$ 26.62$ 38,673 -
Vaughan All 56 3,635,781 201,617 5.5% 6.9% 250,499 9.4% 6.9% 210,558 17.68$ 28.73$ 174,673 -
Richmond Hill A 5 586,529 - 0.0% 0.0% - 0.0% 0.0% - - - - -
Richmond Hill B 6 261,873 3,099 1.2% 1.2% 4,346 0.0% 1.7% - 12.05$ 24.72$ - -
Richmond Hill All 11 848,402 3,099 0.4% 0.4% 4,346 0.0% 0.5% - 12.05$ 24.72$ - -
Hwy 404-Hwy 407 A 57 6,680,063 513,287 7.7% 6.4% 656,864 19.0% 9.8% (84,120) 17.27$ 31.37$ - -
Hwy 404-Hwy 407 B 45 2,240,198 72,995 3.3% 3.3% 101,161 20.6% 4.5% 657 13.71$ 26.58$ - -
Hwy 404-Hwy 407 All 102 8,920,261 586,282 6.6% 5.6% 758,025 19.2% 8.5% (83,463) 16.74$ 30.65$ - -
Markham Town Centre A 15 1,798,910 256,062 14.2% 20.5% 262,905 5.7% 14.6% 113,177 17.90$ 31.62$ - -
Markham Town Centre B 13 862,328 - 0.0% 0.0% 3,753 0.0% 0.4% - 8.28$ 14.52$ - -
Markham Town Centre All 28 2,661,238 256,062 9.6% 13.9% 266,658 5.6% 10.0% 113,177 17.76$ 31.36$ - -
GTA North Total A 110 11,686,025 939,991 8.0% 8.8% 1,114,948 14.7% 9.5% 207,904 17.57$ 31.24$ 136,000 -
GTA North Total B 87 4,379,657 107,069 2.4% 2.3% 164,580 12.6% 3.8% 32,368 14.77$ 26.21$ 38,673 -
GTA North Total All 197 16,065,682 1,047,060 6.5% 7.0% 1,279,528 14.4% 8.0% 240,272 17.15$ 30.49$ 174,673 -
Survey results presented on this report have been condensed for reference. Results are updated periodically to ensure accuracy and therefore historically published results are subject to change.
Notes:
1
Office Inventory: For the purpose of this report, buildings with less than 20,000 SF of office space and buildings owned and occupied by the government have not been included in the office inventory.
2
Vacancy Rate: The Vacancy Rate is the amount of vacant space divided by the existing building inventory. Vacant space is physically unoccupied, and it includes both headlease and sublease space.
3
Proportion of Sublease Availability: This ratio represents the share of available sublease space of the total available space.
4
Availability Rate: The Availability Rate is the amount of available space divided by the building inventory base. Available space is space that is available for lease and can be occupied, vacant or unknown.
5
Average Rental Rates: Average rental rates are calculated from available spaces, which also quote rental figures.
6
Absorption: Absorption is the difference in occupied space from quarter to quarter or year-over-year.
7
Currently Under Construction: Total square feet for currently under construction includes all buildings, even where building class is un-listed.
Colliers GTA North | Office Statistics
2017 Q1
7. Office Market / Submarket Class
# of
Buildings Office Inventory Vacant Space Vacancy Rate
Prior Quarter
Vacancy Rate Available Space
Proportion of
Sublease
Availability
Availability
Rate
Absorption
Current Quarter
Wgt Avg.
Asking Net
Rent
Wgt Avg.
Asking Gross
Rent Net New Supply
Currently Under
Construction
Scarborough Town Centre A 11 2,066,430 174,963 8.5% 7.2% 225,962 23.7% 10.9% (25,499) 15.00$ 34.13$ - -
Scarborough Town Centre B 57 4,464,793 79,182 1.8% 2.0% 362,855 0.8% 8.1% 9,237 12.32$ 27.96$ - -
Scarborough Town Centre All 68 6,531,223 254,145 3.9% 3.6% 588,817 9.6% 9.0% (16,262) 13.24$ 30.08$ - -
Pickering/Oshawa A 12 1,160,217 46,616 4.0% 4.5% 46,616 0.0% 4.0% 5,343 12.17$ 24.51$ - -
Pickering/Oshawa B 26 1,913,114 93,706 4.9% 5.7% 130,086 0.0% 6.8% 15,865 13.09$ 25.16$ - -
Pickering/Oshawa All 38 3,073,331 140,322 4.6% 5.3% 176,702 0.0% 5.7% 21,208 12.84$ 24.99$ - -
GTA East Total A 23 3,226,647 221,579 6.9% 6.2% 272,578 19.7% 8.4% (20,156) 14.30$ 31.74$ - -
GTA East Total B 83 6,377,907 172,888 2.7% 3.1% 492,941 0.6% 7.7% 25,102 12.57$ 27.07$ - -
GTA East Total All 106 9,604,554 394,467 4.1% 4.2% 765,519 7.4% 8.0% 4,946 13.12$ 28.57$ - -
Survey results presented on this report have been condensed for reference. Results are updated periodically to ensure accuracy and therefore historically published results are subject to change.
Notes:
1
Office Inventory: For the purpose of this report, buildings with less than 20,000 SF of office space and buildings owned and occupied by the government have not been included in the office inventory.
2
Vacancy Rate: The Vacancy Rate is the amount of vacant space divided by the existing building inventory. Vacant space is physically unoccupied, and it includes both headlease and sublease space.
3
Proportion of Sublease Availability: This ratio represents the share of available sublease space of the total available space.
4
Availability Rate: The Availability Rate is the amount of available space divided by the building inventory base. Available space is space that is available for lease and can be occupied, vacant or unknown.
5
Average Rental Rates: Average rental rates are calculated from available spaces, which also quote rental figures.
6
Absorption: Absorption is the difference in occupied space from quarter to quarter or year-over-year.
7
Currently Under Construction: Total square feet for currently under construction includes all buildings, even where building class is un-listed.
Colliers GTA East | Office Statistics
2017 Q1
8. Office Market / Submarket Class
# of
Buildings Office Inventory Vacant Space Vacancy Rate
Prior Quarter
Vacancy Rate Available Space
Proportion of
Sublease
Availability
Availability
Rate
Absorption
Current Quarter
Wgt Avg.
Asking Net
Rent
Wgt Avg.
Asking Gross
Rent Net New Supply
Currently Under
Construction
Airport Corporate Centre A 31 3,663,717 412,235 11.3% 11.5% 548,871 40.4% 15.0% 7,365 16.25$ 31.26$ - -
Airport Corporate Centre B 18 1,245,092 12,710 1.0% 0.7% 33,998 55.4% 2.7% (3,538) 11.58$ 21.29$ - -
Airport Corporate Centre All 49 4,908,809 424,945 8.7% 8.7% 582,869 41.3% 11.9% 3,827 15.85$ 30.39$ - -
Airport East A 9 1,108,286 300,327 27.1% 30.7% 317,741 5.5% 28.7% 39,961 14.10$ 28.63$ - -
Airport East B 49 3,006,779 348,222 11.6% 13.1% 451,994 8.1% 15.0% 44,384 12.48$ 26.35$ - -
Airport East All 58 4,115,065 648,549 15.8% 17.8% 769,735 7.0% 18.7% 84,345 13.15$ 27.29$ - -
Airport West A 23 2,942,329 114,990 3.9% 3.9% 114,990 43.3% 3.9% 1,038 13.48$ 23.20$ - -
Airport West B 22 1,256,312 62,889 5.0% 3.9% 68,865 8.1% 5.5% (13,361) 10.64$ 23.10$ - -
Airport West All 45 4,198,641 177,879 4.2% 3.9% 183,855 30.1% 4.4% (12,323) 12.08$ 23.15$ - -
Brampton A 17 1,214,017 123,822 10.2% 12.4% 124,972 0.0% 10.3% 26,391 15.60$ 27.80$ - -
Brampton B 24 2,920,650 97,734 3.3% 2.2% 108,629 69.9% 3.7% (32,183) 14.87$ 28.00$ - -
Brampton All 41 4,134,667 221,556 5.4% 5.2% 233,601 32.5% 5.6% (5,792) 15.46$ 27.84$ - -
Burlington A 25 2,106,629 118,529 5.6% 10.9% 194,393 4.5% 9.2% 112,087 17.63$ 30.71$ - -
Burlington B 32 1,406,737 68,197 4.8% 7.4% 98,684 3.5% 7.0% 35,699 14.57$ 23.54$ - -
Burlington All 57 3,513,366 186,726 5.3% 9.5% 293,077 4.2% 8.3% 147,786 16.60$ 28.30$ - -
Cooksville A 2 150,534 - 0.0% 1.9% - 0.0% 0.0% 2,887 - - - -
Cooksville B 15 1,109,467 51,689 4.7% 4.2% 63,390 3.2% 5.7% (5,092) 15.39$ 28.74$ - -
Cooksville All 17 1,260,001 51,689 4.1% 3.9% 63,390 3.2% 5.0% (2,205) 15.39$ 28.74$ - -
Hwy 401-Hurontario A 26 3,029,007 204,865 6.8% 5.3% 298,167 38.2% 9.8% (43,851) 14.82$ 28.80$ - -
Hwy 401-Hurontario B 15 805,245 168,502 20.9% 20.1% 190,987 6.4% 23.7% (6,502) 12.65$ 24.78$ - -
Hwy 401-Hurontario All 41 3,834,252 373,367 9.7% 8.4% 489,154 25.8% 12.8% (50,353) 13.70$ 26.72$ - -
Hwy 427/Bloor/Islington A 11 2,101,631 155,632 7.4% 9.8% 188,530 0.0% 9.0% 50,439 19.33$ 35.27$ - -
Hwy 427/Bloor/Islington B 43 2,396,523 375,549 15.7% 19.4% 415,945 6.8% 17.4% 89,647 12.86$ 30.13$ - -
Hwy 427/Bloor/Islington All 54 4,498,154 531,181 11.8% 14.9% 604,475 4.7% 13.4% 140,086 16.47$ 33.00$ - -
Meadowvale A 32 4,684,613 640,677 13.7% 12.5% 681,024 34.2% 14.5% (56,648) 20.59$ 33.46$ - -
Meadowvale B 28 1,956,406 247,441 12.6% 10.9% 291,039 0.0% 14.9% (34,397) 17.29$ 28.50$ - -
Meadowvale All 60 6,641,019 888,118 13.4% 12.0% 972,063 23.9% 14.6% (91,045) 19.55$ 31.90$ - -
Mississauga City Centre A 18 3,210,382 423,618 13.2% 12.7% 449,211 5.8% 14.0% (16,302) 17.08$ 33.50$ - -
Mississauga City Centre B 17 1,233,421 96,565 7.8% 7.7% 112,826 0.0% 9.1% (1,201) 17.15$ 34.28$ - -
Mississauga City Centre All 35 4,443,803 520,183 11.7% 11.3% 562,037 4.6% 12.6% (17,503) 17.10$ 33.69$ - -
Oakville A 25 1,927,848 159,023 8.2% 6.3% 266,881 9.8% 13.8% 59,222 19.53$ 32.34$ 104,000 -
Oakville B 18 1,094,759 92,133 8.4% 9.3% 110,820 1.0% 10.1% 9,833 15.65$ 29.56$ - -
Oakville All 43 3,022,607 251,156 8.3% 7.4% 377,701 7.2% 12.5% 69,055 18.26$ 31.43$ 104,000 -
Sheridan-Winston A 14 1,609,716 233,681 14.5% 16.6% 572,511 2.0% 35.6% 34,261 22.16$ 35.41$ - -
Sheridan-Winston B 24 1,349,286 92,048 6.8% 3.9% 146,630 0.0% 10.9% (39,155) 17.43$ 30.04$ - -
Sheridan-Winston All 38 2,959,002 325,729 11.0% 10.8% 719,141 1.6% 24.3% (4,894) 20.91$ 33.99$ - -
GTA West Total A 233 27,748,709 2,887,399 10.4% 10.9% 3,757,291 18.8% 13.5% 216,850 18.22$ 32.32$ 104,000 -
GTA West Total B 305 19,780,677 1,713,679 8.7% 8.9% 2,093,807 8.8% 10.6% 44,134 14.19$ 27.97$ - -
GTA West Total All 538 47,529,386 4,601,078 9.7% 10.0% 5,851,098 15.2% 12.3% 260,984 16.67$ 30.65$ 104,000 -
Survey results presented on this report have been condensed for reference. Results are updated periodically to ensure accuracy and therefore historically published results are subject to change.
Notes:
1
Office Inventory: For the purpose of this report, buildings with less than 20,000 SF of office space and buildings owned and occupied by the government have not been included in the office inventory.
2
Vacancy Rate: The Vacancy Rate is the amount of vacant space divided by the existing building inventory. Vacant space is physically unoccupied, and it includes both headlease and sublease space.
3
Proportion of Sublease Availability: This ratio represents the share of available sublease space of the total available space.
4
Availability Rate: The Availability Rate is the amount of available space divided by the building inventory base. Available space is space that is available for lease and can be occupied, vacant or unknown.
5
Average Rental Rates: Average rental rates are calculated from available spaces, which also quote rental figures.
6
Absorption: Absorption is the difference in occupied space from quarter to quarter or year-over-year.
7
Currently Under Construction: Total square feet for currently under construction includes all buildings, even where building class is un-listed.
Colliers GTA West | Office Statistics
2017 Q1