Windsor dec 2013 stats
•
1 like•218 views

Dec 2013 real estate statistics for Windsor, CT

Recommended
More Related Content
Viewers also liked
Similar to Windsor dec 2013 stats
Similar to Windsor dec 2013 stats (20)
More from Mary Beth Welsh
More from Mary Beth Welsh (13)
Recently uploaded
Recently uploaded (20)
Windsor dec 2013 stats
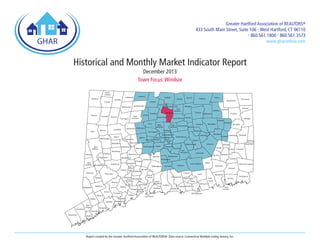
- 1. Greater Hartford Association of REALTORS® 433 South Main Street, Suite 106 • West Hartford, CT 06110 P 860.561.1800 F 860.561.3573 www.gharonline.com Historical and Monthly Market Indicator Report December 2013 Town Focus: Windsor North Canaan Hartland Colebrook Salisbury Cornwall Goshen Barkhamsted Canton New Hartford Torrington East Granby Windsor Locks East Windsor Windsor Simsbury Bloomfield Avon Farmington Morris Washington Bethlehem Roxbury Sherman Waterbury Naugatuck Oxford Danbury Woodbridge Ansonia Easton Weston Wilton Fairfield Greenwich New Canaan Trumbull Stratford Bridgeport Wallingford Orange West Haven Milford Putnam Eastford Pomfret Chaplin Mansfield Coventry Killingly Hampton Windham Canterbury Plainfield Scotland Columbia Glastonbury Hebron Sterling Lebanon Marlborough Portland Colchester Bozrah Lisbon Haddam East Haddam Chester Branford Griswold Norwich Preston Killingworth North Branford Voluntown Sprague Franklin East Hampton Middletown Durham Brooklyn Andover Cromwell North Haven New Haven Derby Shelton Redding Ashford Willington Middlefield Cheshire Beacon Falls Bethany Hamden Seymour Monroe Stamford Prospect Newtown Bethel Ridgefield Berlin Meriden Middlebury Southbury Brookfield Southington Tolland Hartford Woodbury Bridgewater New Fairfield Wolcott Thompson Woodstock Ellington East Manchester Bolton Hartford Wethersfield Bristol New Newington Thomaston Britain Plainville Rocky Plymouth Hill Watertown New Milford Union Stafford South Windsor Vernon West Hartford Harwinton Burlington Litchfield Warren Kent Somers Enfield Granby Winchester Sharon Suffield Norfolk Canaan Salem Montville Lyme Deep River Essex North Stonington Ledyard Waterford East Lyme Groton Old Lyme Guilford Clinton Westbrook Madison New London Old Saybrook East Haven Westport Norwalk Darien Report created by the Greater Hartford Association of REALTORS®. Data source: Connecticut Multiple Listing Service, Inc. Stonington
- 2. Table of Contents Graph Data - 2008 to 2013 Town Focus - Windsor Average Days on Market......................................................... 3 New Listings............................................................................ 4 Inventory.................................................................................. 5 Closed Sales........................................................................... 6 Median Sales Price................................................................. 7 Sales Price as Percent of List Price........................................ 8 Average Days on Market......................................................... 9 Closed Sales........................................................................... 10 Median Sales Price.................................................................. 11 Sales Price as Percent of List Price........................................ 12 The Greater Hartford Association of REALTORS® (GHAR) is the largest local real estate trade association in Connecticut, serving 3500+ members in the 57 town Greater Hartford real estate brokerage community. The Association provides technology, training, networking and business support to members, and supports a healthy real estate market by upholding high professional and ethical standards through a Code of Ethics, ongoing education and certification programs. As the advocate for the real estate brokerage industry, GHAR is the Voice for Real Estate® in the Greater Hartford region. For more information, call 860-561-1800 or visit www.gharonline.com.
- 3. Average Days on Market Single-family Residential 89 83 83 76 83 72 One Year Change: − 13.3% Two Year Change: − 13.3% One Year Change: − 8.4% Two Year Change: − 14.6% 2011 Historical Data 2012 December 2013 2011 2012 Year to Date 2013 110 100 90 80 70 60 50 2008 2009 2010 2011 2012 2013 Monthly Market Indicators 3
- 4. New Listings Single-family Residential 736 747 645 One Year Change: Two Year Change: 2011 Historical Data 2,200 2,000 1,800 1,600 1,400 1,200 1,000 800 600 2008 2012 December 2009 One Year Change: Two Year Change: 15.8% 1.5% 2013 2010 17,457 16,309 15,998 2011 2011 2012 Year to Date 2012 7.0% 9.1% 2013 2013 Monthly Market Indicators 4
- 5. Inventory Single-family Residential 5,456 4,923 5,122 Year to Date Inventory not applicable. One Year Change: 4.0% Two Year Change: − 6.1% 2011 2012 December 2013 Historical Data 8,000 7,000 6,000 5,000 4,000 3,000 2,000 1,000 0 Inventory Closed Sales 2008 2009 New Listings 2010 2011 2012 2013 Monthly Market Indicators 5
- 6. Closed Sales Single-family Residential 696 790 8,711 7,255 547 One Year Change: Two Year Change: 2011 Historical Data 1,600 1,400 1,200 1,000 800 600 400 200 0 2008 9,711 2012 December 2009 One Year Change: Two Year Change: 13.5% 44.4% 2013 2010 2011 2011 2012 Year to Date 2012 11.5% 33.9% 2013 2013 Monthly Market Indicators 6
- 7. Median Sales Price Single-family Residential $209,900 $207,450 $208,250 $221,500 One Year Change: 0.4% Two Year Change: – 0.8% 2011 Historical Data $270,000 $260,000 $250,000 $240,000 $230,000 $220,000 $210,000 $200,000 $190,000 $180,000 2008 2012 December 2009 One Year Change: 0.9% Two Year Change: – 0.7% 2013 2010 $220,000 $218,000 2011 2011 2012 Year to Date 2012 2013 2013 Monthly Market Indicators 7
- 8. Sales Price as a Percent of List Price Single-family Residential 95.5% 96.6% 96.8% One Year Change: Two Year Change: 2011 2012 December 0.2% 1.3% 2013 Historical Data 100% 99% 98% 97% 96% 95% 94% 2008 2009 2010 2011 2012 2013 Monthly Market Indicators 8
- 9. Average Days on Market Single-family Residential 89 83 76 76 71 68 One Year Change: − 8.4% Two Year Change: − 14.6% 2011 Historical Data 140 130 120 110 100 90 80 70 60 50 40 30 2008 2012 December – Market Area One Year Change: – 4.2% Two Year Change: – 10.5% 2013 2011 2012 December – Windsor Windsor 2009 2010 2013 Market Area 2011 2012 2013 Monthly Market Indicators 9
- 10. Closed Sales Single-family Residential 790 696 23 18 547 One Year Change: Two Year Change: 2011 Historical Data Market Area 1,300 2012 December – Market Area 18 13.5% 44.4% One Year Change: Two Year Change: 2013 2011 2012 December – Windsor 2013 Windsor 50 Market Area 1,100 27.8% 27.8% 40 Windsor 900 30 700 20 500 10 300 2008 2009 2010 2011 2012 2013 0 Monthly Market Indicators 10
- 11. Median Sales Price Single-family Residential $209,900 $207,450 $208,250 $179,000 $173,750 $161,000 One Year Change: – 7.3% Two Year Change: – 10.1% One Year Change: 0.4% Two Year Change: – 0.8% 2011 2012 December – Market Area 2013 2011 2012 December – Windsor 2013 Historical Data $280,000 Market Area $260,000 $240,000 $220,000 $200,000 $180,000 Windsor $160,000 $140,000 2008 2009 2010 2011 2012 2013 Monthly Market Indicators 11
- 12. Sales Price as a Percent of List Price Single-family Residential 95.5% 96.6% One Year Change: Two Year Change: 2011 2012 December – Market Area 97.1% 96.8% 95.7% 95.2% 0.2% 1.3% One Year Change: − 1.9% Two Year Change: − 0.5% 2013 2011 2012 December – Windsor 2013 Historical Data 100% 99% 98% 97% 96% 95% 94% 93% 92% 91% Market Area Windsor 2008 2009 2010 2011 2012 2013 Monthly Market Indicators 12